"Capital Efficient" and "Bootstrapped" in a Pitch Deck: 11
How to back up a capital-efficiency or bootstrapped claim on a pitch deck: money raised against revenue, burn multiple, Rule of 40.
"Capital Efficient" and "Bootstrapped" in a Pitch Deck: Show the Money In and the Result
"Capital efficient" and "bootstrapped" appear on many pitch decks. Both say the same thing to an investor: this team gets a lot done with little money, so the new round should go far. The claim is only useful when the slide shows both sides — how much money went in, and what it produced. This guide compares eleven real slides on whether they do.
TL;DR
Show the money in (raised to date, or "no outside capital" for a stated period) next to the result (revenue, run rate or another named outcome), or give a named ratio with its formula. CreatorDB gives a burn multiple with its definition and a Rule of 40 score with the year. MessageBird and GitLab pair "bootstrapped" with a run rate or team size. Wayfair states nine bootstrapped years beside a revenue chart. Prolific's slide was shared with its revenue figures blanked out. Coram and Task Pigeon state the label with no figure, and Ourobio counts grants and competition winnings as bootstrapping.
Capital-efficiency and bootstrapped claims on real pitch deck slides
Each example shows the exact stored slide above its analysis and links to the full teardown. Most fully defined first. Figures are quoted as shown; calculations are ours.
CreatorDB traction slide — slide 3
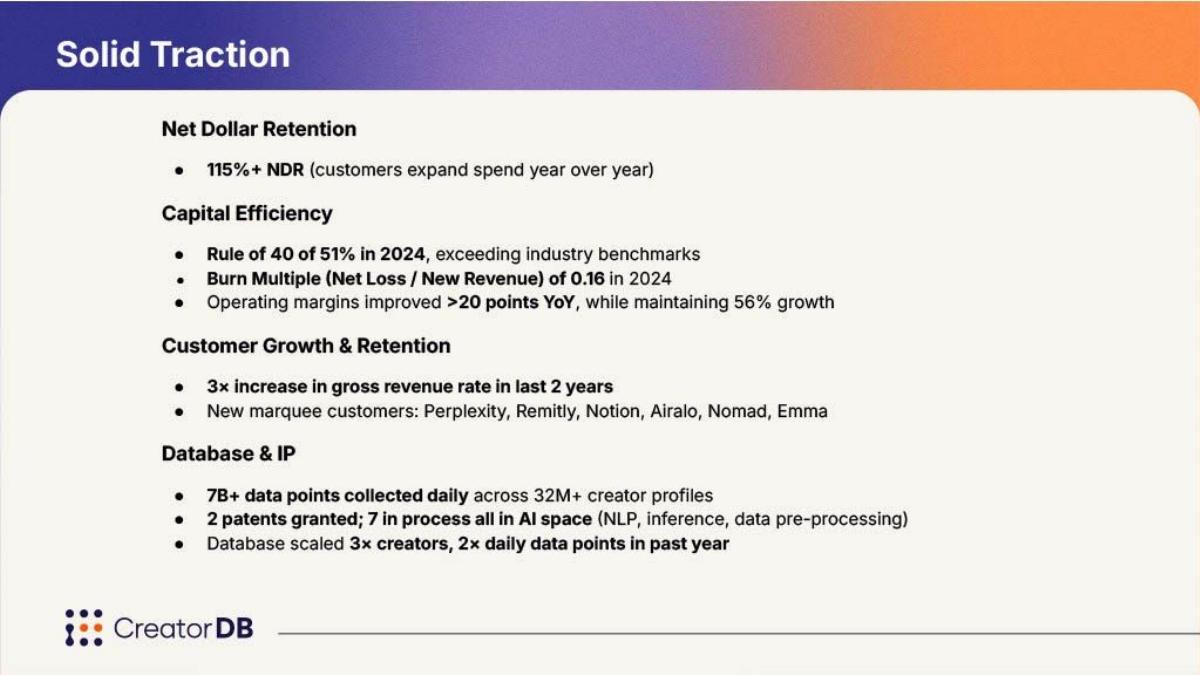
Influencer data company. A "Solid Traction" slide with four headed lists.
CreatorDB deck, slide 3. Exact stored slide matched to this analysis.
Our analysis: Two named ratios, each with a year, and a formula for one of them.
Evidence and limitation: If the Rule of 40 uses the 56% growth figure, 51% − 56% implies a margin of about −5%, which fits a company that is close to break-even and still reporting a net loss. The burn multiple is defined on the slide as net loss ÷ new revenue; the more common version uses net cash burn ÷ net new annual recurring revenue, so comparisons with other companies need care. 0.16 means about 16 cents of loss per dollar of new revenue.
What a founder can adapt: Give both parts of the Rule of 40: "Rule of 40: 51% (56% growth, −5% operating margin, 2024)."
Supporting analysis
What the deck claims: Under "Capital Efficiency": "Rule of 40 of 51% in 2024, exceeding industry benchmarks." "Burn Multiple (Net Loss / New Revenue) of 0.16 in 2024." "Operating margins improved >20 points YoY, while maintaining 56% growth." Also "115%+ NDR".
Presentation choice: A defined ratio lets a reader check and compare the claim instead of taking the label on trust.
When it does not fit: Don't give a burn multiple without saying what is in the top and bottom of the fraction.
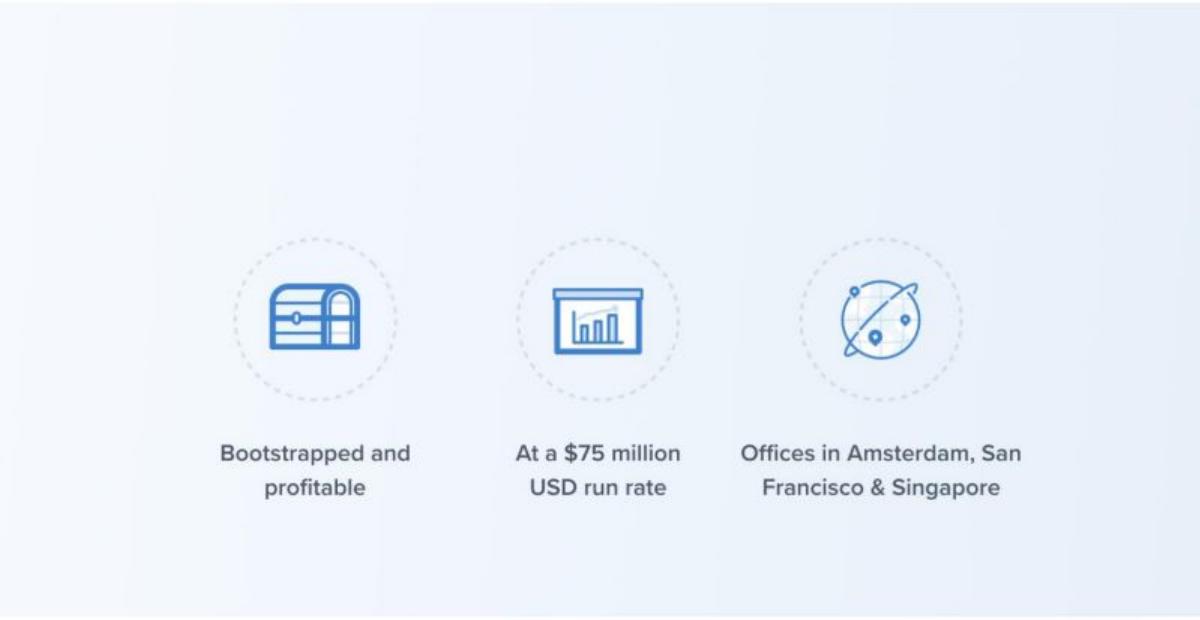
Business messaging platform. Three icons with short captions.
MessageBird deck, slide 3. Exact stored slide matched to this analysis.
Our analysis: A funding claim paired with a scale figure.
Evidence and limitation: "Bootstrapped" beside a $75M run rate is a strong pairing: it implies the business reached that scale on customer revenue. The slide doesn't give the period the run rate is based on, the profit measure or the date. Run rate is current revenue annualised, not a completed year.
What a founder can adapt: "No outside capital [year]–[year]; $75M run rate ([month] revenue × 12); EBITDA-positive since [date]."
Supporting analysis
What the deck claims: "Bootstrapped and profitable." "At a $75 million USD run rate." "Offices in Amsterdam, San Francisco & Singapore."
Presentation choice: Scale reached without outside money is the clearest form of capital efficiency.
When it does not fit: Don't leave "profitable" without a measure when it sits next to a large revenue figure.
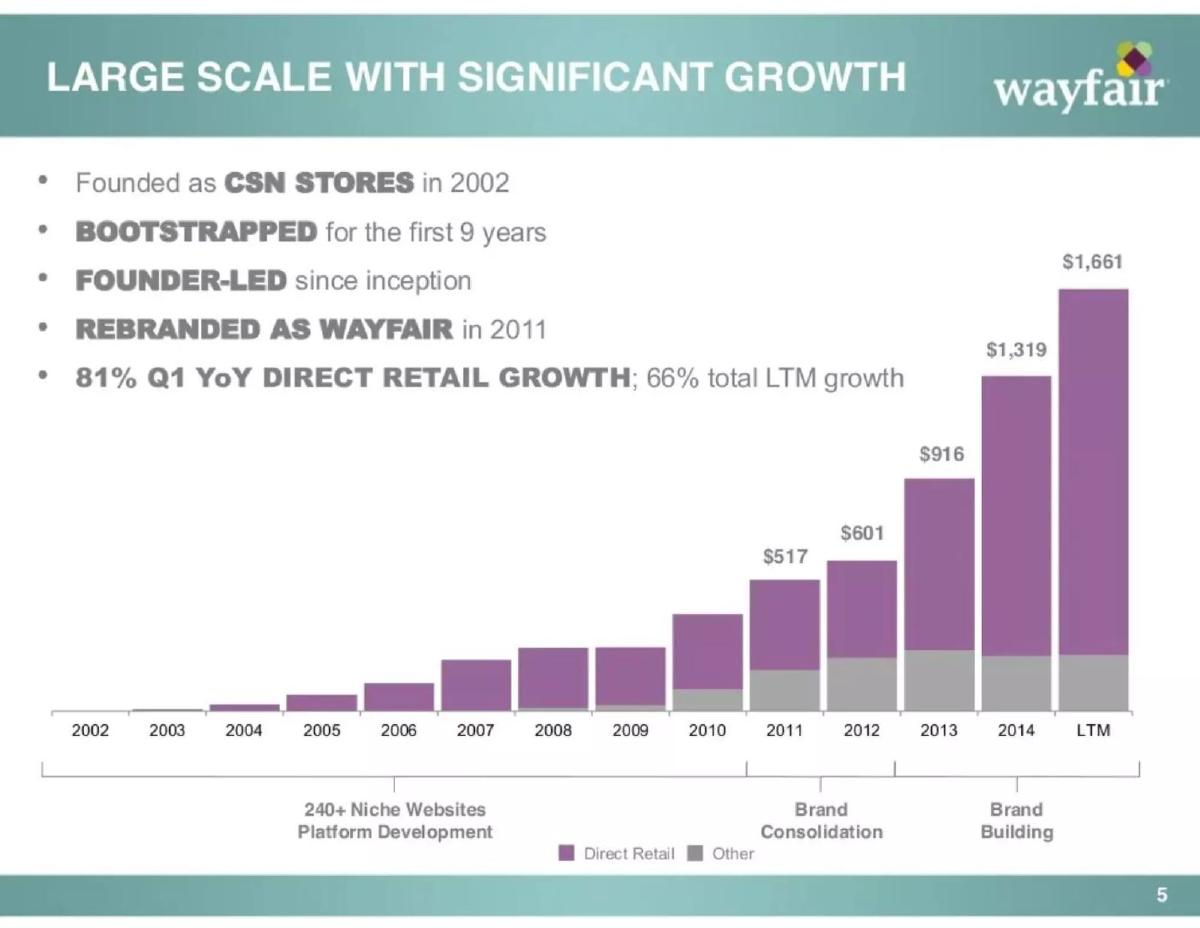
Online furniture retailer. Bullets above a bar chart from 2002 to "LTM".
Wayfair deck, slide 5. Exact stored slide matched to this analysis.
Our analysis: A dated bootstrapped period with the revenue reached during it.
Evidence and limitation: The chart has no unit label; the values read as millions of dollars of revenue, but the slide doesn't say. $1,661 ÷ $1,319 ≈ 1.26, a 26% rise from 2014 to the last twelve months, which differs from the stated 66% LTM growth — the two may use different periods or bases. "Bootstrapped for the first 9 years" gives a period (2002–2011) and the chart shows about $517 of revenue reached by the end of it.
What a founder can adapt: Label the chart: "Revenue, $M"; and match growth rates to the bars shown.
Supporting analysis
What the deck claims: "Founded as CSN Stores in 2002." "Bootstrapped for the first 9 years." "Founder-led since inception." "81% Q1 YoY direct retail growth; 66% total LTM growth." Bars rise to $517 (2011), $601, $916, $1,319 and $1,661 (LTM).
Presentation choice: A period plus the outcome at its end turns "bootstrapped" into a checkable fact.
When it does not fit: Don't show a chart without units beside a growth rate the bars don't reproduce.
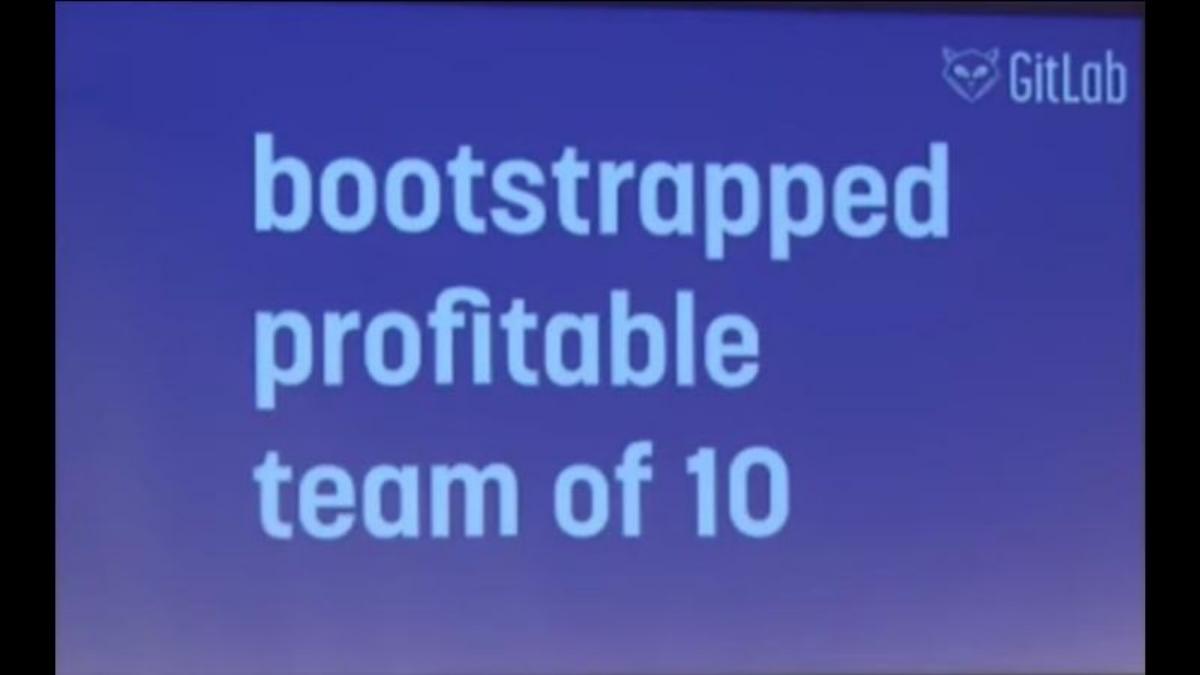
Software development platform, from an early deck. One slide of large text.
GitLab deck, slide 4. Exact stored slide matched to this analysis.
Our analysis: A small-team, self-funded claim with no financial figures.
Evidence and limitation: Team size is a proxy for cost: a team of 10 limits how much the company can be spending. The slide gives no revenue, profit measure or period, so a reader can't tell how much the company earned.
What a founder can adapt: "Bootstrapped to $[x] revenue with a team of 10; profitable since [date]."
Supporting analysis
What the deck claims: "bootstrapped profitable team of 10"
Presentation choice: Short and memorable; it signals discipline, but needs a revenue figure elsewhere to count as evidence.
When it does not fit: Don't rely on team size alone to prove efficiency.
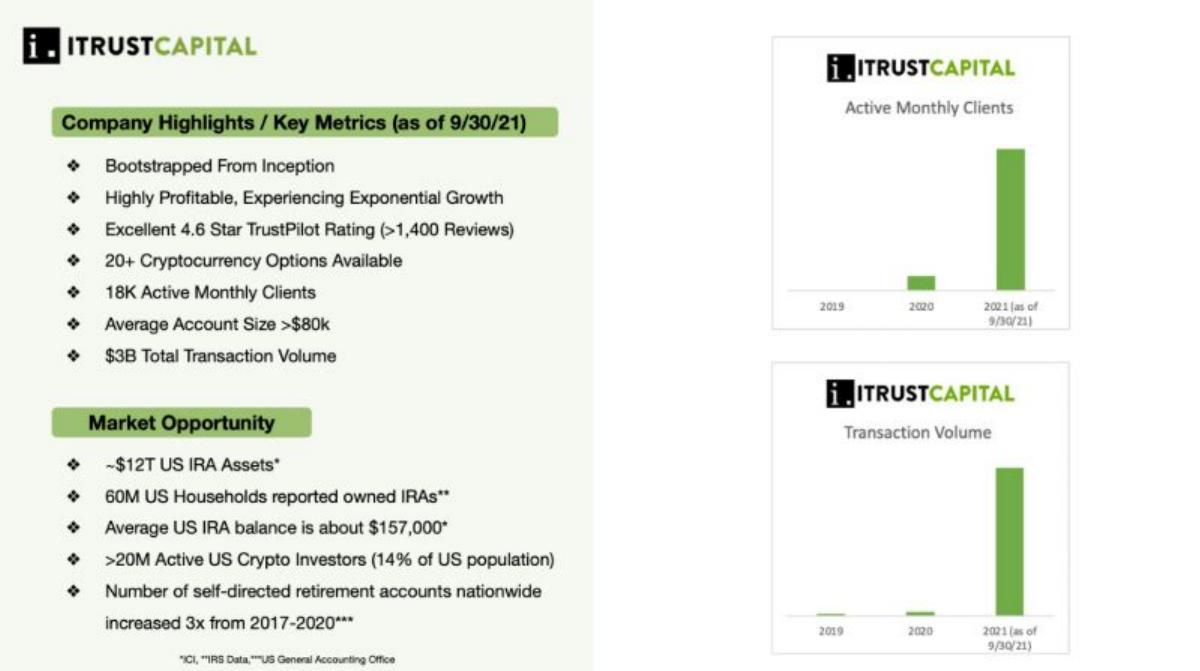
Crypto retirement account platform. "Company Highlights / Key Metrics (as of 9/30/21)" beside two bar charts.
iTrustCapital deck, slide 3. Exact stored slide matched to this analysis.
Our analysis: A dated bootstrapped claim with usage figures but no profit or revenue figure.
Evidence and limitation: The metrics are dated (30 September 2021), which is good. "Highly profitable" has no figure, and the charts have no axis values, so "exponential" can't be checked. 18,000 × $80,000 suggests roughly $1.4B or more held in accounts, though the slide doesn't state assets held.
What a founder can adapt: "Bootstrapped since [year]; revenue $[x] and net income $[y] in the 12 months to 30 Sep 2021."
Supporting analysis
What the deck claims: "Bootstrapped From Inception." "Highly Profitable, Experiencing Exponential Growth." "18K Active Monthly Clients." "Average Account Size >$80k." "$3B Total Transaction Volume." Charts: active monthly clients and transaction volume, 2019–2021, no axis values.
Presentation choice: Dating the metrics lets a reader place them; the profitability claim still needs a number.
When it does not fit: Don't use charts with no axis values to support "exponential".
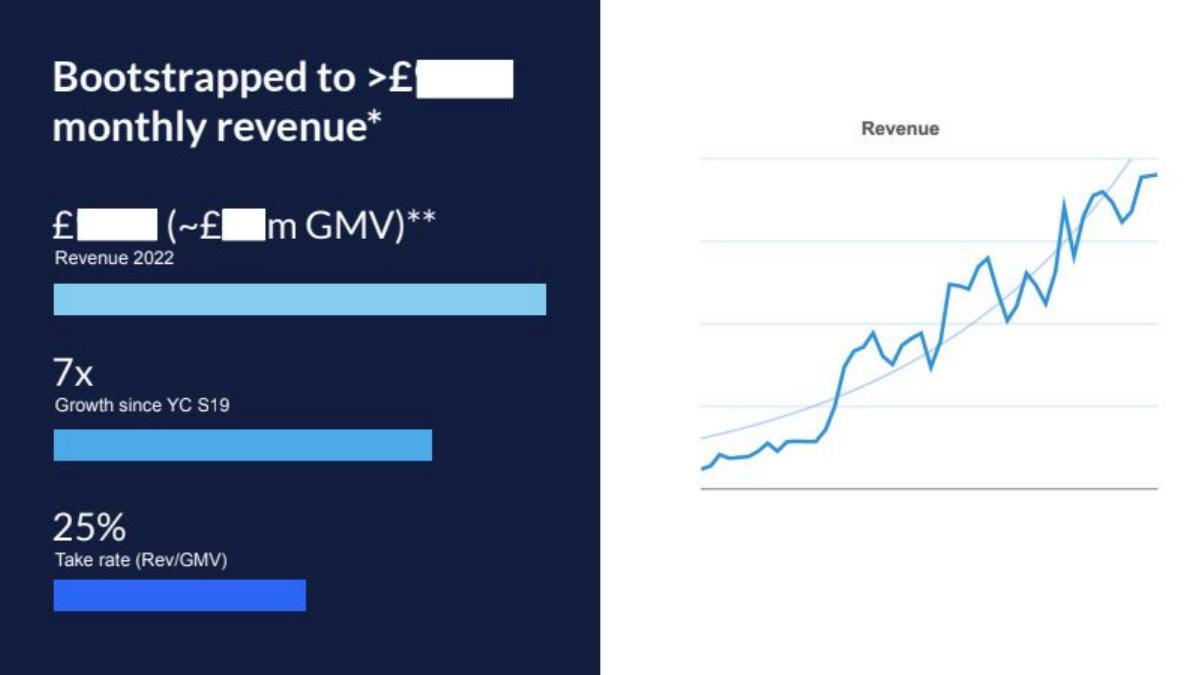
Online research participant platform. Headline figures on the left, a revenue line chart on the right. The revenue figures were blanked out before the deck was shared.
Prolific deck, slide 4. Exact stored slide matched to this analysis.
Our analysis: A well-built claim whose numbers are hidden in the shared copy.
Evidence and limitation: The structure is right: a bootstrapped claim tied to monthly revenue, with growth and take rate defined (revenue ÷ gross merchandise value). The values are blanked, so none can be checked here. The asterisks point to notes not visible on the slide. "Since YC S19" dates the growth to the company's Y Combinator batch (summer 2019).
What a founder can adapt: Keep the structure and fill in the figures in the version investors see.
Supporting analysis
What the deck claims: "Bootstrapped to >£[blanked] monthly revenue*." "£[blanked] (~£[blanked]m GMV)** Revenue 2022." "7x Growth since YC S19." "25% Take rate (Rev/GMV)."
Presentation choice: Tying "bootstrapped" to a revenue level, and defining take rate, is the pattern to follow.
When it does not fit: Don't leave footnote markers without the footnotes on the same slide.
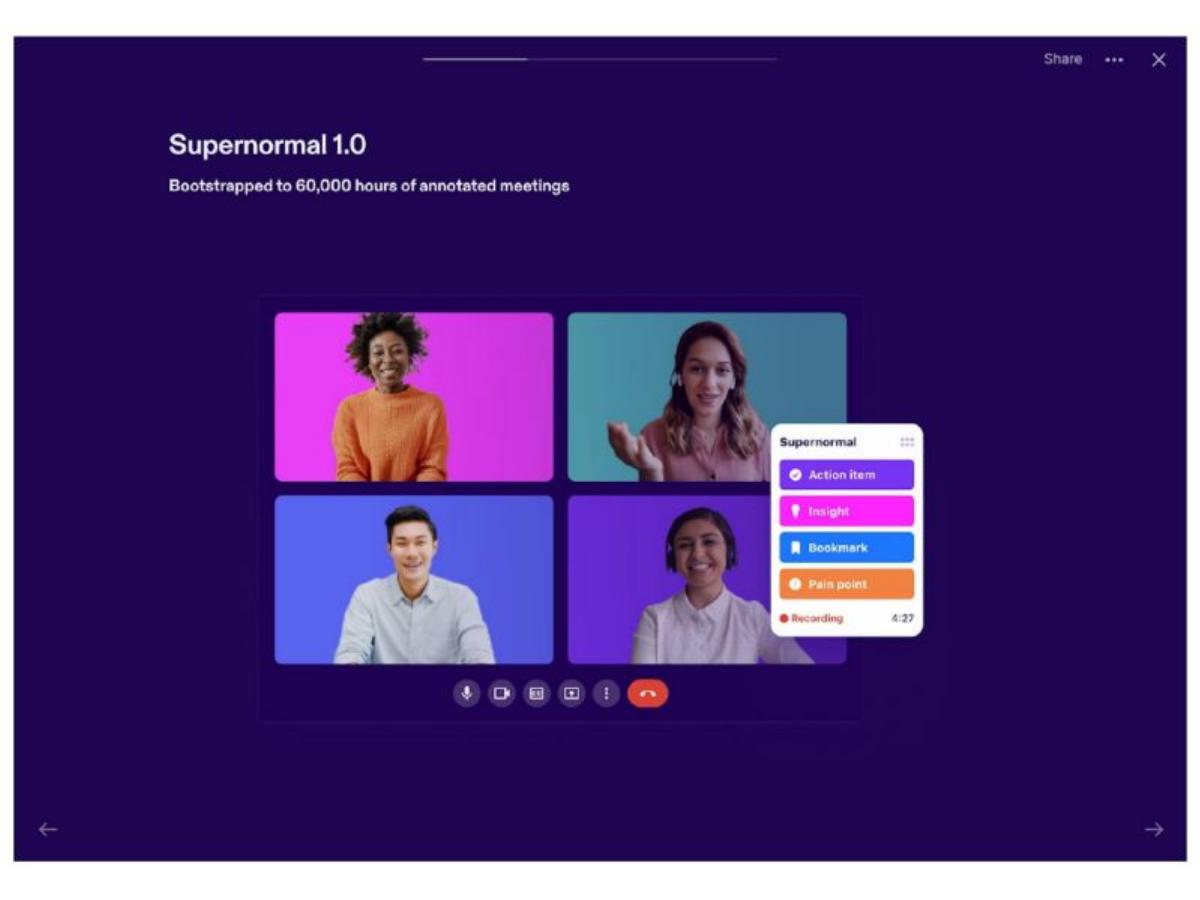
AI meeting notes company. A product screenshot headed "Supernormal 1.0".
Supernormal deck, slide 5. Exact stored slide matched to this analysis.
Our analysis: Bootstrapping applied to a non-financial result.
Evidence and limitation: Here "bootstrapped" describes a data asset built without outside money, not revenue. 60,000 hours is a specific, checkable figure; the slide doesn't say over what period or at what cost.
What a founder can adapt: "Built 60,000 hours of annotated meetings in [n] months with no outside funding."
Supporting analysis
What the deck claims: "Bootstrapped to 60,000 hours of annotated meetings."
Presentation choice: For an AI company, a large dataset built cheaply can be the efficiency story; naming the quantity makes it concrete.
When it does not fit: Don't let a data milestone be read as revenue traction.
Early-stage bio-materials company. An "Additional milestones" slide.
Ourobio deck, slide 6. Exact stored slide matched to this analysis.
Our analysis: Money in is stated, but the "bootstrapped" label covers grants.
Evidence and limitation: A government research grant (SBIR) and prize money are non-dilutive funding, not bootstrapping in the usual sense of customer or founder money. The slide is open about the sources, which is good, but a single $400k figure mixes them. Total funding shown is $400k + $200k = $600k.
What a founder can adapt: "$[x] in grants (EPA SBIR) and $[y] in prizes; $[z] founder funding; $200k raised from angels."
Supporting analysis
What the deck claims: "$400k bootstrapped, including EPA SBIR and a number of competitions/awards." "$200k raised from the Heritage Ventures Group and on RoundHere (where we are hosting our F&F / pre-seed extension)."
Presentation choice: Grants are a positive signal in their own right; naming them separately is stronger than folding them into "bootstrapped".
When it does not fit: Don't call grant funding bootstrapping.
AI video security company. A "Reasons To Be Excited About Coram" slide with six ticked items.
Coram deck, slide 6. Exact stored slide matched to this analysis.
Our analysis: A summary label with no number.
Evidence and limitation: No figure accompanies the claim on this slide. It works only if an earlier slide gives the money raised and revenue; on its own it is a label.
What a founder can adapt: "Very capital efficient: $[x] ARR on $[y] raised."
Supporting analysis
What the deck claims: Six ticks including "Very capital efficient" and "Rapid growth".
Presentation choice: Summary slides are fine for repeating a claim, not for making it for the first time.
When it does not fit: Don't introduce capital efficiency on a summary slide without the figure.
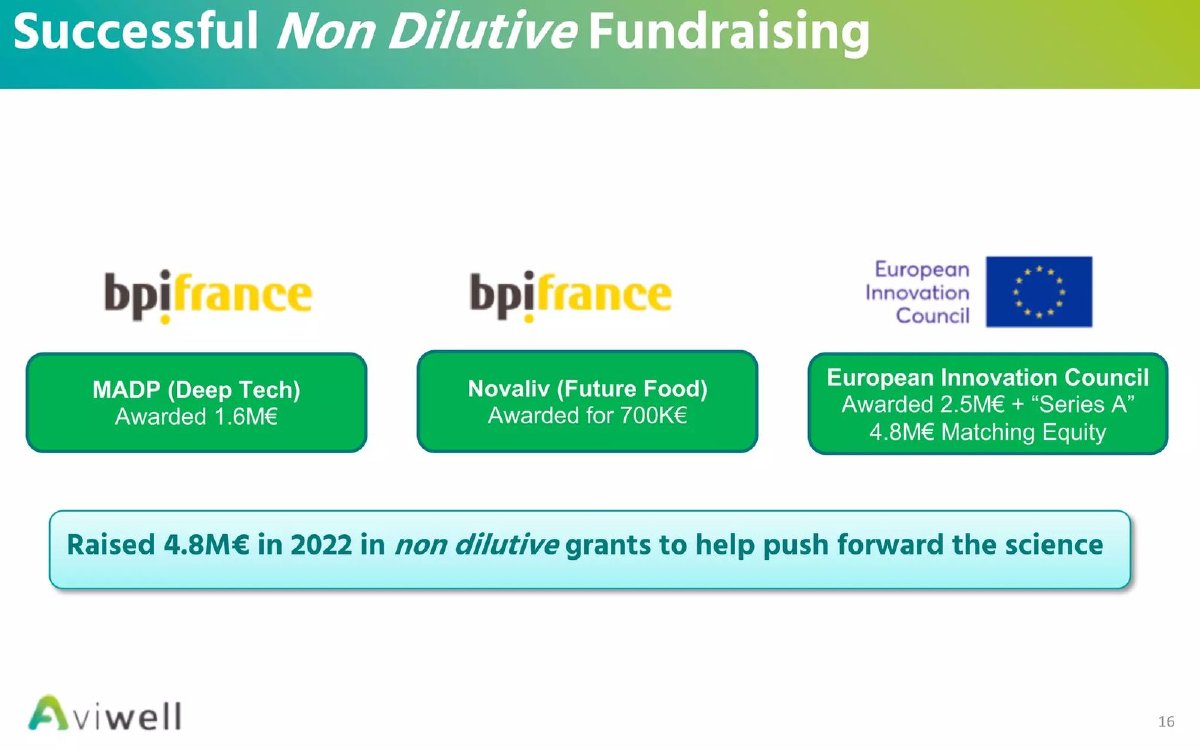
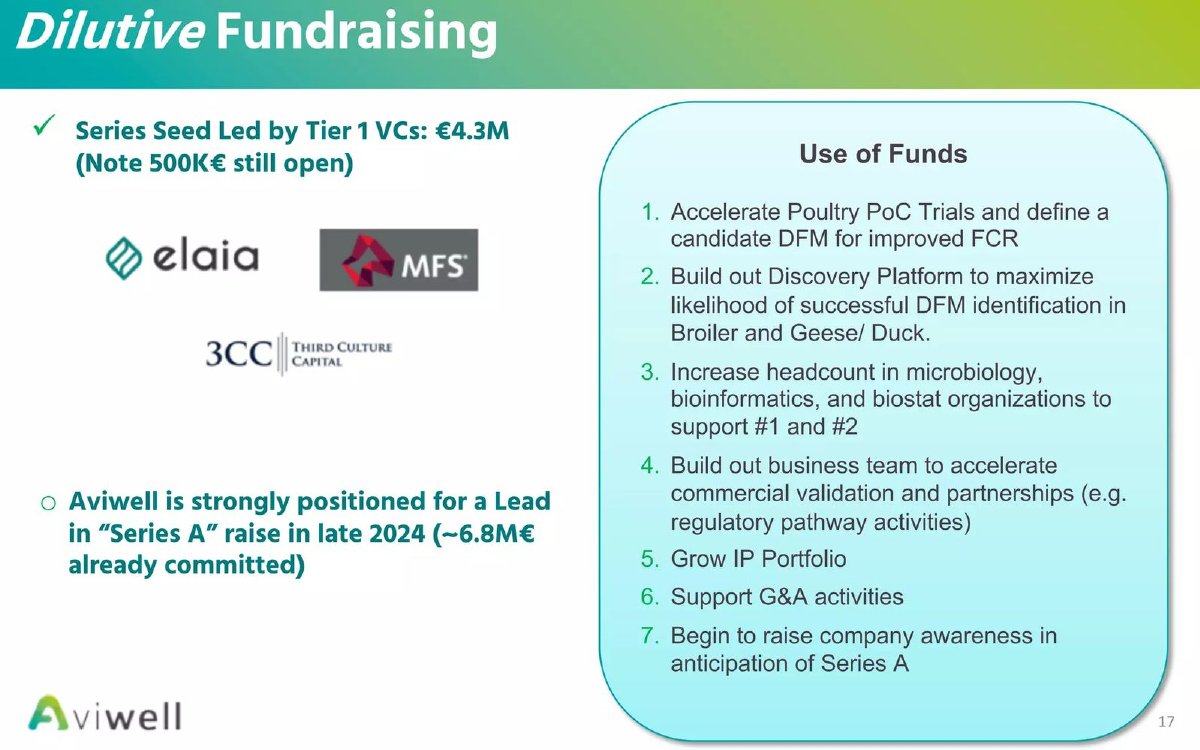
Agrifood biotech (microbiome products for poultry). Slide 16 is headed "Successful Non Dilutive Fundraising"; slide 17 is headed "Dilutive Fundraising".
Aviwell deck, slide 16. Exact stored slide matched to this analysis.Aviwell deck, slide 17. Exact stored slide matched to this analysis.
Our analysis: Grants and equity on separate slides, with an open balance flagged; cash received and terms are missing.
Evidence and limitation: The grant total reconciles: 1.6 + 0.7 + 2.5 = 4.8M€. The EIC's "4.8M€ Matching Equity" is a separate, equity-type item tied to a Series A, so it is not part of the grant total even though the number is the same. The slides say "awarded", not received, and give no payment schedule, conditions or repayment terms. The seed shows €4.3M with €500K still open, so the closed amount appears to be about €3.8M if the €500K is part of the €4.3M; the slide doesn't say which. How the ~6.8M€ Series A commitment relates to the EIC matching equity is not stated, so the two should not be added.
What a founder can adapt: "Grants awarded: €4.8M (Bpifrance €1.6M + €0.7M; EIC €2.5M). Received to date: €[x]. Conditions: [milestone-based / repayable advance / none]. Seed: €[closed] closed of €4.3M; €[open] open until [date]. Series A: €[x] committed, of which €[y] is the EIC matching equity [if so]."
Supporting analysis
What the deck claims: Slide 16: Bpifrance MADP (Deep Tech) "Awarded 1.6M€"; Bpifrance Novaliv (Future Food) "Awarded for 700K€"; European Innovation Council "Awarded 2.5M€ + 'Series A' 4.8M€ Matching Equity"; "Raised 4.8M€ in 2022 in non dilutive grants to help push forward the science". Slide 17: "Series Seed Led by Tier 1 VCs: €4.3M (Note 500K€ still open)"; "Aviwell is strongly positioned for a Lead in 'Series A' raise in late 2024 (~6.8M€ already committed)", beside a seven-item use of funds.
Presentation choice: An investor sizing runway needs to know which money is already in the bank, which is conditional, and which is still being raised.
When it does not fit: Don't write "raised" for money that is only awarded, and don't add matching equity or committed amounts to a grant total.
What each capital-efficiency claim tells the reader
Whether each slide shows the money in, the result, a named ratio and a period.
Example
Claim
Money in
Result shown
Period
Main gap
CreatorDB
Burn multiple 0.16; Rule of 40 51%
Via ratio
56% growth
2024
Non-standard burn formula
MessageBird
Bootstrapped and profitable
None outside
$75M run rate
Not stated
Date; profit measure
Wayfair
Bootstrapped 9 years
None outside
Revenue bars
2002–2011
Chart units; growth mismatch
GitLab
Bootstrapped, profitable, team of 10
None outside
Team size only
Not stated
Revenue
iTrustCapital
Bootstrapped from inception
None outside
Clients, volume
As of 30 Sep 2021
Profit figure; chart axes
Prolific
Bootstrapped to monthly revenue
None outside
Blanked
Since 2019
Values hidden
Supernormal
Bootstrapped dataset
None outside
60,000 hours
Not stated
Period; cost
Ourobio
$400k bootstrapped
$400k incl. grants; $200k raised
Milestones
Not stated
Grants mixed in
Coram
Very capital efficient
Not stated
Not stated
Not stated
Any figure
Task Pigeon
Self funded, capital efficient
Not stated
Not stated
Not stated
Any figure
Key Takeaways
Capital efficiency is a ratio: show money in and the result, or name the ratio and its formula.
Burn multiple = net burn ÷ net new annual recurring revenue; say which version you use.
Rule of 40 = growth rate + profit margin; give both parts and the year.
"Bootstrapped" means funded by customers or founders; grants and prize money are a different source, so name them.
Give a period: "no outside capital from 2002 to 2011" says more than "bootstrapped".
A label on a list of reasons to invest isn't evidence; add the number behind it.
Write your capital-efficiency line
Fill in each line before putting "capital efficient" or "bootstrapped" on a slide.
Money in. Total raised to date, split by source: founders, customers, grants, angels, funds.
Result. Revenue, annual recurring revenue or another named outcome reached with that money.
Ratio. Burn multiple or Rule of 40, with the formula and both parts.
Period. Years without outside capital, or the year the ratio covers.
Why raise. What the new money does that customer revenue can't.
Copyable framework: $[revenue / ARR] reached on $[raised to date] ([sources]); burn multiple [x] ([formula], [year]).
Illustrative example 1 — written by us
Before: Very capital efficient
After: $[x] ARR on $[y] raised to date; burn multiple [z] in [year] (net burn ÷ net new ARR).
What improved: Our illustrative rewrite; not Coram's wording. Bracketed values are placeholders. It adds the money in, the result and a defined ratio.
What this guide adds
The profitability guide covers whether a company earns more than it spends, and over which period. The unit economics guide covers profit per customer. This page covers a related but different claim: how much money a company needed to reach where it is, and how to prove it on a slide.
Three ways to show capital efficiency
Money raised against the result: "$[x] raised to date; $[y] annual recurring revenue." Simple and hard to misread.
Burn multiple: net cash burned in a period divided by the net new annual recurring revenue added in the same period. Below 1 is generally read as efficient; above 2 as costly. Some companies use net loss in place of cash burn; say which.
Rule of 40: revenue growth rate plus profit (or free cash flow) margin. A score of 40% or more is the usual benchmark for software companies. Giving the two parts lets a reader see whether the score comes from growth or profit.
Grants, equity, commitments and an open balance
Non-dilutive money is not bootstrapping and not equity. If you have grants, report four things separately: what was awarded, what has actually been received, what conditions or repayment terms apply, and what equity is committed or still open. Adding these into one "raised" figure hides which money is in the bank.
Aviwell's slides below keep grants and equity on separate pages, which is the right start. Its grant total checks out; the equity figures around it describe different arrangements and should not be added to it or to each other.
How we read each slide
We quote figures as shown and use only visible numbers in calculations. Where a slide gives a ratio and one of its parts, we work out the other. We don't assume a funding history the slide doesn't state.
Common mistakes
Label without figures. Show money in and the result.
Undefined ratio. Say what is in the burn multiple or Rule of 40.
Grants called bootstrapping. Name non-dilutive funding separately.
No period. "Bootstrapped for 9 years" beats "bootstrapped".
Charts without units. Label axes so growth claims can be checked.
Claim first made on a summary slide. Prove it earlier, then repeat it.
Diagnostic checklist
Money raised to date shown, by source.
Result shown beside it (revenue, ARR or named outcome).
Any ratio named with its formula and year.
Bootstrapped period stated.
Grants and prizes named separately.
Charts carry units and axis values.
Frequently asked questions
How we chose these examples
Corpus: published pitch deck teardowns on StartupFundraising.com. Founder-uploaded private decks are excluded.
Selection (2026-09-25): we searched stored slide text on slides 2–8 for capital efficient, bootstrapped, burn multiple, self-funded and similar phrases, excluding disclaimer slides, fund and market-size slides and slides where "self-funded" referred to employers' health plans, kept only slides with a stored slide image, and inspected each image. Slides already used for the same lesson in the profitability guide (airSlate, Viewmarket, JibeHealth) were not repeated.
Figures are quoted as shown in the stored slide images. Calculations are ours and use only visible numbers. Where a slide doesn't label a figure's unit, related arithmetic is conditional.
Review: stored slide text and images were checked on 2026-09-25 and matched to company, deck and slide number (editorial model review). No person has yet completed an editorial review of this page. We make no claim that any slide caused a fundraising outcome.