Prolific’s Series A deck is a masterclass in demonstrating marketplace maturity and 'land and expand' dynamics. By 2023, the company had already achieved significant scale, boasting over 100,000 active verified participants and 30,000 researchers. The deck leans heavily on the quality of its data—positioned as 'empirically superior' to competitors like Amazon Mechanical Turk—and its impressive retention rates, including 100% retention among Ivy League and Russell Group institutions. While the core of the business was built on academic research, the narrative pivot to AI training and corporate…
Key takeaways
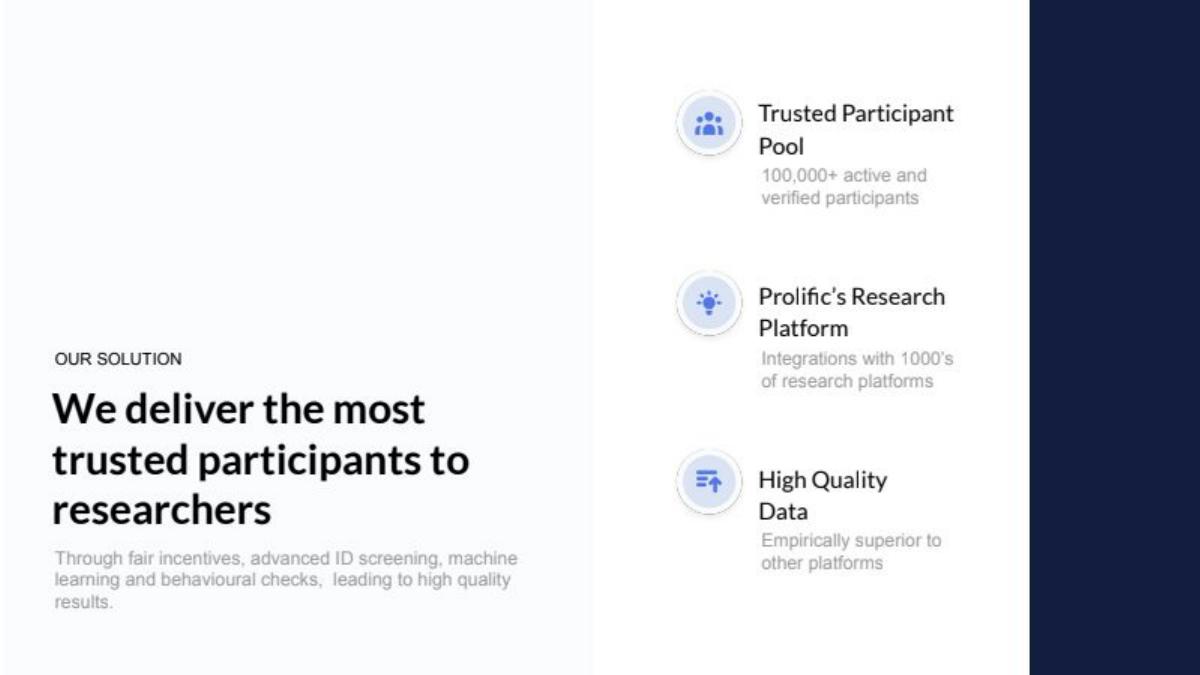
- The platform maintains a pool of 100,000+ active and verified participants (Slide 3).
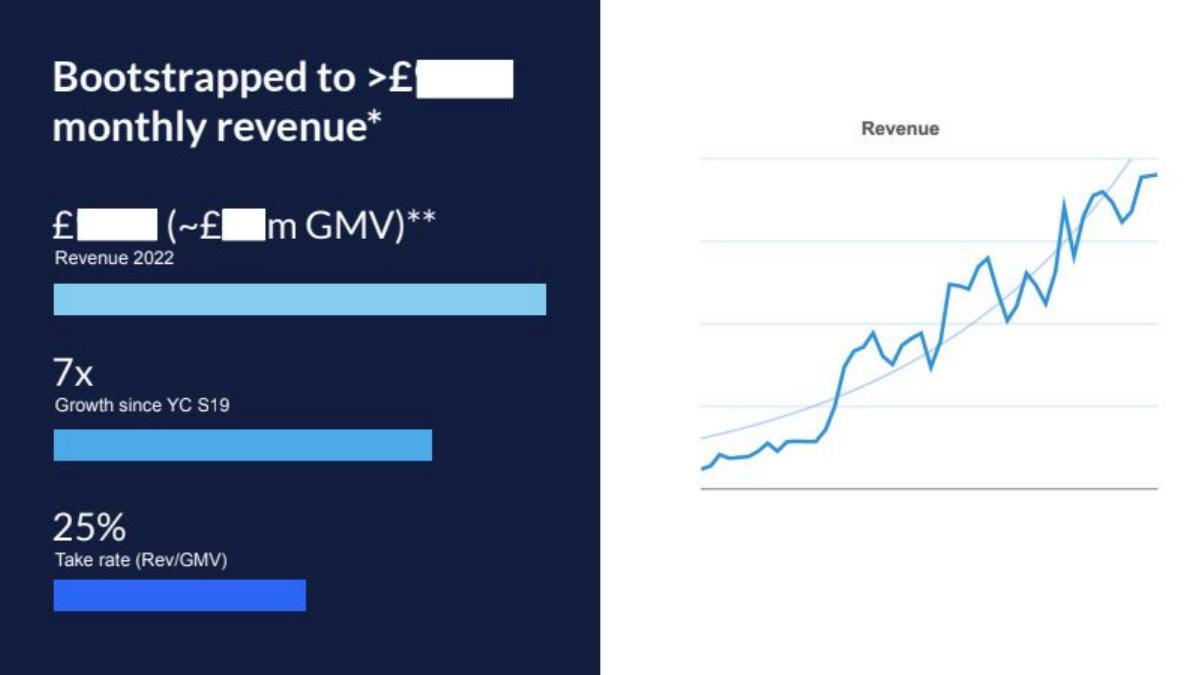
- Prolific operates on a 25% take rate, calculated as Revenue divided by GMV (Slide 4).
- The company achieved 7x growth between their YC S19 batch and the 2023 Series A raise (Slide 4).
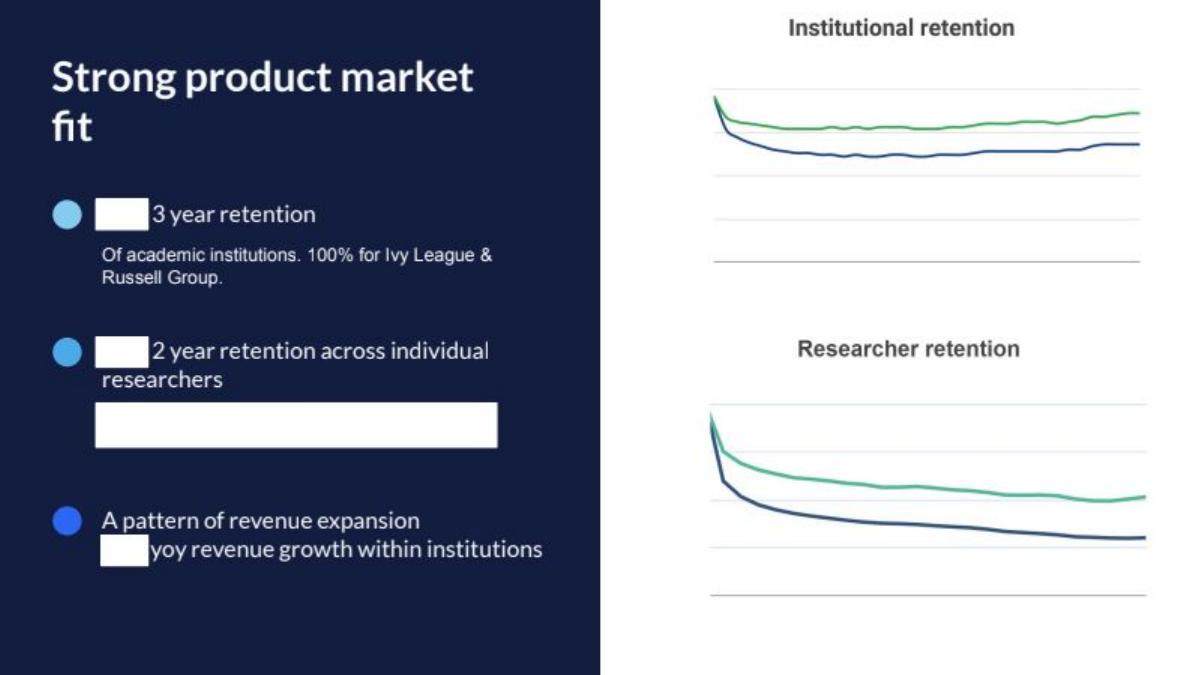
- Institutional retention is exceptionally high, cited at 100% for Ivy League and Russell Group universities (Slide 6).
- The marketplace has expanded beyond academia into billion-dollar markets like AI Training and User/Product testing (Slide 10).
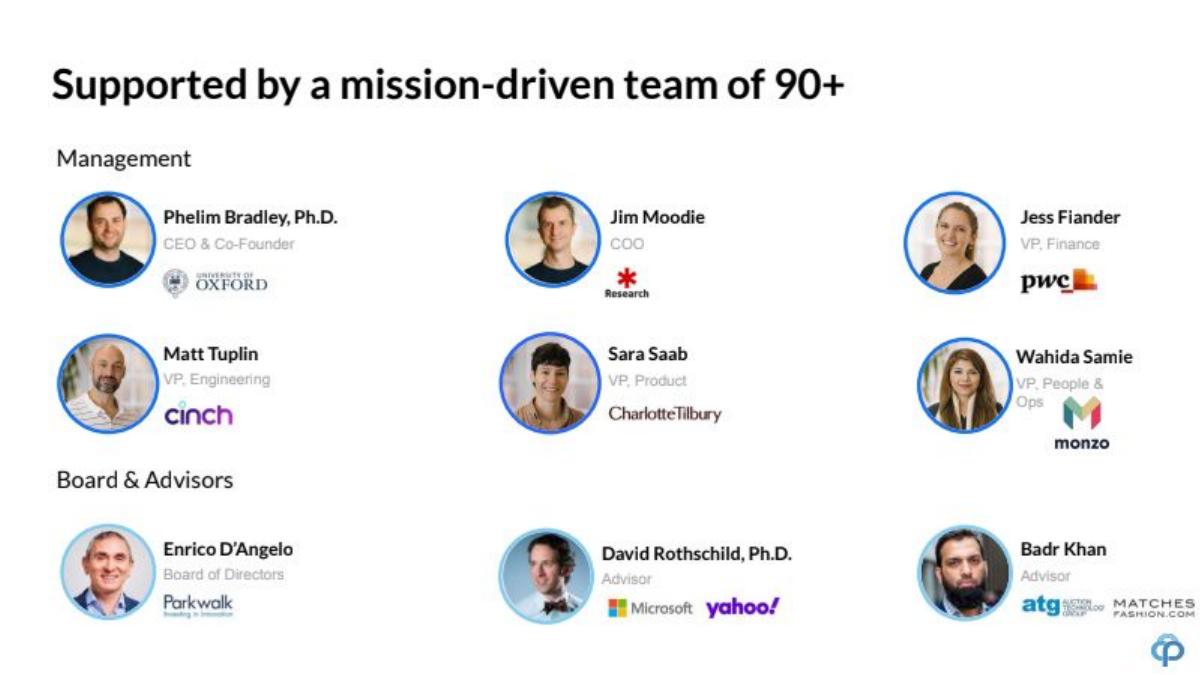
- The team is led by Phelim Bradley, Ph.D., an Oxford alumnus, emphasizing the company's deep roots in the research community (Slide 5).
- Competitive differentiation is built on 'High Data Quality' and 'Excellent Participant Experience,' contrasting directly with Amazon Mechanical Turk (Slide 7).
- The funding is earmarked for six key areas, including building a US presence and expanding participant diversity (Slide 11).
The Prolific Series A Teardown
Prolific’s 2023 Series A deck is a clinical example of how to present a mature marketplace. Having bootstrapped to significant revenue before their YC S19 stint and subsequent Series A, the company uses this deck to prove that their 'high-quality' niche is actually a massive, scalable platform. The narrative transition from 'academic tool' to 'AI infrastructure' is the most critical element of this presentation.
Slide 1: Title Slide
The deck opens with a simple, clean title slide. The tagline, 'We make it easy to run high quality research online,' is functional rather than aspirational. It establishes the core value proposition immediately: ease of use and quality. The branding is professional and understated, fitting for a company serving both Oxford researchers and Silicon Valley AI labs.
Slide 2: The Problem
Slide 2 identifies two primary pain points: 'Low participant experience' and 'Poor infrastructure and tools.' The deck argues that these issues lead directly to low-quality data. By framing the problem around 'quality,' Prolific sets the stage for why a premium marketplace is necessary in an era where cheap, bot-infested data is the norm.
Slide 3: Our Solution
The solution is presented as a three-pillar system: a 'Trusted Participant Pool' of 100,000+ verified users, a 'Research Platform' with 1,000s of integrations, and the resulting 'High Quality Data' which they claim is 'empirically superior to other platforms.' This is a classic marketplace 'three-sided' value prop: supply, tech, and output.
Slide 4: Traction and Revenue
This slide is a powerhouse of marketplace metrics. It highlights that the company was 'Bootstrapped to >£[Redacted] monthly revenue.' Key figures include a '25% Take rate (Rev/GMV)' and '7x Growth since YC S19.' The revenue chart on the right shows a consistent, upward trajectory with some volatility, which is typical for a usage-based marketplace. The mention of GMV (Gross Merchandise Value) is crucial here, as it shows the total economic activity Prolific facilitates.
Slide 5: The Team
The team slide emphasizes academic and operational pedigree. CEO Phelim Bradley, Ph.D. , is linked to the University of Oxford. The management team includes veterans from PwC, Monzo, and Charlotte Tilbury , while the advisors bring experience from Microsoft, Yahoo!, and various academic institutions. This blend of high-level corporate experience and deep academic roots supports their 'trusted' brand positioning.
Slide 6: Product Market Fit and Retention
Retention is the 'holy grail' of Series A decks. Prolific shows '100% [retention] for Ivy League & Russell Group' academic institutions. They also display two cohort charts: 'Institutional retention' and 'Researcher retention.' Both charts show the 'smile' or 'plateau' curve that investors look for, indicating that once a user or institution starts using Prolific, they rarely leave.
Slide 7: Competition/Differentiation
The competitive matrix is a direct shot at Amazon Mechanical Turk . Prolific claims a clean sweep of green checkmarks across 'High Data Quality,' 'Excellent Participant Experience,' 'Control/customisation,' 'Audience segmentation,' and 'Multipart/tracker studies.' Mechanical Turk is shown to fail in quality and experience, which are the two pillars Prolific built its brand on.
Slide 8: Institutional Trust
This slide is largely a placeholder for logos in the public version, but the headline is the metric: 'Trusted by 30,000+ researchers from world class institutions.' They segment their users into 'Academic,' 'Corporate,' and 'Other,' signaling the breadth of their reach.
Slide 9: Land and Expand
The 'Land and expand customer pattern' slide is a visual representation of account growth. It shows five different 'Top Institutions' and their revenue growth from CY2017A to CY2021A . In every case, the bars grow significantly over time, proving that Prolific doesn't just acquire customers; it grows deep roots within them.
Slide 10: The Second Growth Curve
This is arguably the most important slide for the Series A valuation. It identifies 'Rapid growth in non-academic verticals.' It specifically calls out 'AI Training' as a driver for corporate revenue. By positioning themselves as a source for AI training data, they move from a 'research tool' (smaller TAM) to 'AI infrastructure' (massive TAM). The 'Non Academic Revenue' chart shows an exponential growth curve that is much steeper than the overall revenue chart on Slide 4.
Slide 11: Future Growth and Use of Funds
The 'Ask' is broken down into six strategic buckets: Sales & Marketing, AI Research R&D, Enterprise expansion, Building a US presence, Deepening product moats, and Expanding participant diversity. This shows a balanced approach between scaling what works (Sales/US presence) and innovating for the future (AI R&D).
Slide 12: Closing
The deck ends as it began: clean, professional, and focused on the URL. No 'thank you' slide—just the brand and the website.
What Prolific Does Well
Metric Transparency: Even with redactions, the deck clearly defines its North Star metrics: Take Rate, GMV, and Cohort Retention. · Vertical Expansion: The 'Second Growth Curve' narrative is perfectly timed. It takes a proven, stable business (Academic Research) and attaches it to a high-growth trend (AI Training). · Retention Proof: Showing 100% retention among elite institutions (Ivy League) is a powerful signal of product quality and 'stickiness.'
What Is Missing
Unit Economics: While the 25% take rate is mentioned, there is no explicit mention of CAC (Customer Acquisition Cost) or LTV (Lifetime Value) ratios. · Participant Side Economics: The deck focuses heavily on the 'Researcher' (Buyer) side. It mentions 'fair incentives' for participants but doesn't detail the churn or acquisition costs for the 'Supply' side of the marketplace. · Detailed Financial Projections: As a Series A deck, it focuses on historical performance. While it mentions 'billion dollar markets,' it lacks a specific 3-5 year financial roadmap.
What Founders Should Copy
The 'Land and Expand' Visualization: Slide 9 is a perfect way to show that your product is viral within an organization. If you have accounts where spend grows every year, use this format. · Direct Competitive Comparison: Instead of a vague 'feature list,' Prolific picks the industry giant (Mechanical Turk) and attacks them on the specific weaknesses (Quality/Experience) that Prolific was built to solve. · Segmented Growth Charts: If your core business is steady but a new vertical is exploding, show them on separate charts. The 'Non Academic Revenue' chart on Slide 10 is much more exciting than the aggregate chart on Slide 4, and it's what gets VCs to pay a higher multiple.
Frequently asked questions
- What is Prolific's primary business model?
- Prolific operates as a B2B marketplace connecting researchers with vetted participants. They charge a 25% take rate on the Gross Merchandise Value (GMV) processed through the platform, as stated on Slide 4. This model scales with the volume of research conducted and the size of the participant incentives paid out.
- How does Prolific differentiate itself from Amazon Mechanical Turk?
- According to Slide 7, Prolific differentiates itself through high data quality, excellent participant experience, and superior audience segmentation. While Mechanical Turk offers control and multipart study capabilities, Prolific claims to solve the 'low quality data' problem inherent in older crowdsourcing platforms by using advanced ID screening and behavioral checks.
- What does the 'land and expand' strategy look like for this marketplace?
- Slide 9 illustrates a clear 'land and expand' pattern within top institutions. The bar charts show that once an institution is onboarded, total revenue from that account typically grows year-over-year from 2017 through 2021, suggesting that as more individual researchers within a university adopt the tool, the account value compounds.
- What is the 'second growth curve' mentioned in the deck?
- The 'second growth curve' refers to Prolific's expansion into non-academic verticals, specifically AI Training and corporate R&D. Slide 10 highlights that corporate revenue is being driven by the demand for high-quality human-in-the-loop data for machine learning, moving the company into much larger total addressable markets than academic research alone.
- Who are the key investors and how much was raised?
- Based on the catalogue facts, Prolific raised £25M in a Series A round in 2023. The round was led by venture capital firms Partech and Oxford Science Enterprises. The deck itself focuses on the team and advisors (Slide 5) but does not explicitly list the terms of the deal.