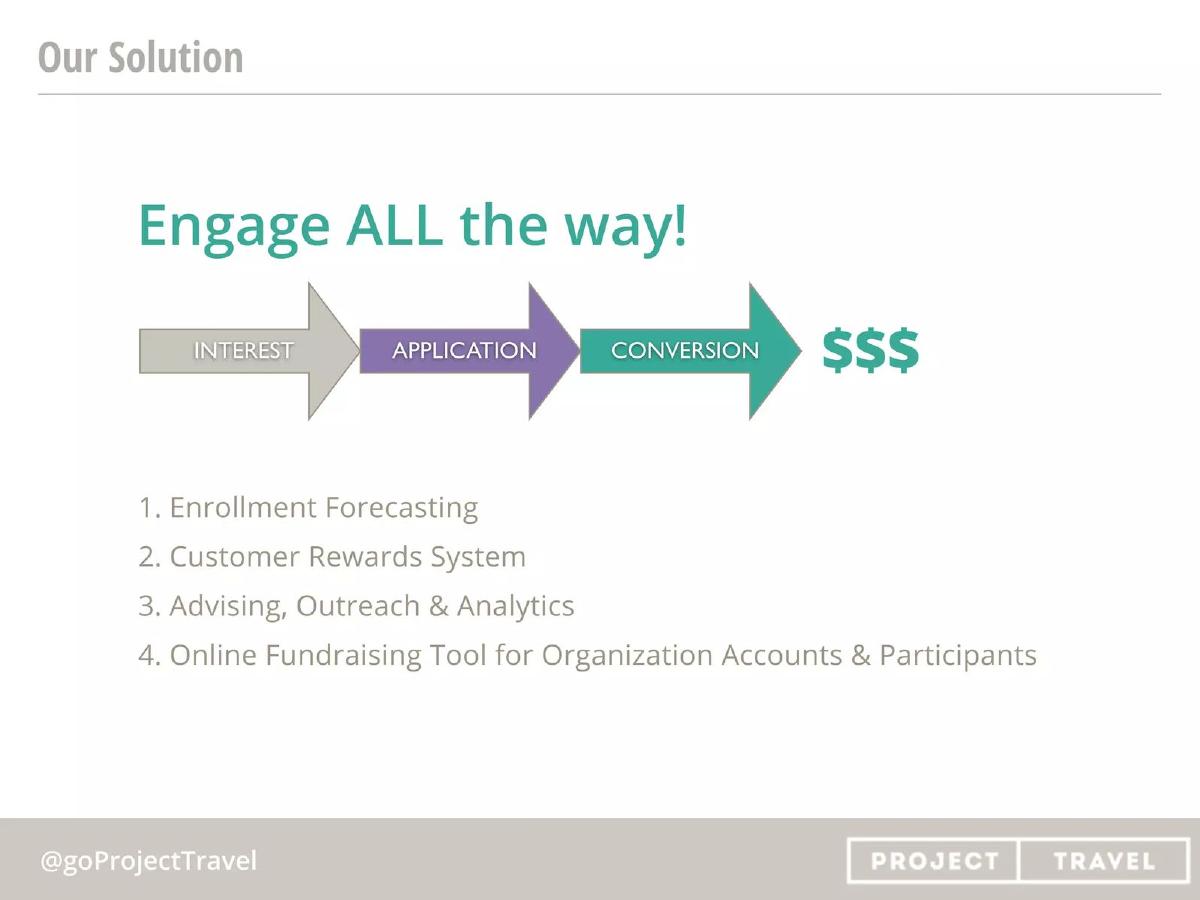
Project Travel’s 2014 deck presents a focused solution for youth travel organizations struggling with a 66% applicant-to-customer conversion failure rate. The company utilizes a hybrid business model, charging annual subscription fees ranging from $55 to $1,250 alongside a 5.5% transaction fee on supporter-side fundraising. With early traction including $30,000 in user transactions and pilots with Michigan State University, the deck makes a clear case for a niche EdTech/FinTech crossover. However, the financial projections are aggressively optimistic, forecasting a jump from near-zero to $125…
Key takeaways
- The market problem is defined by a specific 66% failure rate in converting youth travel applicants (Slide 3).
- The business model is dual-pronged: SaaS subscriptions for organizations and a 5.5% fee on fundraising transactions (Slide 5).
- Traction as of January 2014 included 650+ users and over $30,000 in processed transactions (Slide 4).
- The startup participated in the Coolhouse Labs accelerator, receiving an initial $25,000 investment for 6% equity (Slide 7).
- Financial projections show an extremely steep hockey-stick curve, aiming for $125,000,000 in revenue by 2018 (Slide 6).
- The seed round ask is $450,000 via a Convertible Promissory Note with a target close date of February 28, 2014 (Slide 7).
- The team includes founders with specific domain expertise in international education and finance (Slide 2).
- The deck omits a dedicated competition slide, failing to address other crowdfunding or travel management incumbents.
Executive Summary: A Niche Solution for the Study Abroad Gap
Project Travel’s investor deck from January 2014 represents a classic 'niche-to-mass' strategy. By focusing on the specific friction points of youth travel—namely the high drop-off rate of applicants who cannot secure funding—the company positioned itself as both a workflow tool for educators and a FinTech solution for students. The deck is concise, spanning 14 slides (7 provided for this teardown), and follows a logical progression from team expertise to market pain and financial exit potential.
Slide 1: Title and Social Proof
The cover slide establishes the brand identity with the tagline 'from here to there.' Notably, the bottom of the slide is crowded with logos from media and organizations like Technori, KillerStartups, Skift, and the Chicago Sun-Times. This is a deliberate move to establish immediate credibility and 'social proof' before the investor even sees a metric. It signals that the company has already been vetted by the Chicago tech ecosystem and travel industry press.
Slide 2: The Team
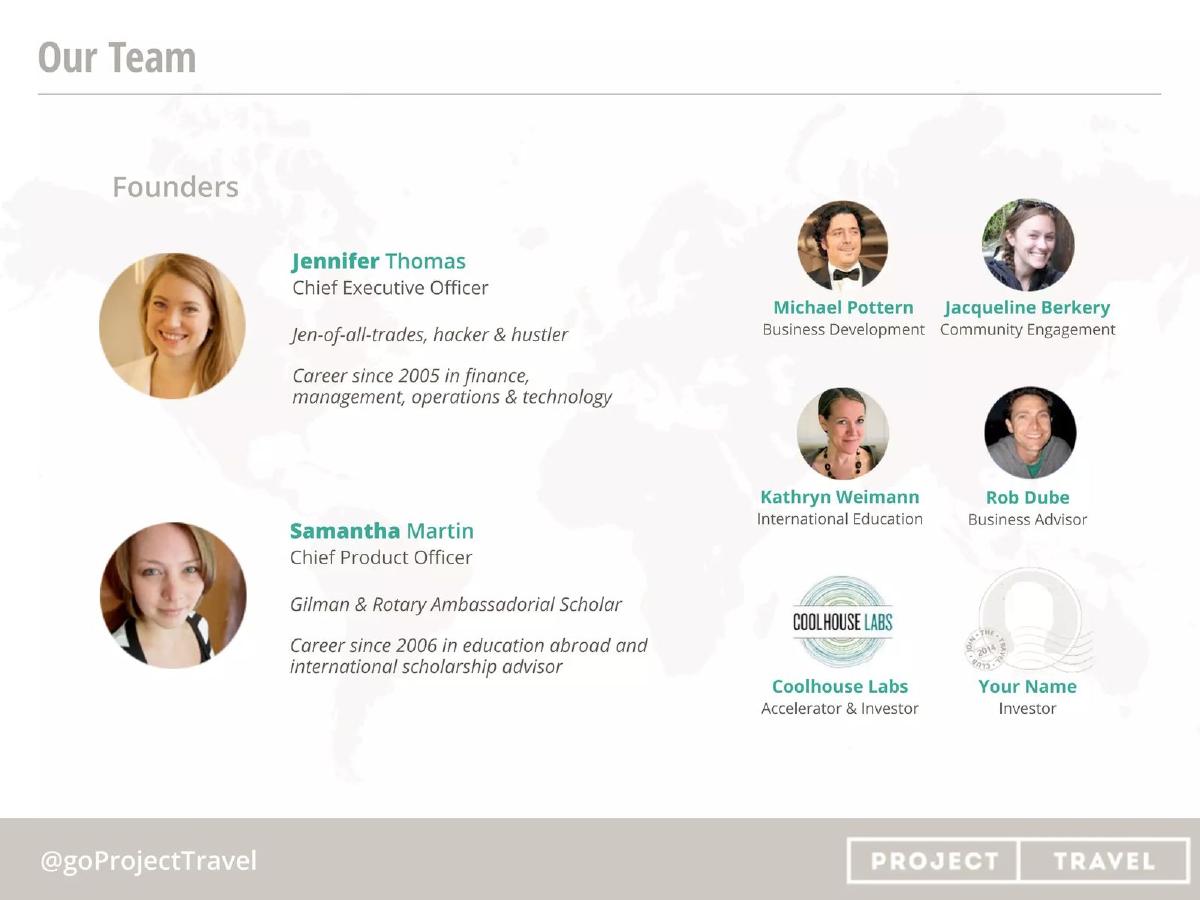
The 'Our Team' slide highlights two primary founders: Jennifer Thomas (CEO) and Samantha Martin (CPO). The descriptions emphasize a balance of 'hacker & hustler' skills with deep domain expertise. Martin’s background as a 'Rotary Ambassadorial Scholar' and scholarship advisor is particularly relevant, as it suggests the product was built by someone who intimately understands the bureaucratic and financial hurdles of international education. The inclusion of advisors like Rob Dube and the mention of Coolhouse Labs as an existing investor provides additional layers of institutional validation.
Slide 3: Market Problem
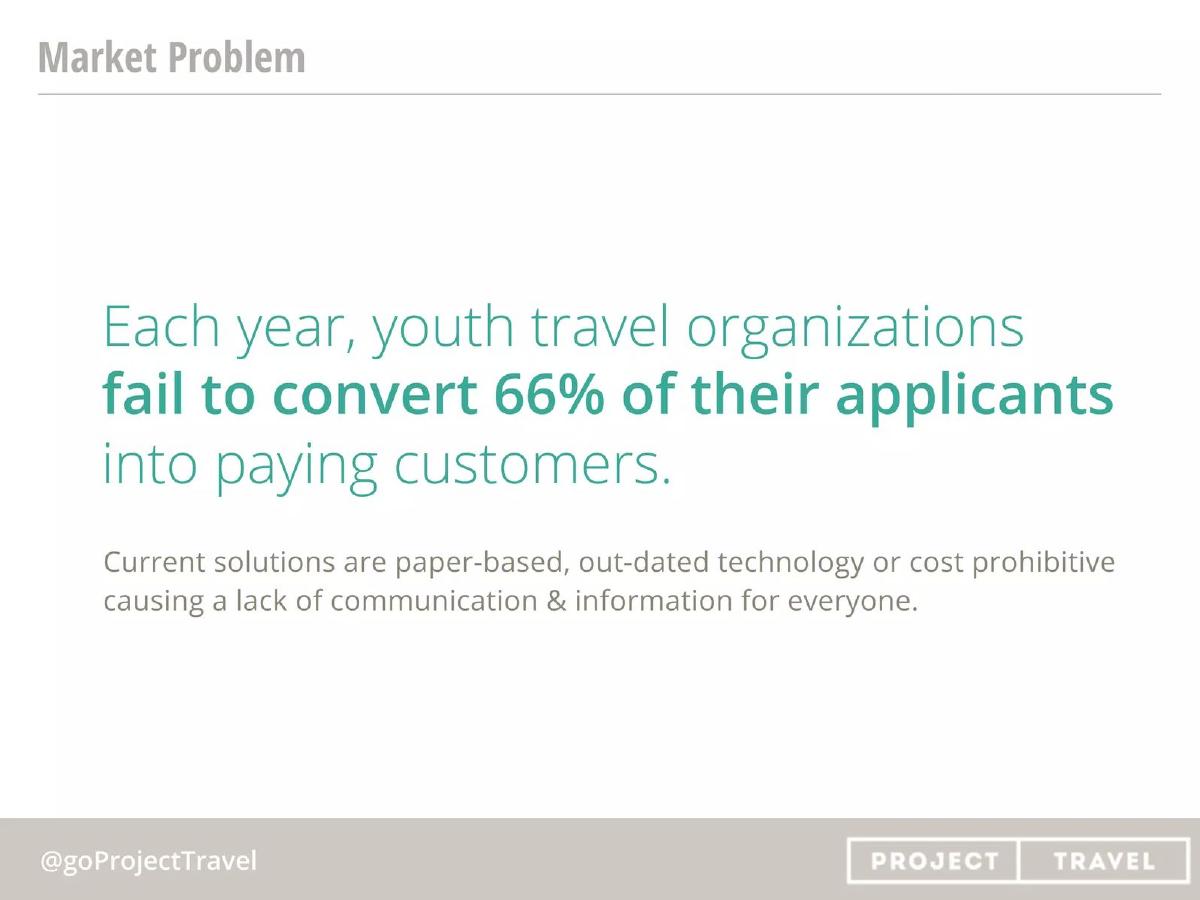
Project Travel identifies a very specific, quantifiable pain point: 'Each year, youth travel organizations fail to convert 66% of their applicants into paying customers.' By leading with a percentage rather than a vague statement about 'travel being hard,' the founders give investors a clear metric to track success against. The slide blames 'paper-based' and 'out-dated technology' for this failure, positioning Project Travel as the necessary digital transformation layer for the sector.
Slide 4: Traction & Awards
This slide provides a timeline of the company’s evolution from a May 2013 beta launch to January 2014. Key figures include 650+ users, a 34% activity rate, and $30,000+ in user transactions. Perhaps more important for a B2B2C model is the mention of 60+ organizations and pilots with Michigan State University and ACIS. These names carry weight in the educational travel space and suggest that the product has passed the 'institutional gatekeeper' test.
Slide 5: Business Model: Key Revenue Streams
The revenue model is transparent and diversified. It utilizes a SaaS component (subscriptions ranging from $55 to $1,250) and a transactional component (5.5% on fundraising). The slide uses a 'unit economics' visualization, showing what revenue looks like at a scale of 100 clients per tier. For example, 100 Enterprise clients are projected to generate $1.5M in revenue. This helps investors visualize the path to $1M+ ARR without needing to see a full spreadsheet.
Slide 6: Financial Projections
Slide 6 contains the most aggressive claims in the deck. The 5-year projection shows revenue growing from near-zero in 2014 to $125,000,000 by 2018. This is a classic 'hockey stick' graph. The slide also notes a shift from a US focus in years 1-3 to a global focus in years 3-5. While the target market capture percentages (e.g., 14% of global clients by 2018) provide some context, the jump from $25M in 2017 to $125M in 2018 is a massive leap that would likely require significant scrutiny during due diligence.
Slide 7: Our Ask
The final slide in this set is the 'Ask' slide, which is refreshingly detailed. It requests $450,000 via a Convertible Promissory Note. It lists a specific burn rate ($27K/month) and a clear runway (15 months to break even). The allocation of funds is also broken down: 63% for salaries, 23% for production, and 9% for sales. This level of granularity shows that the founders have a concrete operational plan for the capital, rather than just a vague desire to 'grow.'
What Project Travel Does Well
Specific Problem Identification: By citing the 66% non-conversion rate, the deck moves away from 'travel is fun' and toward 'travel organizations are losing money.' This is a much more compelling hook for an investor.
Domain Authority: The team slide effectively communicates that the founders aren't just tech enthusiasts; they are veterans of the international education and scholarship world. This reduces the perceived risk of building a product that doesn't fit the actual workflow of a university study abroad office.
Clear Revenue Tiers: The business model slide is exceptionally easy to read. It clearly distinguishes between the software fee (paid by the org) and the transaction fee (paid by the supporters), showing a sophisticated understanding of how to monetize both sides of their marketplace.
What is Missing from the Deck
Competitive Landscape: There is no slide addressing competitors. In 2014, platforms like GoFundMe or specialized study abroad management software existed. Failing to acknowledge them leaves a gap in the narrative regarding how Project Travel wins against incumbents or generalist crowdfunding sites.
Product Walkthrough: While the problem and business model are clear, the actual user experience is left to the imagination. A few screenshots showing how a student sets up a page or how an administrator tracks an applicant would have grounded the 'outdated technology' argument in reality.
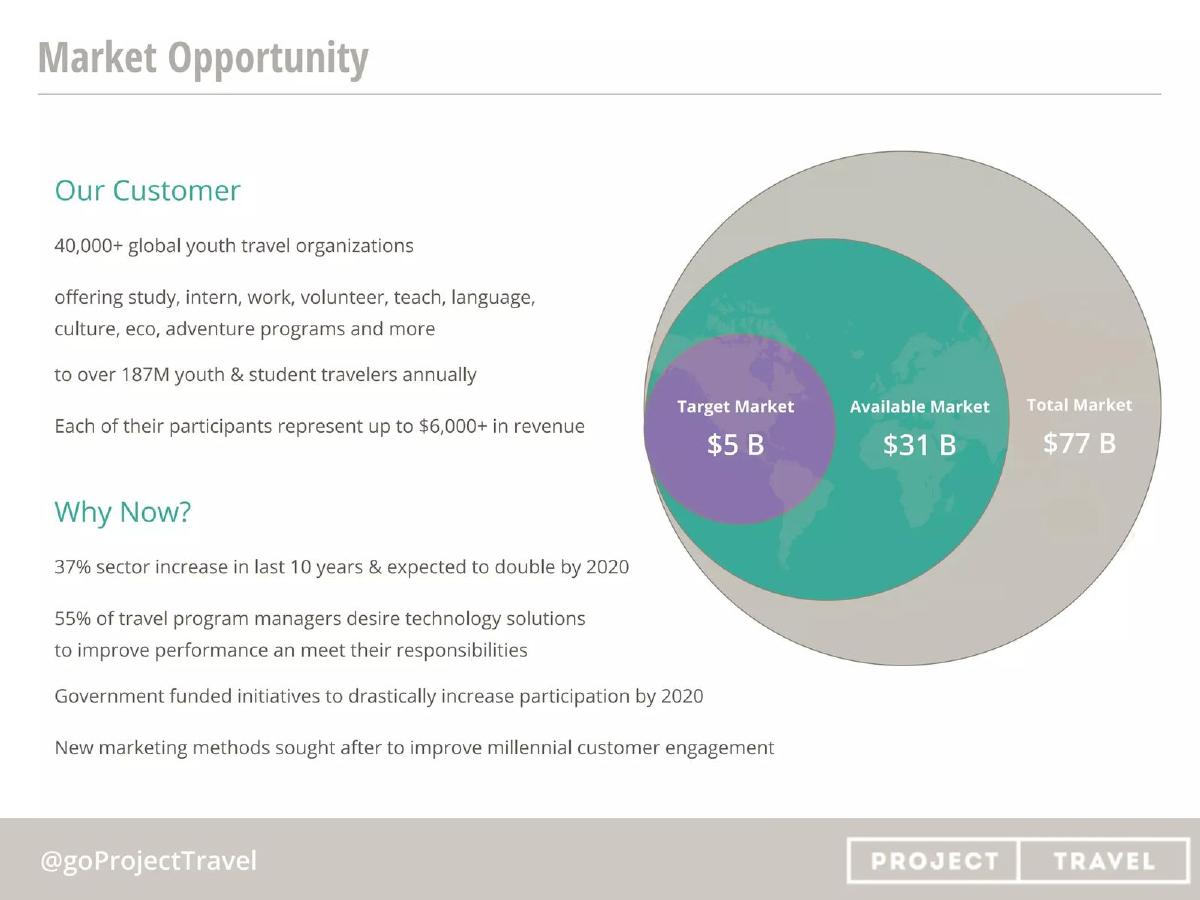
Market Size (TAM/SAM/SOM): While the projections mention market capture percentages, the deck lacks a traditional 'Total Addressable Market' slide. Investors need to know if the 100% of the youth travel market is a $1B opportunity or a $100B opportunity to justify the $125M revenue projection.
Lessons for Founders
Quantify the Pain: If you can find a single statistic that represents the inefficiency in your target industry (like the 66% conversion failure), make it the centerpiece of your problem slide. · Be Specific with the Ask: Don't just ask for money. State the instrument (Convertible Note), the burn rate, and the specific runway. It shows you are a disciplined manager of capital. · Bridge the Gap: Project Travel successfully bridged the gap between a 'social good' (helping students travel) and a 'hard business' (SaaS and transaction fees). Founders in the EdTech or social impact space should copy this approach to avoid being labeled as a 'lifestyle' business.
Frequently asked questions
- What is the primary problem Project Travel aims to solve?
- According to Slide 3, youth travel organizations fail to convert 66% of their applicants into paying customers. The deck attributes this to paper-based processes, outdated technology, and cost-prohibitive solutions that lead to poor communication and information gaps between the organization and the traveler.
- How does Project Travel generate revenue?
- Slide 5 outlines two streams: a monthly subscription fee billed annually and a supporter-side transaction fee. Subscriptions are tiered at $55 (Professional), $125 (International Educator), and $1,250 (Enterprise). Additionally, they take a 5.5% cut of online fundraising transactions from individuals and groups.
- What were the company's key traction metrics at the time of the pitch?
- As of January 2014, Slide 4 reports 650+ users with a 34% activity rate. They had processed over $30,000 in user transactions and were working with 60+ organizations, including pilot projects with Michigan State University and ACIS.
- What are the terms of the investment being sought?
- Slide 7 specifies a seed round of up to $450,000 delivered via a Convertible Promissory Note. The company set a target close date of February 28, 2014, and noted a monthly burn rate of $27,000 with a 15-month runway to break even.
- Who are the founders and what is their background?
- Slide 2 introduces Jennifer Thomas (CEO), described as a 'hacker & hustler' with a career in finance and technology since 2005, and Samantha Martin (CPO), a former Gilman & Rotary Ambassadorial Scholar with a background in education abroad and scholarship advising since 2006.