Wayfair’s 2015 investor presentation serves as a post-IPO roadmap for scaling a massive e-commerce platform. The deck highlights the company's evolution from CSN Stores—a collection of 240+ niche websites—into a consolidated brand family including Joss & Main and AllModern. Key to their narrative is 'capital efficiency,' evidenced by a negative cash conversion cycle where days payable (36.0) vastly exceed days receivable (1.4). Despite reporting net losses, the deck emphasizes high growth (81% YoY in direct retail) and a flywheel driven by repeat orders, which reached 57% of total orders by Q…
Key takeaways
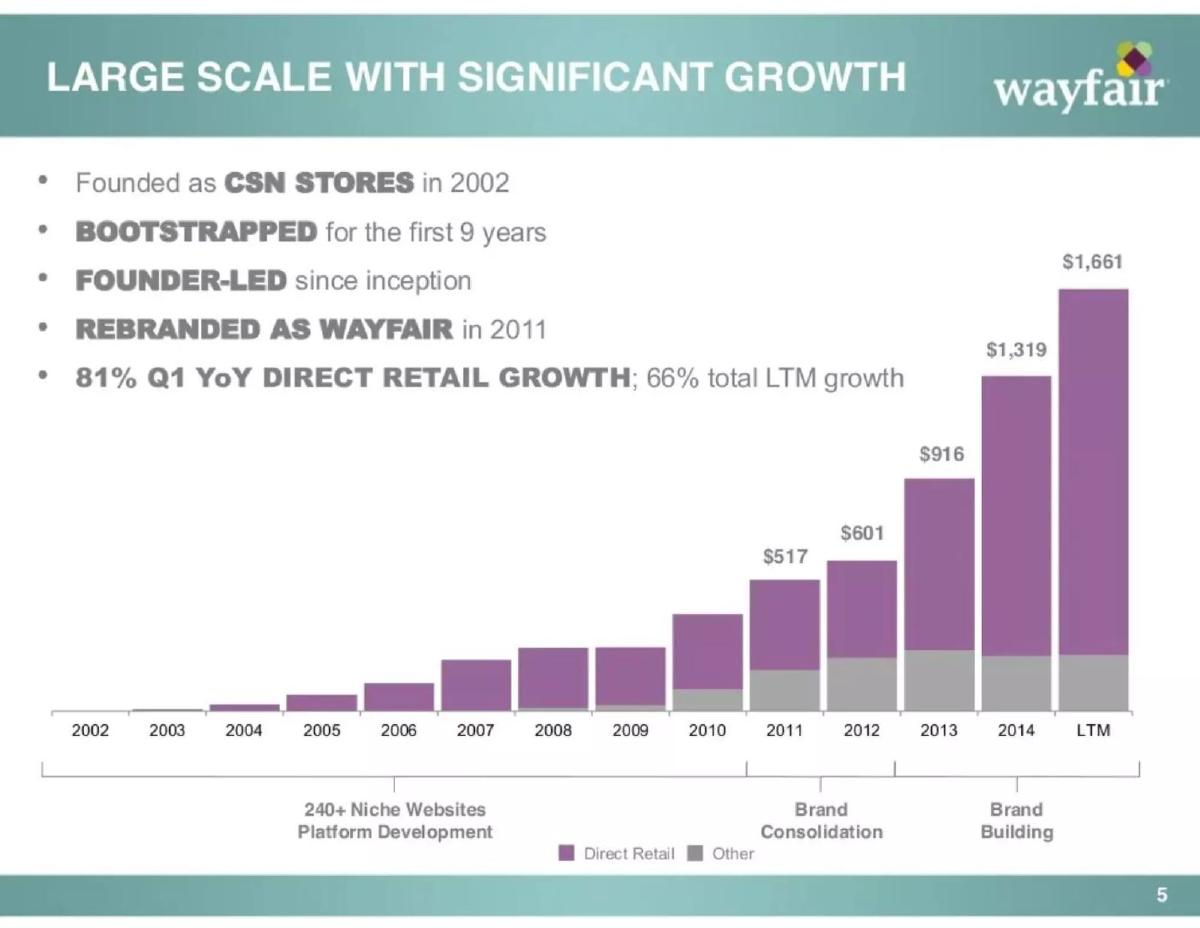
- The company transitioned from 240+ niche websites to a consolidated brand strategy starting in 2011 (Slide 5).
- Wayfair achieved 81% Q1 YoY direct retail growth and reached $1.66 billion in LTM revenue by 2015 (Slide 5).
- The business model is highly capital efficient, maintaining only $21M in inventory against $1.66B in revenue (Slide 21).
- Repeat orders are a primary growth driver, increasing from 52% to 57% of total orders between Q2 2014 and Q2 2015 (Slide 17).
- The deck identifies a massive market opportunity, noting that online penetration in home goods was only 7% in 2013 compared to 54% in consumer electronics (Slide 7).
- Wayfair differentiates itself from search-based competitors by focusing on a visual, discovery-led shopping experience (Slide 11).
- The technical infrastructure is supported by a team of over 350 engineers and data scientists (Slide 13).
- Financials show a reconciliation of adjusted EBITDA, noting a net loss of $148.098M in 2014 (Slide 25).
Introduction
The Wayfair Investor Presentation from August 2015 is a significant document in the history of e-commerce. It captures a company that had already achieved massive scale—exceeding $1.3 billion in sales in 2014—but was still in the process of educating the market on why a specialized home goods platform could outperform generalist retailers like Amazon. The deck is structured to move the investor from the broad market opportunity to the specific operational advantages of the Wayfair model.
The Brand Family and Mission
Slide 1: Title Slide The presentation opens with a clear display of the Wayfair brand portfolio. Beyond the flagship wayfair.com, it highlights Joss & Main, AllModern, DwellStudio, and Birch Lane. This immediately signals that Wayfair is a multi-segment player catering to different aesthetics and price points.
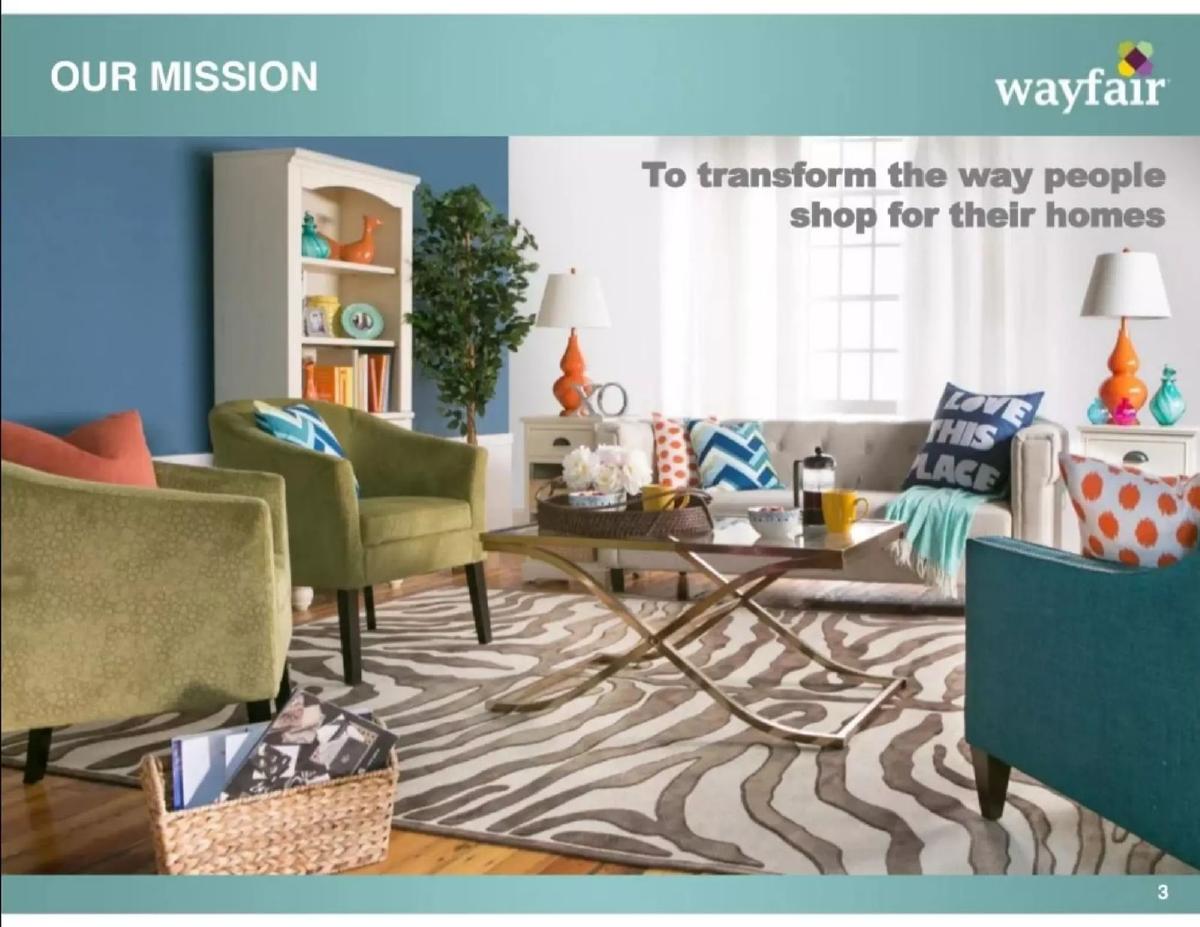
Slide 3: Our Mission The mission is stated simply: "To transform the way people shop for their homes." The slide uses a high-quality lifestyle image of a furnished living room, reinforcing that the company is about the end-to-end aesthetic experience, not just individual SKUs.
The Growth Narrative
Slide 5: Large Scale with Significant Growth This is one of the most important slides in the deck. It outlines the company's history: founded as CSN Stores in 2002, bootstrapped for nine years, and rebranded in 2011. The bar chart shows a dramatic revenue climb from near-zero in 2002 to $1.661 billion in the Last Twelve Months (LTM). Crucially, it breaks down revenue between "Direct Retail" and "Other," showing that the vast majority of growth is coming from their core retail brands. They report 81% Q1 YoY direct retail growth.
Slide 7: Large, Highly Fragmented Market Moving Online Wayfair argues that the U.S. home goods market is a $233 billion opportunity (as of 2013) projected to grow to $297 billion by 2023. The core of the thesis is online penetration. While consumer electronics were 54% online in 2013, home goods were only at 7%. Wayfair positions itself to capture the shift as that 7% moves toward 15-30%.
Product Differentiation and User Experience
Slide 9: Home Shoppers Desire Uniqueness This slide addresses the psychological difference between buying a commodity and buying furniture. They contrast 12 different styles of beds ("We do not all sleep in the same style bed") with four nearly identical LCD TVs ("...but a lot of us own the same TV and view it as reassuring"). This justifies why a specialized, discovery-based platform is necessary for furniture, whereas a search-based platform works for electronics.
Slide 11: Home is Shopped Visually Following the previous logic, Slide 11 compares a "Search Based Site" (which looks like a standard Amazon-style grid) with the Wayfair interface. Wayfair’s site is shown as a curated, lifestyle-oriented experience. They argue that home goods require a visual discovery process rather than a simple text search.
The Operational Engine
Slide 13: Custom-Built Technology and Operational Platform Wayfair highlights its moats here. On the technology side, they cite 350+ engineers and data scientists working on a proprietary, mobile-optimized platform. On the operational side, they highlight over 20 million orders since inception and a 2014 North America average time to ship of 2.2 days. They specifically mention a "minimal inventory and capex" model.
Slide 15: Increasing Personalization Drives Growth This slide provides concrete examples of their marketing automation. They claim the ability to send over 1 million variations of emails. The visual examples show how they segment users by interest—holiday hosting, kids' furniture, or pet products—to drive repeat purchases.
The Flywheel and Financial Efficiency
Slide 17: Scale Drives Powerful Network Effects The "Wayfair Flywheel" is centered on brand awareness. More customers lead to more repeat purchases (which grew from 52% to 57% YoY), which fuels revenue, enabling strategic investment in technology and operations. This cycle is backed by a 54% increase in active customers (reaching 4.044 million) and a 47% increase in advertising spend.
Slide 19: Growing Awareness Using Google Trends data, Wayfair shows the explosion in brand interest since the 2011 rebrand. They cite a 62% aided brand awareness as of April 2014, supported by national TV campaigns and partnerships with networks like HGTV.
Slide 21: Capital Efficient with Minimal Inventory This is the financial "hook." Wayfair demonstrates that they don't need to own the goods they sell. With $1.661 billion in revenue, they held only $21 million in inventory. Furthermore, they show a massive gap between "Days Receivable" (1.4) and "Days Payable" (36.0). This means they get paid by customers almost instantly but pay suppliers over a month later, creating a negative working capital cycle that generates cash as they grow.
Strategy and Financial Reconciliation
Slide 23: Well Defined Growth Strategy The strategy is split into two tiers. First, continuing to build the core brands through customer acquisition and supplier additions. Second, "Additional Growth Strategies" including international expansion and strategic acquisitions.
Slide 25: Reconciliation of Adjusted EBITDA The final slide in this set provides the raw numbers. It shows a deepening net loss from $15.5 million in 2013 to $148.1 million in 2014. However, by adding back depreciation, amortization, and equity-based compensation ($63.2 million in 2014), they arrive at an Adjusted EBITDA loss. For Q2 2015, the Adjusted EBITDA loss was narrowed to $4.972 million.
What Works in This Deck
The Inventory Narrative: For an e-commerce company, the "minimal inventory" slide (Slide 21) is the most compelling argument for the business's scalability. It proves that Wayfair is a technology platform, not a warehouse operator. · Psychological Segmentation: Slide 9 (Beds vs. TVs) is a brilliant way to explain why Amazon hadn't yet won the furniture category. It frames the problem as a matter of consumer psychology rather than just logistics. · Transparency on Losses: By including the full reconciliation on Slide 25, the company doesn't hide its lack of profitability. Instead, it shows that much of the loss is driven by non-cash charges like equity-based compensation.
What is Missing
Unit Economics: While the deck mentions repeat orders and revenue growth, it lacks a specific breakdown of Customer Acquisition Cost (CAC) vs. Lifetime Value (LTV). For a company spending $224 million on advertising (Slide 17), these metrics are critical. · Competitive Landscape: The deck assumes the reader knows the competition. There is no direct comparison to players like IKEA, Williams-Sonoma, or Amazon, other than the subtle jab at "search-based sites." · International Performance: Slide 23 mentions international expansion as a strategy, but the deck provides almost no data on how the existing international offices (Ireland, UK, Germany) are performing.
What a Founder Should Copy
The Flywheel Visualization: Slide 17 is a perfect example of how to show that your business gets easier to run as it gets bigger. Every founder should be able to articulate their version of this cycle. · The "Why Now" Slide: Slide 7 uses market penetration data to create a sense of urgency. Showing that your category is significantly behind other categories in online adoption is a powerful way to signal a "land grab" opportunity. · Visual Proof of Personalization: Instead of just saying "we use AI for emails," Slide 15 shows the actual emails. This makes a technical claim feel tangible and proven.
Frequently asked questions
- How does Wayfair handle inventory differently than traditional retailers?
- According to Slide 21, Wayfair operates with a 'minimal inventory' model. In the LTM period shown, they generated $1.661 billion in revenue while holding only $21 million in inventory. This is achieved through an extensive supplier integration and direct fulfillment network, allowing them to act as a platform rather than a traditional stock-holding warehouse.
- What was Wayfair's original name and strategy?
- Slide 5 reveals that the company was founded as CSN Stores in 2002. For the first nine years, it was bootstrapped and operated as a collection of 240+ niche websites. It wasn't until 2011 that they rebranded as Wayfair and began the process of brand consolidation.
- What is the 'Flywheel' effect mentioned in the deck?
- Slide 17 illustrates a 'Network Effects' flywheel. Increased brand awareness and strategic investment lead to more customers and more repeat purchases. This fuels more revenue, which is then reinvested into merchandising, technology, and operations, further enabling the cycle of customer acquisition and retention.
- Is Wayfair profitable according to this 2015 presentation?
- No. Slide 25 shows that Wayfair was operating at a net loss. In 2014, the net loss was $148.098 million, and in Q2 2015, it was $19.334 million. The deck uses an 'Adjusted EBITDA' metric to show a smaller loss of $4.972 million for Q2 2015, highlighting that free cash flow performance is consistently better than EBITDA.
- How does Wayfair use personalization in its marketing?
- Slide 15 demonstrates their ability to send over 1 million variations of emails. These are highly visual and category-specific, such as 'Holiday furniture for every room' or 'Playroom furniture and toys.' This personalization is cited as a key driver for repeat behavior and growth.