T&J Designs presents a lean, visually-driven 11-slide deck that prioritizes traction and brand identity over dense financial modeling. Operating in the $360 billion fashion apparel market, the company showcases a robust $750k run rate and an impressive 70% gross margin. The core of their competitive advantage lies in a 30-day design-to-customer cycle and a social media engine generating 1.5 million monthly impressions. By combining high-margin e-commerce with established wholesale channels like Nordstrom Rack and 300 boutiques, the founders present a de-risked growth path. While the deck lack…
Key takeaways
- The company reports a $750k revenue run rate and a high 70% gross margin on slide 3.
- Social media is a primary driver of growth, accounting for 60% of total traffic as stated on slide 6.
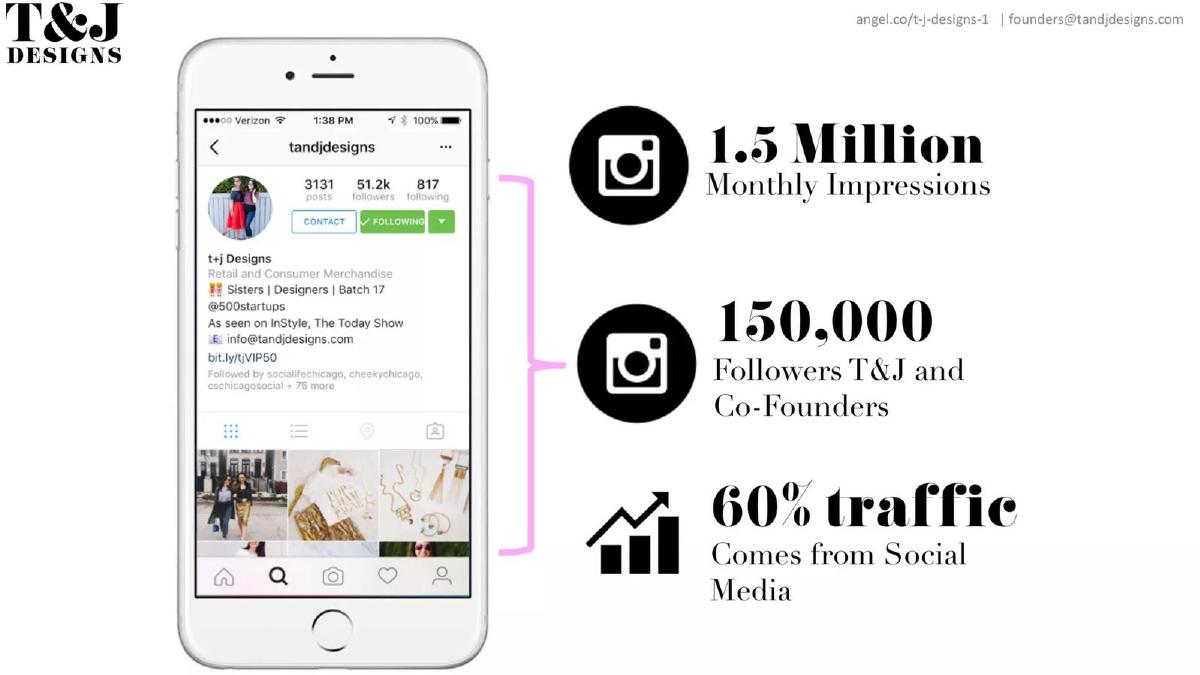
- The brand maintains a significant digital presence with 1.5 million monthly impressions and 150,000 combined followers on slide 6.
- A rapid 30-day production cycle from design to customer is highlighted as a key operational efficiency on slide 8.
- The business model includes a diversified revenue stream featuring Nordstrom Rack, Poshmark, and 300 wholesale boutiques on slide 10.
- Paid acquisition is highly efficient, yielding a 3x-5x ROI on Facebook ads within a single week according to slide 4.
- The founders leverage previous experience at high-profile companies including Nordstrom, Tommy Hilfiger, and Microsoft as shown on slide 5.
- The deck targets a massive $360 billion fashion apparel and jewelry market with a focus on 40+ million millennials on slide 9.
The Visual-First Strategy of T&J Designs
The T&J Designs pitch deck is a quintessential example of 'show, don't tell.' In an industry as aesthetic-dependent as fashion, the founders opted for a deck that functions almost like a lookbook, using high-quality photography to establish brand identity while overlaying heavy-hitting financial metrics. This 11-slide deck, used during their 2016 pre-seed round, manages to communicate a sophisticated business model with very little text.
Slide 1: Title and Brand Identity
The deck opens with a clean, minimalist title slide. The logo, 'T&J DESIGNS,' uses a bold serif typeface that evokes traditional luxury fashion branding. Below it, the tagline 'The Brand to Wear and Share' appears in pink. This tagline is critical as it immediately signals the company's reliance on social virality and community—a theme that is validated later in the deck's traffic metrics.
Slide 2: Product Showcase (The Lookbook)
Slide 2 contains no text. It is a collage of five high-energy lifestyle images. These photos depict the product in 'real-world' aspirational settings: jumping on a bed, posing in trendy outerwear, and lounging by a pool. By leading with the product, the founders are forcing the investor to first buy into the aesthetic before they are asked to buy into the numbers. It establishes the 'millennial' target demographic through visual cues rather than data points.
Slide 3: The Hook - Traction and Margins
This is arguably the most important slide in the deck. T&J Designs moves immediately from 'vibe' to 'value.' Against a faded background of their models, three large circles display their core KPIs: a $750k Run Rate , a 70% Gross Margin , and an $86 AOV (Average Order Value). For a pre-seed company in 2016, these are exceptional numbers. A 70% gross margin in apparel suggests a very efficient supply chain and strong pricing power, while the $86 AOV indicates that customers are buying multiple items or high-ticket pieces per transaction.
Slide 4: Customer Acquisition Efficiency
Slide 4 focuses on the scalability of their marketing. It features the Facebook logo and a bold claim: 3x-5x ROI Within a week . This slide addresses a common investor fear in e-commerce: that growth is only possible through unsustainable ad spend. By showing a high return on investment (ROI) within a very short window (one week), they demonstrate that their customer acquisition cost (CAC) is likely well below the lifetime value (LTV) of the customer, and that the feedback loop for testing new creative is incredibly fast.
Slide 5: The Team
The team slide introduces the founders, Jen (CEO) and Tiff (COO). Rather than using standard headshots, they are pictured in their own designs, further reinforcing the brand. The bottom of the slide features a 'logo bar' of previous experience: KPMG, Gymboree, Janie and Jack, Tommy Hilfiger, Microsoft, and Nordstrom . This is a powerful slide because it shows the founders have 'big retail' experience (Nordstrom, Tommy Hilfiger) combined with 'big corporate' discipline (KPMG, Microsoft). It suggests they understand both the artistry of fashion and the rigors of scaling a business.
Slide 6: Social Media Dominance
Slide 6 quantifies the 'Share' part of their tagline. Using an iPhone mockup of their Instagram profile, they list three key stats: 1.5 Million Monthly Impressions , 150,000 Followers (combined company and founders), and the fact that 60% of traffic comes from Social Media . This last stat is vital; it proves that their growth is organic and community-driven, which protects their margins from being eroded by rising paid acquisition costs.
Slide 7: Cultural Relevance and Virality
This slide connects their products to broader social trends. It shows products paired with popular hashtags: #lemonade (2,192,230 posts) and #champagne (6,191,155 posts), alongside a middle metric of 20,802 Likes on a specific post. This demonstrates that T&J Designs isn't just selling clothes; they are creating 'content-ready' apparel that fits perfectly into the existing social media habits of their target audience.
Slide 8: The 30-Day Cycle
In fashion, speed is a moat. Slide 8 uses simple icons to illustrate their 30 Day Cycle from Design to Production to Product to Customer. Traditional fashion houses often operate on 6-12 month cycles. By compressing this to 30 days, T&J Designs can react to 'micro-trends' on social media, produce inventory, and sell it while the trend is still peaking. This minimizes the risk of 'dead stock' and maximizes inventory turnover.
Slide 9: Market Opportunity
Slide 9 defines the Total Addressable Market (TAM). They cite a $360 Billion Fashion Apparel and Jewelry Market and a target of 40+ Million Millennials . While these are broad top-down numbers, the previous slides have already shown that the company has a specific 'wedge' into this market through social media and fast production.
Slide 10: Distribution and Partnerships
To prove they aren't just a small 'Instagram brand,' slide 10 highlights their wholesale and partnership success. They feature three shopping bags representing Nordstrom Rack , Poshmark , and Wholesale (300 Boutiques) . This omni-channel presence is a major de-risking factor; it shows that professional buyers at Nordstrom and 300 independent boutiques have vetted the product and found it worthy of shelf space.
Slide 11: The Conclusion (Traction Reiteration)
The final slide repeats the core metrics from slide 3: $750k Run Rate , 70% Gross Margin , and $86 AOV . It includes the contact email (founders@tandjdesigns.com). Repeating these numbers ensures that the last thing an investor sees is the company's financial strength. However, this slide serves as a placeholder for an 'Ask' that is conspicuously missing from the visual deck.
What T&J Designs Does Well
The strength of this deck is its density of traction . By slide 3, the investor already knows the company is making money, has high margins, and has a healthy average order value. The deck does not waste time on 'the problem' in a traditional sense; it assumes the problem (expensive or slow fashion) is understood and moves immediately to the proof of the solution.
The founder-market fit is also exceptionally well-communicated. By showing the founders in the clothes and listing their high-level retail experience, the deck builds immediate trust that the team can handle the complexities of manufacturing and distribution.
What is Missing from the Deck
The most glaring omission is the Funding Ask . There is no mention of how much money is being raised, what the valuation is, or what the 'milestones' for the next 18 months look like. While this information is often shared in a follow-up email or a verbal pitch, including a 'Use of Funds' slide is standard practice to show that the founders have a plan for the capital.
Additionally, there is no Competitive Landscape slide. In the crowded 'Fast Fashion' or 'D2C Apparel' space, investors want to know how T&J Designs stacks up against players like Revolve, ASOS, or even smaller boutique competitors. The deck relies entirely on its own internal metrics to prove its worth, without acknowledging the external market pressures.
What Other Founders Should Copy
Founders in the consumer space should emulate T&J Designs' use of Visual Social Proof . Slide 6 and Slide 7 don't just say they are 'good at social media'; they show the actual interface, the impression counts, and how their products integrate with trending hashtags. This makes the 'moat' feel tangible.
Furthermore, the Metric Overlay technique used on slides 3 and 11 is highly effective. By placing bold, black text over high-quality brand imagery, they maintain the 'premium' feel of the brand while delivering the 'hard' data that investors require. It prevents the deck from feeling like a dry financial report or a shallow marketing brochure.
Frequently asked questions
- What is T&J Designs' primary competitive advantage?
- Their primary advantage is operational speed combined with social influence. Slide 8 details a 30-day cycle from design to customer, allowing them to capitalize on trends faster than traditional retail. This is bolstered by a massive social media reach (1.5M monthly impressions) that drives 60% of their traffic, creating a low-cost customer acquisition engine.
- How healthy are the company's unit economics?
- The economics appear very strong for a pre-seed stage company. Slide 3 and Slide 11 both highlight a 70% gross margin and an Average Order Value (AOV) of $86. When paired with the 3x-5x ROI on Facebook advertising mentioned on slide 4, the business demonstrates a highly profitable and scalable contribution margin.
- What is the company's distribution strategy?
- T&J Designs uses an omni-channel approach. While they are primarily an e-commerce B2C brand, slide 10 reveals significant B2B partnerships. They sell through Nordstrom Rack, utilize Poshmark as a secondary channel, and have a wholesale presence in over 300 independent boutiques, providing both brand authority and volume.
- Who are the founders and what is their background?
- The company was founded by sisters Jen (CEO) and Tiff (COO). Slide 5 showcases a strong pedigree in both retail and corporate operations, featuring logos from Nordstrom, Tommy Hilfiger, Gymboree, Janie and Jack, KPMG, and Microsoft. This mix of high-fashion experience and professional services suggests a balance of creative and operational discipline.
- What is missing from the T&J Designs pitch deck?
- The deck is notably missing an 'Ask' slide. There is no mention of how much capital they are raising, the valuation, or how the funds will be allocated. Additionally, it lacks a formal competitor analysis and a multi-year financial projection, focusing instead on current traction and historical performance.