Tipalti’s pitch deck is designed for later-stage investors who prioritize unit economics and market defensibility over raw experimentation. Founded in 2010, the company uses this deck to showcase a transition from a niche payment tool to a holistic 'payables operations' platform. The narrative centers on the inefficiency of manual AP processes—citing a $12 cost per invoice and 80% workload reduction—while leveraging a massive logo wall including Amazon, Twitter, and GoPro. While many specific financial figures are redacted in this version (using 'XX' placeholders), the structure reveals a hea…
Key takeaways
- The deck identifies a $60 billion per year Total Addressable Market (TAM) specifically within the mid-market segment (Slide 11).
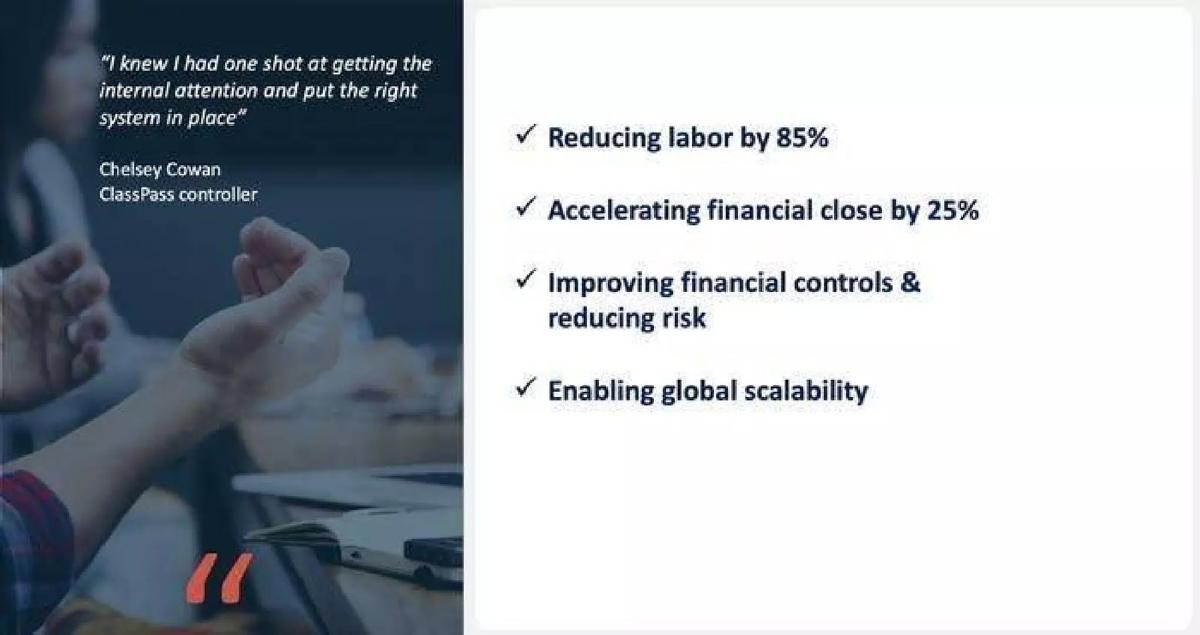
- Tipalti claims to reduce accounts payable workload by 85% for its customers (Slide 7).
- The platform manages $8 billion in annual transactions across more than 500 customers and 4 million payees (Slide 8).
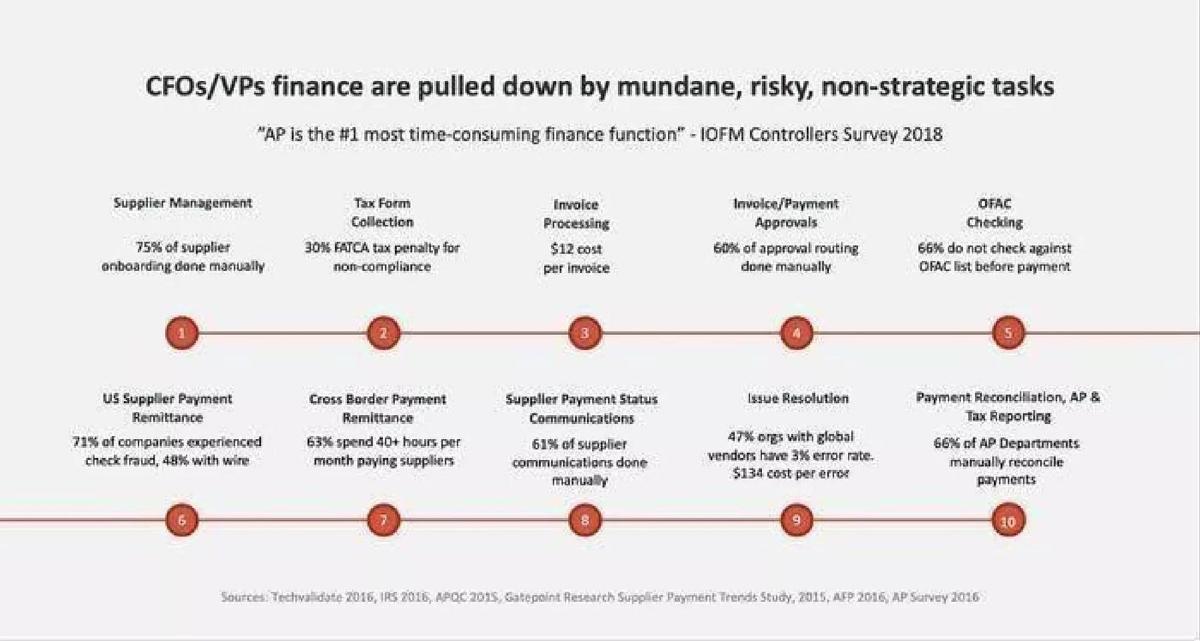
- Manual invoice processing is cited as costing businesses $12 per invoice, highlighting a clear efficiency gap (Slide 3).
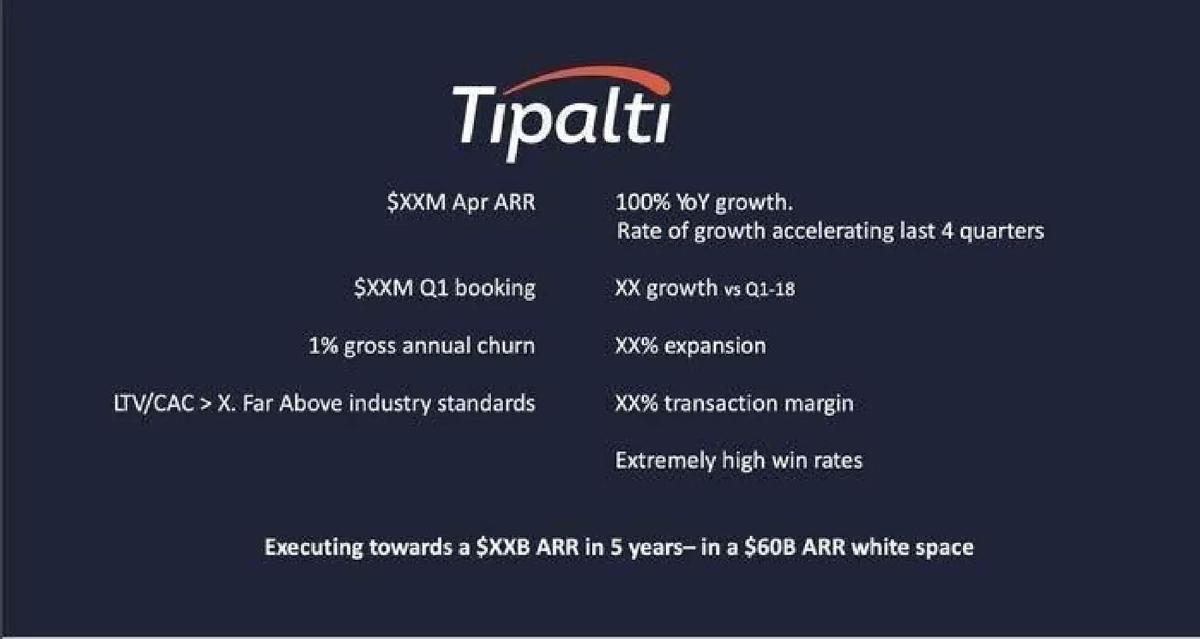
- The company emphasizes strong unit economics, noting an LTV/CAC ratio that is 'Far Above industry standards' (Slide 2).
- A significant portion of won deals are 'non-contested,' suggesting a lack of direct competition in their specific niche (Slide 12).
- The leadership team features executives with deep experience from NetSuite, Visa, and FirstData (Slide 15).
- The deck highlights a gross annual churn rate of only 1%, indicating extremely high product stickiness (Slide 2).
Executive Summary: The Efficiency Engine of the Mid-Market
Tipalti’s 18-slide deck is a textbook example of a later-stage B2B SaaS pitch. It moves quickly past the 'vision' and settles into the 'mechanics' of a scaling business. Founded in 2010, Tipalti addresses the fragmented and manual nature of accounts payable (AP). The deck frames AP not just as a cost center, but as a strategic bottleneck that, when solved, unlocks massive scalability for mid-market companies. With $565 million raised to date, this deck represents the narrative that convinced investors of Tipalti's ability to dominate a $60 billion white space.
Slides 1-2: The Hook and the Metrics
The deck opens with a standard title slide featuring CEO Chen Amit. However, Slide 2 immediately dives into 'The Numbers.' This is a common tactic for companies with strong traction. Even with the redactions, the slide highlights 100% YoY growth and a 1% gross annual churn . The mention of an LTV/CAC ratio 'Far Above industry standards' signals to investors that Tipalti has a highly efficient customer acquisition engine. The slide concludes with a bold vision: executing towards a $XXB ARR in 5 years within a $60B ARR white space .
Slides 3-4: Defining the Pain and the Market Size
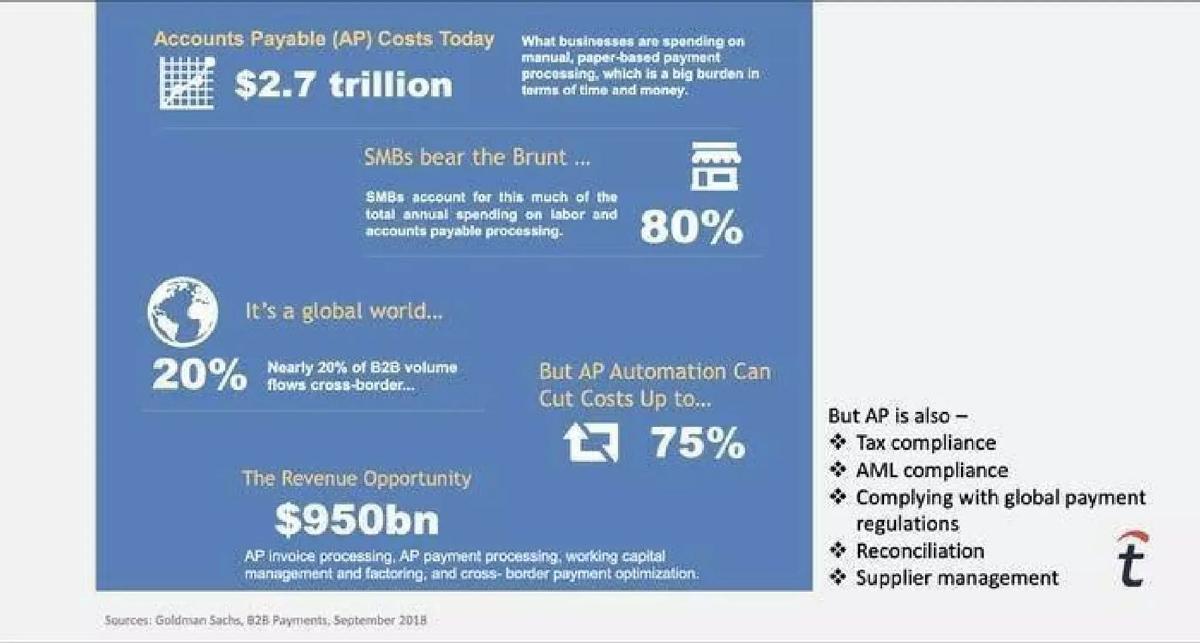
Slide 3 uses a 10-step timeline to illustrate the 'mundane, risky, non-strategic tasks' that pull down CFOs. It cites specific pain points: $12 cost per invoice , 75% of supplier onboarding done manually , and 66% of departments manually reconciling payments . By quantifying the pain, Tipalti justifies its existence. Slide 4 expands this to the macro level, citing a $2.7 trillion total cost for AP today, with SMBs bearing 80% of that burden. The revenue opportunity is pegged at $950bn across invoice processing, payments, and working capital.
Slides 5-7: The Solution and Social Proof
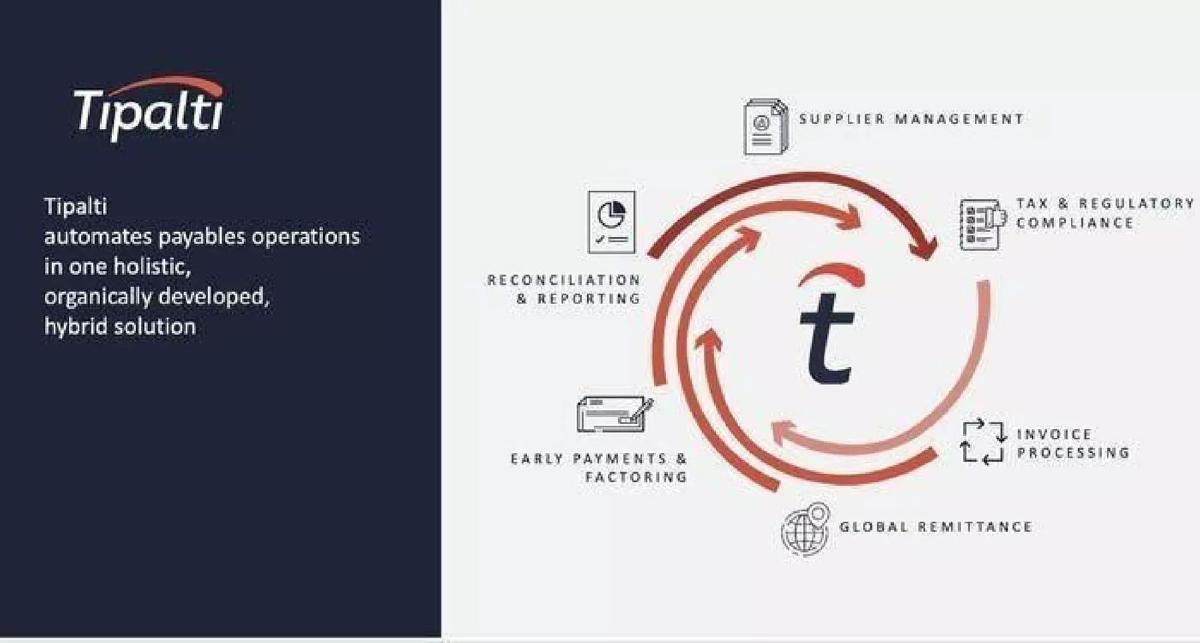
Slide 5 introduces the Tipalti 'holistic' solution, visualized as a circular workflow covering everything from tax compliance to early payments. Slide 6 and 7 focus on impact. A testimonial from the ClassPass controller claims a 25% acceleration in financial close and an 85% reduction in labor . Slide 7 reinforces this with snippets from Twitter, Seeking Alpha, and Touch of Modern, the latter of which scaled from $6M to $150M in annual revenue without adding AP resources thanks to Tipalti.
Slides 8-10: Traction and Growth Velocity
Slide 8 is a powerful 'Logo Wall' featuring 500+ customers , including Amazon, GoPro, and Vimeo. The key metrics here are $8B in transactions managed annually and 4M+ payees . Slide 9, titled 'Accelerating Growth Rate,' uses three charts with upward-sloping arrows for Recurring Revenues, Revenue Growth Rate, and Deal Count. While the Y-axis values are missing, the intent is to show momentum rather than stagnation.
Slides 11-12: TAM and Competitive Moats
Slide 11 provides a detailed breakdown of the $60 Billion Per Year TAM . It targets the 'Whole of mid-market,' identifying nearly 400,000 global companies . Slide 12 is perhaps the most strategically interesting. It claims that a large percentage of won deals are 'non-contested' and that when competitive, Tipalti wins 'XX% of the time.' This suggests that Tipalti is often the first professionalized solution these companies encounter, creating a significant first-mover advantage.
Slides 13-16: The People Behind the Platform
After a transition slide, Slide 14 highlights the company culture, noting offices in California and Israel and multiple 'Best Places to Work' awards from 2017-2019. Slide 15 introduces the Leadership Team, emphasizing pedigree: NetSuite, KKR, FirstData, and Intuit. Slide 16 showcases a heavy-hitting Board of Directors, including the former CEO of Visa USA and the lead investor in companies like TripActions and Houzz. This level of institutional experience is designed to de-risk the investment.
Slides 17-18: The Grand Finale
The deck closes with 'The Grand' (Slide 17) and a summary slide (Slide 18) that reiterates the core thesis: Tipalti is on track to dominate a huge, underserved market. It lists 'High barriers' and 'Proven scalability' as final takeaways. The slide repeats the $60B/year TAM figure, ensuring it is the last number the investor remembers.
What Works in the Tipalti Deck
Quantified Pain Points: The deck does an excellent job of putting a dollar value on inefficiency. Citing a $12 cost per invoice (Slide 3) makes the return on investment (ROI) for the software immediate and obvious.
Segment Focus: By explicitly targeting the 'mid-market' (Slide 11), Tipalti avoids the 'everything for everyone' trap. They define their sandbox clearly, which makes their TAM calculations more believable.
Social Proof: The combination of a high-tier logo wall (Slide 8) and specific case study metrics (Slide 7) provides the necessary validation for a later-stage round. Seeing Amazon and Twitter on the same slide as an 85% workload reduction is a powerful combination.
What is Missing from the Tipalti Deck
The Ask: There is no slide indicating how much money is being raised, the terms of the round, or the specific use of proceeds. While this is common in 'leaked' or 'teaser' versions of decks, its absence in a fundraising context is a major gap.
Product Depth: The deck stays at a very high level regarding the 'how.' There are no screenshots of the actual interface or details on how they integrate with existing ERPs (Enterprise Resource Planning) like NetSuite or Sage, which is a critical part of the sales process for this type of software.
Unit Economic Specifics: While they boast about LTV/CAC and Churn, the redaction of the actual numbers (Slide 2) makes it impossible to verify the 'Far Above industry standards' claim without the underlying data room.
What a Founder Should Copy
The 'Efficiency' Narrative: If you are building back-office software, copy Tipalti’s approach to Slide 3. Don't just say your software is 'better'; map out the manual process you are replacing and attach a cost or time metric to every single step.
The Competitive Win-Rate Slide: Slide 12 is a brilliant way to show market dominance. If you can prove that you are winning deals without competition, it tells investors that you have found a 'blue ocean' within a crowded industry.
Board Credibility: If you have high-profile board members or advisors, give them their own slide (Slide 16). In later-stage rounds, the 'who' is often just as important as the 'what,' as it signals that the company has the adult supervision required to reach an IPO.
Final Thought: Tipalti’s deck is not flashy. It uses a simple color palette and standard layouts. However, it is relentless in its focus on scale, efficiency, and market size. It is a deck built for a company that knows exactly what it is and who it serves.
Frequently asked questions
- What is Tipalti's core value proposition according to the deck?
- Tipalti positions itself as a holistic solution for automating the entire payables workflow. According to Slide 5, this includes supplier management, tax and regulatory compliance, invoice processing, global remittance, and reconciliation. The primary goal is to eliminate the 'mundane, risky, non-strategic tasks' that consume the time of CFOs and finance VPs, ultimately reducing labor by 85% (Slide 6).
- How does Tipalti define its target market and TAM?
- The deck focuses heavily on the 'mid-market' sector. Slide 11 breaks this down into 195,759 US companies and 391,518 global companies, representing $20 trillion in total spend. This results in a calculated TAM of $60 billion per annum. Slide 4 notes that SMBs bear the brunt of these costs, accounting for 80% of total annual spending on labor and AP processing.
- What evidence of market traction does the company provide?
- Tipalti showcases significant scale through a logo wall of over 500 customers, including high-profile names like Amazon, Twitter, GoPro, and Roblox (Slide 8). They manage $8 billion in annual transactions and have reached 4 million payees. Furthermore, Slide 9 shows three charts with upward-trending arrows for recurring revenues, revenue growth rate, and deal count, though specific numbers are redacted.
- Who are the key members of the leadership and board?
- The team is highly experienced in fintech and SaaS. CEO Chen Amit previously sold Atrica to Nokia-NSN. CMO Rob Israch came from NetSuite (pre-to-post IPO), and CFO Sarah Spoja has a background at KKR and Bain & Co (Slide 15). The board includes Oren Zeev (Zeev Ventures), Carl Pascarella (former CEO of Visa USA), and Dovi Frances (01 Advisors) (Slide 16).
- What are the most significant missing elements in this deck?
- The most obvious omission is a specific 'Ask' slide detailing how much capital is being raised and how it will be deployed. Additionally, while the deck mentions unit economics like LTV/CAC and churn, the actual dollar values for ARR and bookings are redacted as '$XXM' (Slide 2). There is also a lack of a detailed product roadmap or a deep dive into the underlying technology architecture.