Tive’s Series B deck is a study in momentum. By framing the global shipping crisis—specifically the $100B+ in lost or damaged goods—as a visibility problem, Tive positions its cellular trackers and software as the essential solution. The deck excels at demonstrating product-market fit through two distinct growth charts: one for Annual Run Rate and another for physical trackers shipped, proving they can scale hardware as fast as SaaS. While the deck uses placeholders for certain sensitive unit economics like CAC and Sales Cycle, it provides hard data on Net Dollar Retention (116%) and customer…
Key takeaways
- The deck identifies a $22T global shipping market, narrowing the focus to $4T in sensitive goods and a $100B+ loss problem on Slide 2.
- Tive demonstrates a clear hockey-stick revenue trajectory from Q2 2018 through Q1 2022 on Slide 3.
- Hardware scalability is proven on Slide 4, showing an exponential curve of trackers shipped through the start of 2022.
- The company boasts a high Net Dollar Retention of 116%, indicating strong expansion within existing accounts on Slide 5.
- Tive has successfully moved upmarket, reporting 50 customers with an ACV of over $100k on Slide 5.
- The team slide (Slide 6) emphasizes deep domain expertise, citing the CEO's development of the world's first all-in-one radio on a chip.
- The deck utilizes a 'placeholder' strategy for sensitive metrics like CAC and Sales Cycle, likely to protect data during broad circulation while signaling they track these KPIs (Slide 5).
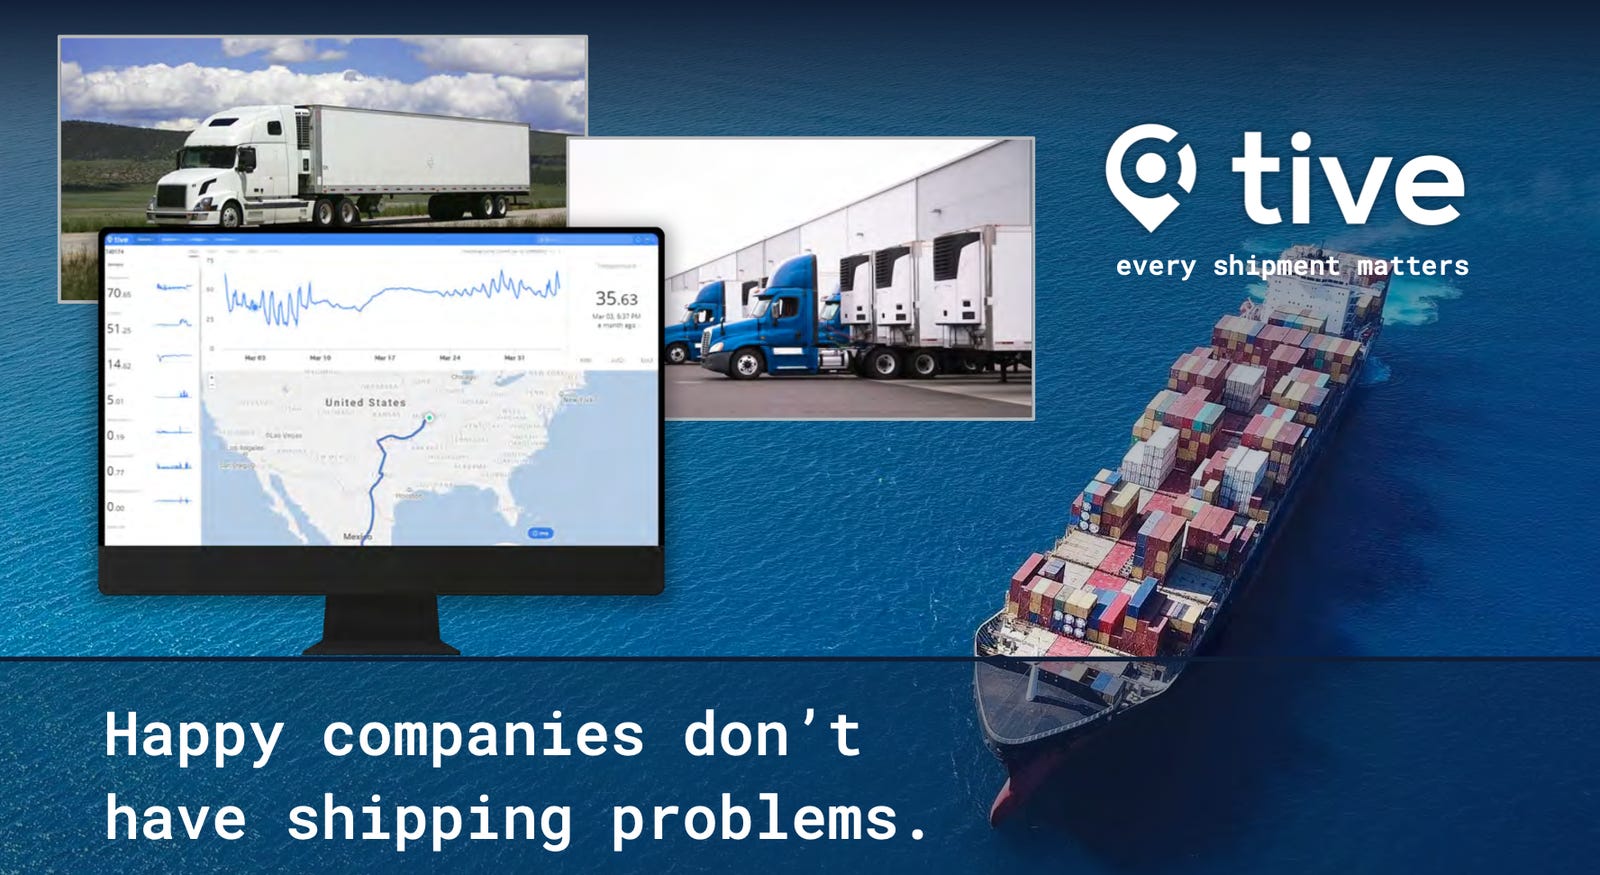
- The visual narrative centers on 'every shipment matters,' connecting the hardware trackers to a software dashboard shown on Slide 1.
The Narrative: Visibility as a Global Necessity
Tive’s pitch deck for their $54M Series B is a masterclass in establishing a 'must-have' rather than a 'nice-to-have' value proposition. In the wake of global supply chain disruptions, Tive positions itself not just as a tracking company, but as the solution to a $100B+ waste problem. The deck follows a classic venture capital narrative: massive market, acute pain point, explosive traction, and a team capable of defending the moat.
Slide 1: The Vision Statement
The cover slide sets the stage with a high-resolution image of a container ship and a software dashboard. The tagline, 'Every shipment matters,' is more than a slogan; it is the core thesis of the business. By showing the hardware (trucks and ships) alongside the software (data visualizations on a monitor), Tive immediately communicates their hybrid business model. It tells the investor: we are the bridge between the physical world of logistics and the digital world of data.
Slide 2: The $100B+ Problem
Slide 2 is a textbook example of market sizing. It starts with a staggering $22T global shipping figure, but quickly narrows it down to the relevant segment: $4T of goods that are sensitive to time, temperature, or shock. The 'hook' is the final figure: $100B+ of goods are lost or damaged. This slide justifies the cost of Tive’s service. If a company is part of that $100B loss, a cellular tracker is a negligible expense compared to the value of the cargo protected. The use of a bright red callout for the loss figure creates a sense of urgency.
Slide 3: The Revenue Hockey Stick
Traction is the ultimate de-risker. Slide 3 shows an Annual Run Rate (ARR) chart from Q2 2018 to Q1 2022. The growth is clearly exponential, with the steepest part of the curve occurring in 2021 and early 2022. This timing is significant, as it aligns with the period when global supply chains were under the most stress, proving that Tive’s solution thrives in volatile environments. The green bar for Q1 '22 signals that the momentum is not just historical, but current.
Slide 4: Proving Hardware Scalability
For many VCs, hardware is a 'hard' pass because of manufacturing risks. Slide 4 addresses this head-on. By plotting 'Tive Trackers Shipped vs. Ship Date,' the company shows a curve that almost perfectly mirrors their revenue growth. This proves that their supply chain and manufacturing processes are robust enough to keep up with sales demand. The slide includes a placeholder for the exact number of trackers shipped in 2021, but the visual trend line—showing a massive spike starting in late 2020—speaks for itself.
Slide 5: The Unit Economics of a Scale-Up
Slide 5 is the most data-dense slide in the deck. While it uses 'XX' placeholders for Sales Cycle, COGS, CAC, and Magic Number, it provides three critical 'hard' numbers that would satisfy a Series B investor: $85K ACV , 116% Net Dollar Retention , and a customer count of 289 . The fact that 50 of those customers are paying over $100k per year proves that Tive has successfully moved into the enterprise space. The 116% NDR is particularly impressive for a hardware-enabled business, as it indicates a 'land and expand' strategy that is working effectively.
Slide 6: The 'World-Class' Team
The team slide is structured to show depth across every functional area: technology, people, product, software, support, marketing, and sales. Two things stand out: the founder’s specific technical achievement (developing the first all-in-one radio on a chip) and the logos at the bottom. By including logos like Monster, TripAdvisor, HP, and Flex, Tive demonstrates that their leadership team comes from high-growth, high-scale environments. This reduces 'execution risk' in the eyes of an investor.
Slide 7: The Closing Brand Reinforcement
The final slide returns to the container ship imagery, reinforcing the scale of the industry Tive operates in. It repeats the 'every shipment matters' mantra, ensuring the investor leaves with a clear understanding of the company's purpose. It is a simple, clean exit that maintains the professional tone of the entire deck.
What Tive Does Exceptionally Well
Tive avoids the common mistake of over-explaining how the cellular technology works. Instead, they focus on the outcomes of that technology: reduced loss, increased visibility, and enterprise-grade scaling. The deck is visually consistent, using a dark blue and white palette that feels 'industrial' and 'trustworthy'—appropriate for the transportation sector.
The dual-track growth visualization (Revenue + Hardware Units) is a brilliant way to handle the 'hardware hurdle.' It shows that the company has mastered the physical logistics of their own business, which gives investors confidence that they can help their customers do the same. Furthermore, the segmentation of their customer base by ACV ($10k+ vs $100k+) shows a sophisticated understanding of their own sales funnel.
What is Missing from the Deck
While this is a strong Series B deck, there are a few notable omissions that were likely handled in the full data room or subsequent meetings:
Competitive Landscape: There is no slide addressing competitors like Roambee or Controlant. In a Series B, investors want to know why Tive is winning against specific incumbents. · Product Roadmap: The deck focuses heavily on what Tive has done. It lacks a 'Future' slide showing where the $54M will be spent—whether that's new sensor types, AI-driven predictive analytics, or geographic expansion. · The 'Ask': The deck does not explicitly state the amount being raised or the intended use of funds. While this is often omitted in 'teaser' versions of decks, a formal pitch usually concludes with a clear financial request.
Lessons for Founders
Quantify the Pain: Don't just say the market is big. Say exactly how much money is being lost by your potential customers every year. Tive's $100B+ loss figure is a powerful motivator. · Show, Don't Just Tell, Scalability: If you have a physical component to your business, you must prove that the physical side can scale as fast as the software side. Tive's 'Trackers Shipped' chart is the perfect way to do this. · Focus on Retention: In a Series B, your Net Dollar Retention (NDR) is often more important than your top-line growth. Tive highlighting their 116% NDR tells investors that their product is 'sticky' and that their customers are finding more ways to use it over time.
Frequently asked questions
- Why does the deck use 'XX' for some unit economics on Slide 5?
- This is a common tactic in decks shared with broader audiences or leaked to the press. It signals to investors that the company tracks sophisticated metrics like CAC Payback and Magic Number, but keeps the specific competitive data for the data room. It protects the company's sensitive operational efficiency data until a formal due diligence process begins.
- How does Tive prove their hardware isn't a bottleneck to growth?
- Slide 4 is dedicated entirely to 'Trackers Shipped to-date!' The chart shows an exponential growth curve that mirrors their revenue growth. By showing they can manufacture and deploy hardware at scale, they alleviate investor fears regarding the supply chain and capital intensity typically associated with hardware-enabled SaaS.
- What is the significance of the $4T figure on Slide 2?
- Slide 2 segments the total $22T shipping market into a $4T 'Serviceable Addressable Market' (SAM). These are goods sensitive to time, temperature, or shock. This helps investors understand that Tive isn't just tracking 'stuff,' but protecting high-value, high-risk cargo where their technology provides the highest ROI.
- What does the 116% Net Dollar Retention tell us about Tive's business model?
- An NDR of 116% (Slide 5) is exceptional for a company involving hardware. it means that even without adding new customers, Tive's revenue grows by 16% annually from its existing base. This suggests that once a logistics manager tries the trackers on a few shipments, they quickly expand the service to their entire fleet or supply chain.
- How does the team slide support the company's technical claims?
- Slide 6 highlights that the founder developed the world's first all-in-one radio on a chip. This specific technical milestone is crucial for a company whose core product is a cellular tracker, as it proves they have the in-house expertise to innovate on hardware size, battery life, and connectivity costs.