Churn and Retention Rates in a Pitch Deck: 16 Real Slides
How to state a churn or retention rate on a traction slide: who is counted, over which period, and against what base.
Churn and Retention Rates in a Pitch Deck: Say Who, Over What Period, and From What Base
"2% churn" and "95% retention" are some of the shortest claims on a traction slide, and some of the hardest to read. The same number means very different things depending on whether it counts customers, users or revenue, whether it is monthly or annual, and which group it starts from. This guide compares sixteen real slides on those three points, including four founder-made cohort charts and what each lets an investor check.
TL;DR
State the unit, the period and the base. Aftersale gives a window ("in the past 4 quarters") beside "+100 retailers" and "zero churn", so the reader can take it as no retailers lost over a year. Tipalti says "1% gross annual churn": gross and annual are stated, but not whether it counts customers or revenue. Most other slides give a bare rate: Backstartup's "2% churn rate", TalentBase's "3%", Back Office's "95% retention rate". Without a period these can't be compared: 2% a month compounds to about 22% of customers lost in a year, while 2% a year is 2%. The DoorDash material, a Sequoia investment memo rather than a founder deck, shows the fullest form: a repeat-rate curve for each monthly customer cohort, starting at 100% and falling to about 40% after the first month.
Churn and retention claims on real pitch deck slides
Each example shows the exact stored slide above its analysis and links to the full teardown. Most complete first. Figures are quoted as shown; conversions are ours and labelled as conditional where the slide leaves the period or unit open.
DoorDash traction slide — slide 2
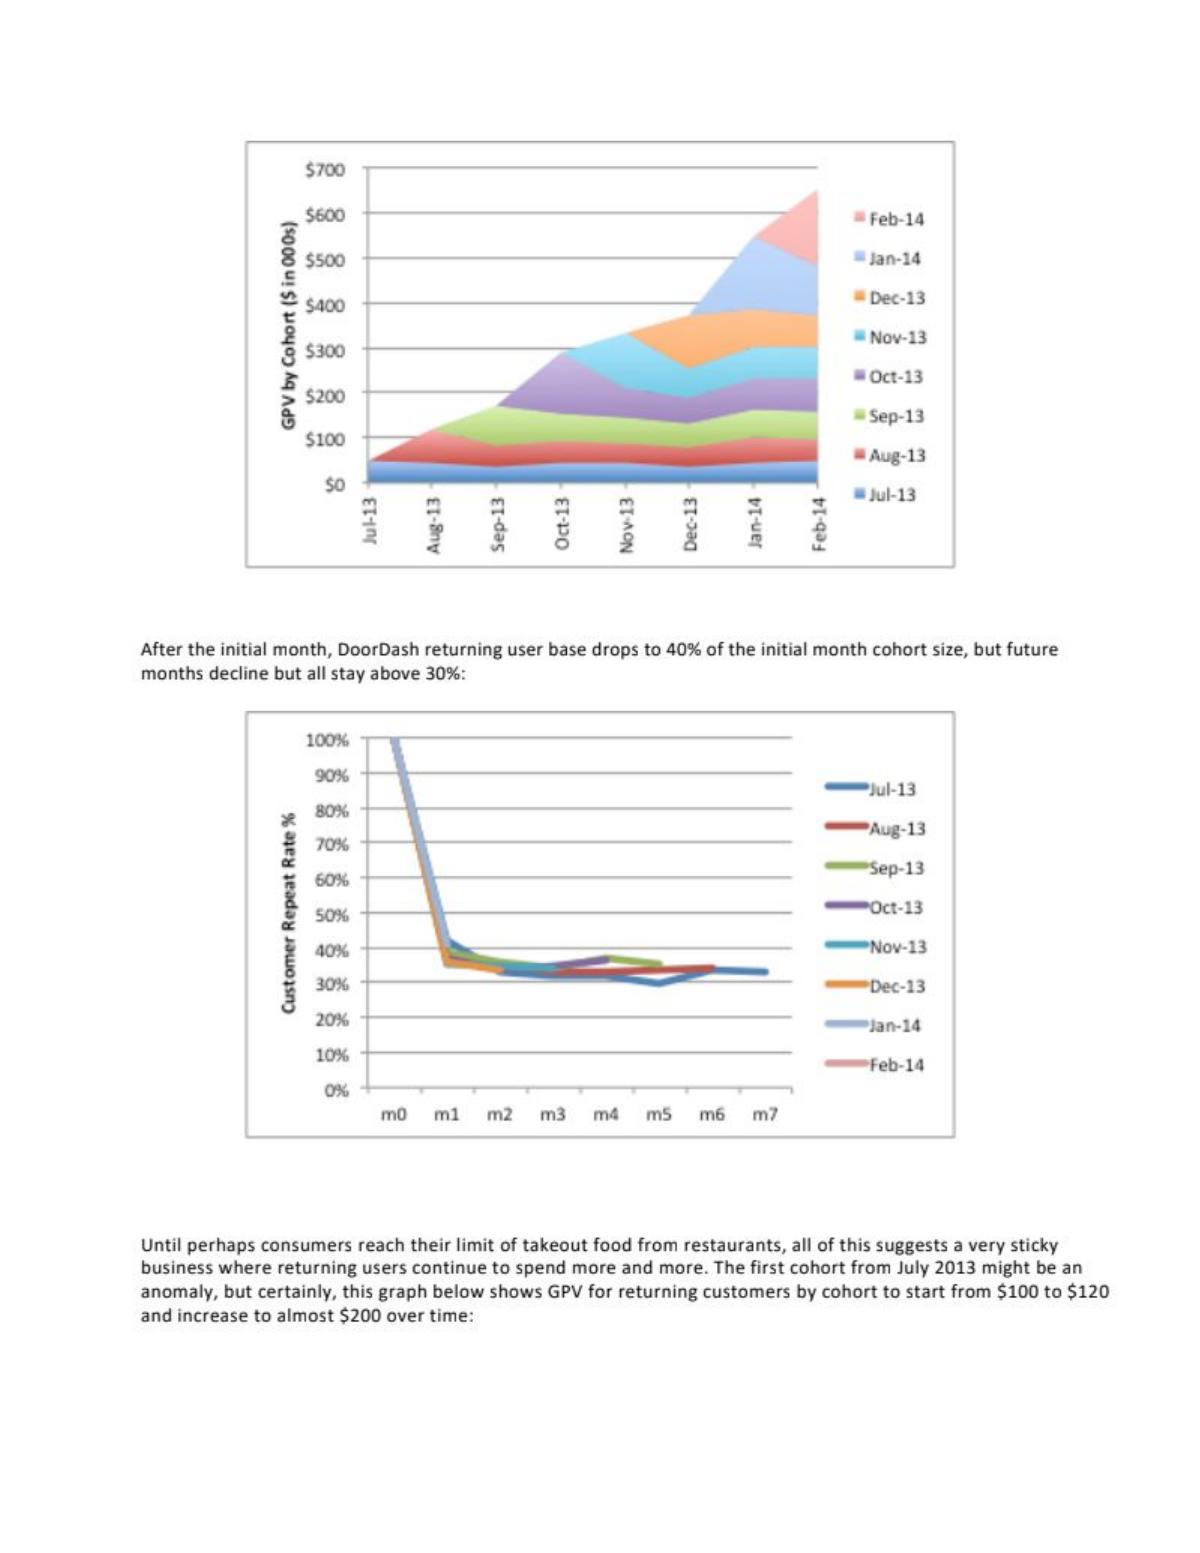
Food delivery, 2014. Our library records this material as a Sequoia Capital investment memo with supporting charts, not a founder-made deck; page 2 is a memo page with two cohort charts.
DoorDash deck, slide 2. Exact stored slide matched to this analysis.
Our analysis: This is cohort retention, not a single churn rate. The text's "above 30%" matches the chart on our reading.
Evidence and limitation: Directly visible: every cohort line starts at 100% in m0 and falls to about 35–42% in m1; lines stay roughly between 30% and 38% from m2 onward, with later cohorts shown for fewer months. The unit (customers who order again), period (month since first order) and base (the starting cohort) are all shown on the chart.
What a founder can adapt: If you have enough monthly cohorts, a repeat-rate chart by cohort answers more questions than any single rate.
Supporting analysis
What the deck claims: "After the initial month, DoorDash returning user base drops to 40% of the initial month cohort size, but future months decline but all stay above 30%." Lower chart: "Customer Repeat Rate %" by monthly cohort, Jul-13 to Feb-14, months m0–m7. Upper chart: "GPV by Cohort ($ in 000s)", stacked by cohort, Jul-13 to Feb-14.
Presentation choice: A reader can see the steep first-month drop and the flattening afterwards, which a single average retention figure would blur together. The GPV chart adds a separate question, whether retained customers spend more, and uses a different unit (gross order value, not revenue).
When it does not fit: Don't read the flat later months as proof that retention will stay above 30% beyond the months shown, and don't treat GPV as revenue.
Building design and engineering software. A full-width cohort table with a callout box.
Cove.tool deck, slide 10. Exact stored slide matched to this analysis.
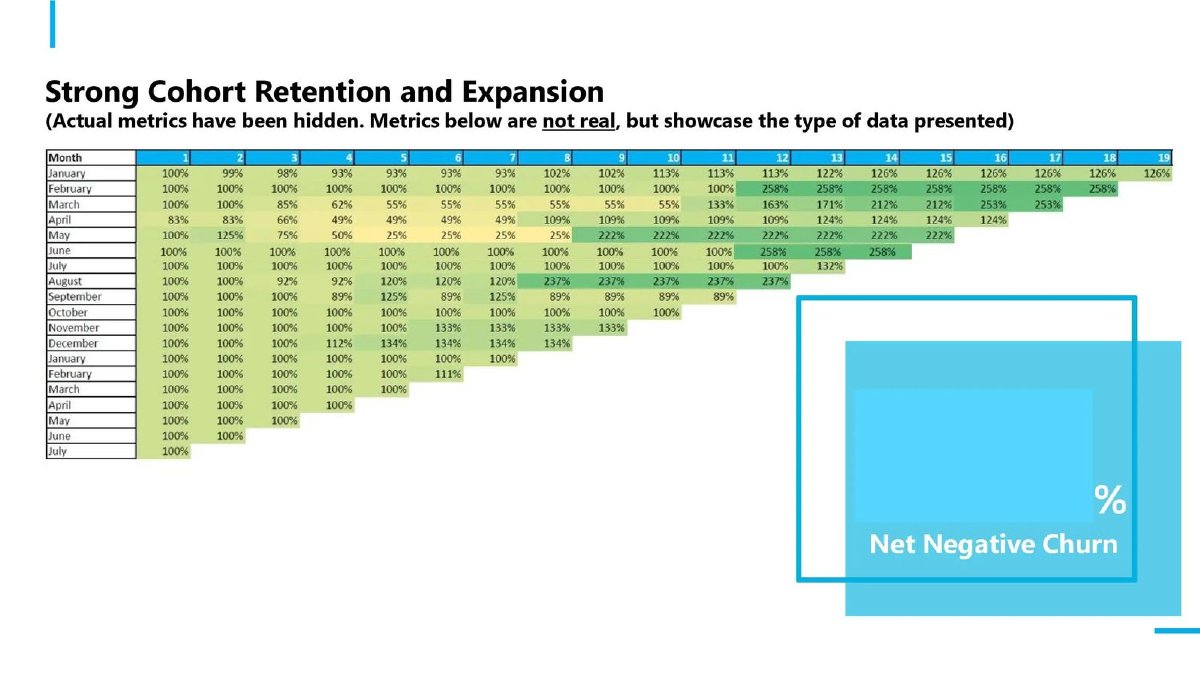
Our analysis: A layout example only. Cells above 100% and the "net negative churn" label indicate the real table measures revenue, where expansion can exceed losses; that is our reading of the labels, not a stated definition.
Evidence and limitation: Directly visible: a triangle table with signup months (January to July of the next year) as rows and months 1 to 19 as columns. Cells start at 100% and range from 25% to 258%; many later cells are above 100%. The slide itself says these values are not real.
What a founder can adapt: Use the same layout with real values, and add a column for each cohort's starting size and a note saying whether cells are revenue or customers.
Supporting analysis
What the deck claims: "Strong Cohort Retention and Expansion" with the subtitle "(Actual metrics have been hidden. Metrics below are not real, but showcase the type of data presented)". Callout: "% Net Negative Churn", with the number blanked.
Presentation choice: It is the clearest picture in this guide of how a revenue cohort table is laid out, and the subtitle is an honest label for scrubbed numbers. Because the values are placeholders, nothing about Cove.tool's actual retention can be read from it.
When it does not fit: Don't present placeholder numbers in a colour-coded table without a label as clear as Cove.tool's; readers will take them as real.
Product analytics software. Slide 17 in the deck's own numbering; two charts side by side under one heading.
Pendo deck, slide 16. Exact stored slide matched to this analysis.
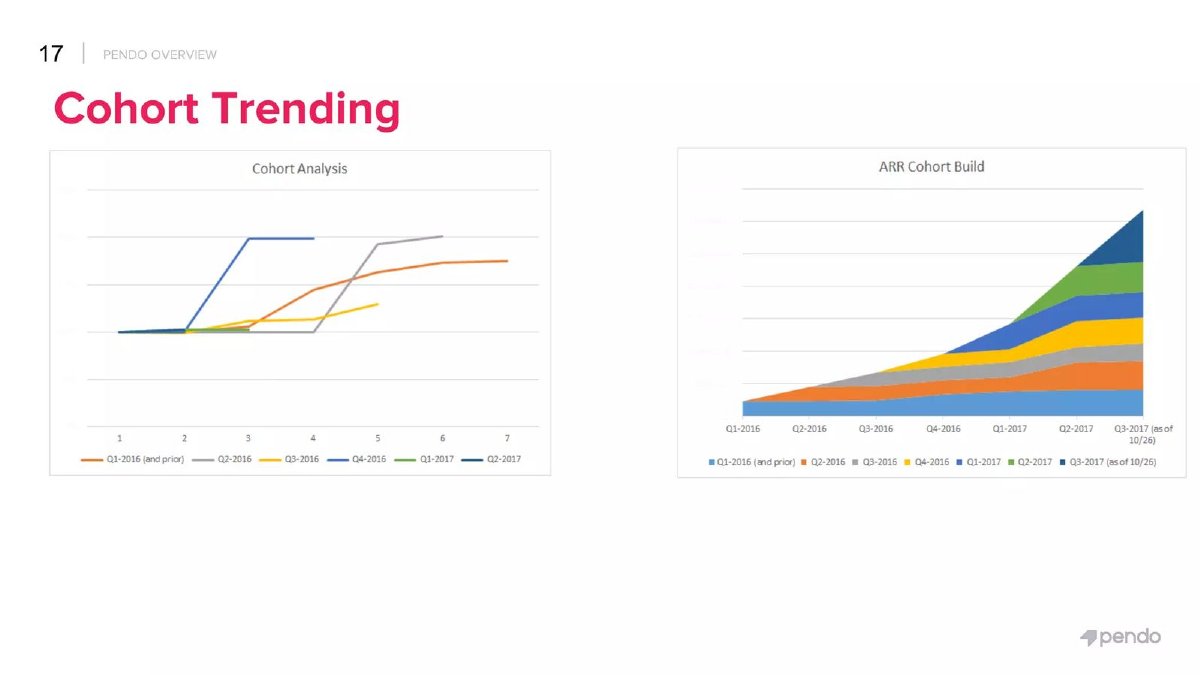
Our analysis: The left chart looks like a revenue-per-cohort index (lines rise above their start), and the right chart shows ARR from older cohorts holding while new ones are added. Without axis values, neither the level of retention nor the size of ARR can be read.
Evidence and limitation: Directly visible: in the left chart, every cohort line starts at the same level and either stays flat or steps upward; none falls below its start. In the right chart, each new cohort adds a layer and earlier layers do not shrink. No axis values are shown on either chart in this copy.
What a founder can adapt: Keep the pairing, label the left axis ("ARR as % of starting ARR") and show the ARR scale on the right.
Supporting analysis
What the deck claims: "Cohort Trending". Left: "Cohort Analysis", lines for quarterly cohorts "Q1-2016 (and prior)" through "Q2-2017" over periods 1 to 7. Right: "ARR Cohort Build", ARR stacked by cohort from Q1-2016 to "Q3-2017 (as of 10/26)".
Presentation choice: It pairs the two layouts investors ask for: how each cohort changes over time, and how much of today's revenue comes from older customers. It shows the shapes well and the amounts not at all.
When it does not fit: Don't remove axis values and then describe the result as strong retention; without a scale, the claim rests on the shape alone.
Travel booking app. A stacked bar chart with a one-sentence claim.
Hopper deck, slide 22. Exact stored slide matched to this analysis.
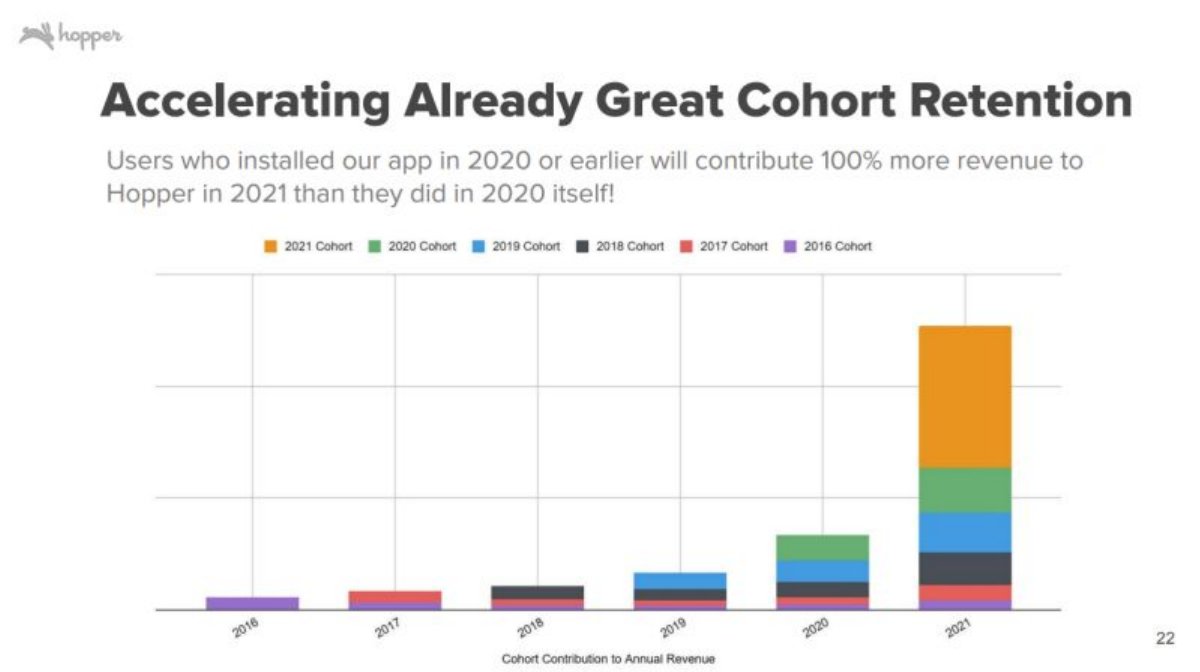
Our analysis: A company claim that pre-2021 users would double their revenue contribution in 2021. It is revenue expansion from existing users, not a retention rate, and the key year is forward-looking.
Evidence and limitation: Directly visible: each year's bar is split by install cohort, and older layers in 2021 are thicker than the same layers in 2020. No revenue scale is shown. The 2021 claim uses "will contribute", so the 2021 bar is a forecast or partial-year projection; the slide doesn't say which.
What a founder can adapt: Mark forecast bars (hatched or labelled "forecast"), add the revenue scale, and say what 2021 figures are based on: "[months] actual + [months] projected".
Supporting analysis
What the deck claims: "Accelerating Already Great Cohort Retention". "Users who installed our app in 2020 or earlier will contribute 100% more revenue to Hopper in 2021 than they did in 2020 itself!" Chart: "Cohort Contribution to Annual Revenue", 2016 to 2021, stacked by 2016 to 2021 install cohorts.
Presentation choice: The layer chart shows clearly that older users keep paying and pay more, which a churn rate can't show. The forecast label is in the sentence but not on the chart, so a quick reader might take the 2021 bar as actual.
When it does not fit: Don't call revenue growth from old cohorts "retention" without saying it combines staying and spending more.
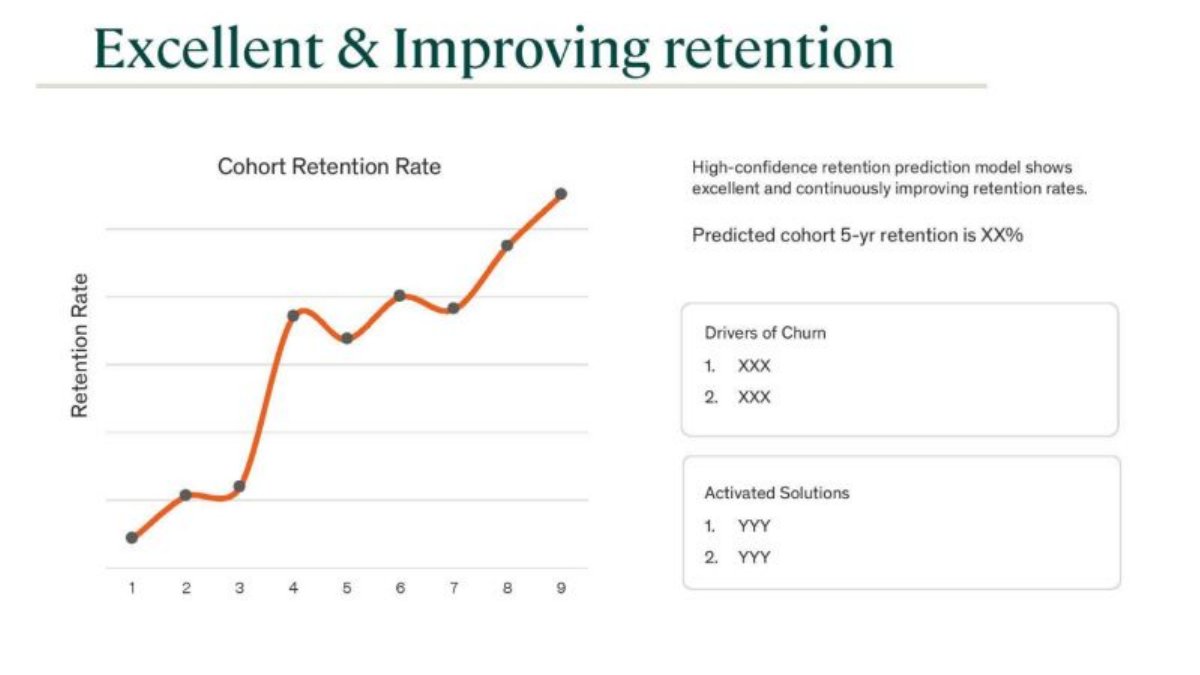
Life insurance. A line chart beside a predicted figure and two boxes of placeholders.
Ethos deck, slide 13. Exact stored slide matched to this analysis.
Our analysis: A template or redacted version. The line appears to compare successive cohorts (later cohorts retaining better), but the slide does not say so, and the five-year figure comes from a model, not observed customers.
Evidence and limitation: Directly visible: the line rises from point 1 to point 9 with dips at 5 and 7; no vertical-axis values, and the horizontal points are not labelled as cohorts or periods. The headline figure is a placeholder, and it is predicted rather than measured.
What a founder can adapt: Keep the structure; fill in measured retention by cohort, label the points ("Q1-2019 cohort"), and give the model's basis next to any predicted figure.
Supporting analysis
What the deck claims: "Excellent & Improving retention". Chart: "Cohort Retention Rate" over points 1 to 9. Text: "High-confidence retention prediction model shows excellent and continuously improving retention rates." "Predicted cohort 5-yr retention is XX%". Boxes: "Drivers of Churn 1. XXX 2. XXX" and "Activated Solutions 1. YYY 2. YYY".
Presentation choice: It shows the parts a strong retention slide would have, including churn drivers and the fixes applied, and how little remains when every number is removed. It is also the only slide here that labels a retention figure as a prediction, which is the right label for a five-year figure from a young company.
When it does not fit: Don't put a modelled multi-year retention figure in a headline without saying how many years of actual data the model rests on.
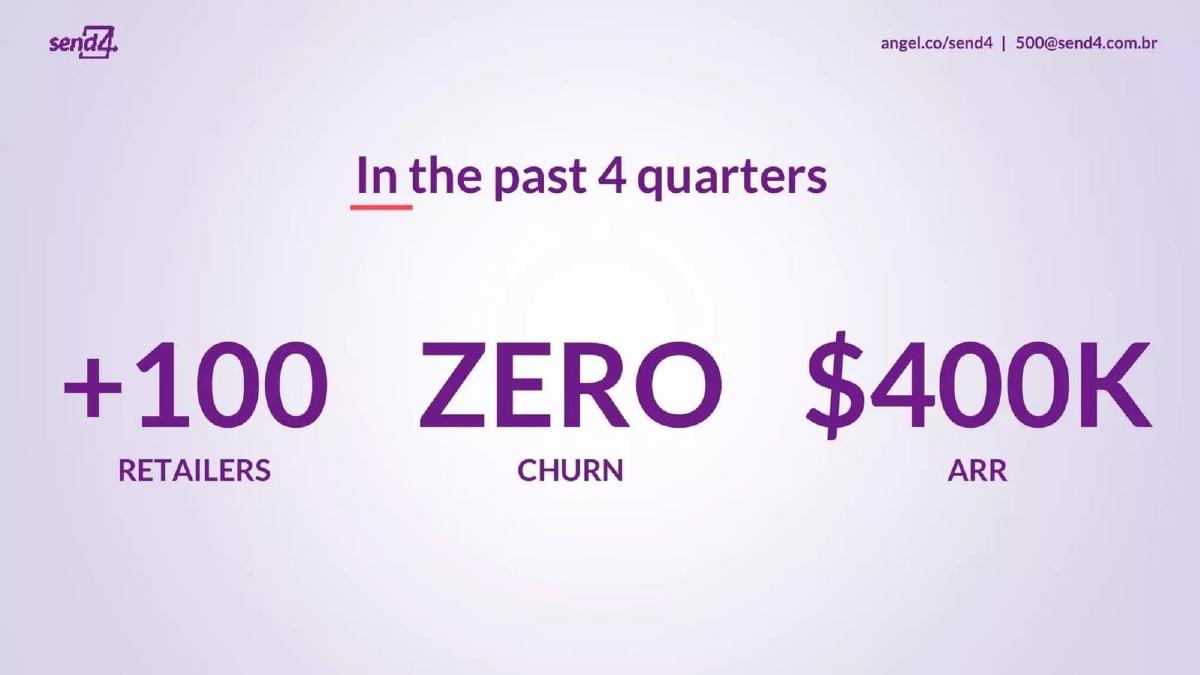
Post-purchase software for online retailers. Three large figures under one heading.
Aftersale deck, slide 2. Exact stored slide matched to this analysis.
Our analysis: A window turns "zero churn" from a slogan into a checkable claim about one year.
Evidence and limitation: The window is stated (four quarters). Placed beside a retailer count, "zero churn" most plausibly means no retailers were lost, but the slide doesn't say whether it counts retailers or revenue. "+100" is a lower bound.
What a founder can adapt: Put the window and the unit next to the rate: "0 of [N] retailers lost, last 4 quarters".
Supporting analysis
What the deck claims: "In the past 4 quarters: +100 retailers, ZERO churn, $400K ARR."
Presentation choice: Stating the period is the single detail most churn claims leave out. With roughly 100 customers, zero losses in a year is a meaningful observation, though a small base means one or two losses would change the rate a lot.
When it does not fit: Zero customer churn says nothing about downgrades; if some accounts shrank, revenue churn wasn't zero.
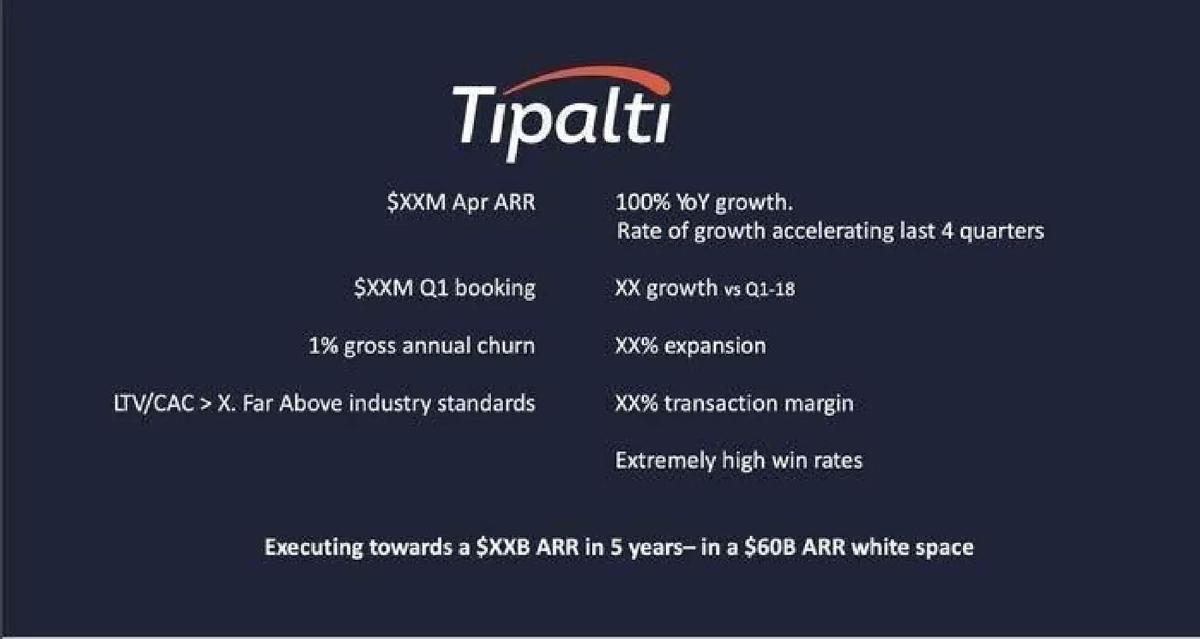
Payables automation. A redacted metrics summary; several values appear as XX.
Tipalti deck, slide 2. Exact stored slide matched to this analysis.
Our analysis: Separating gross churn from expansion is the right structure; the unit is the missing piece.
Evidence and limitation: The slide states two of the three details: gross (before expansion) and annual. It doesn't say whether the 1% counts customers or revenue. The expansion figure is redacted in this copy, so net retention can't be derived.
What a founder can adapt: Write the unit into the label: "1% gross annual revenue churn" or "1% annual customer churn".
Supporting analysis
What the deck claims: "1% gross annual churn" on the left, "XX% expansion" on the right, alongside "$XXM Apr ARR" and "100% YoY growth".
Presentation choice: Showing gross churn and expansion as separate lines stops expansion from hiding losses, which a single net figure can do.
When it does not fit: Don't compare an annual gross rate with another company's monthly or net rate.
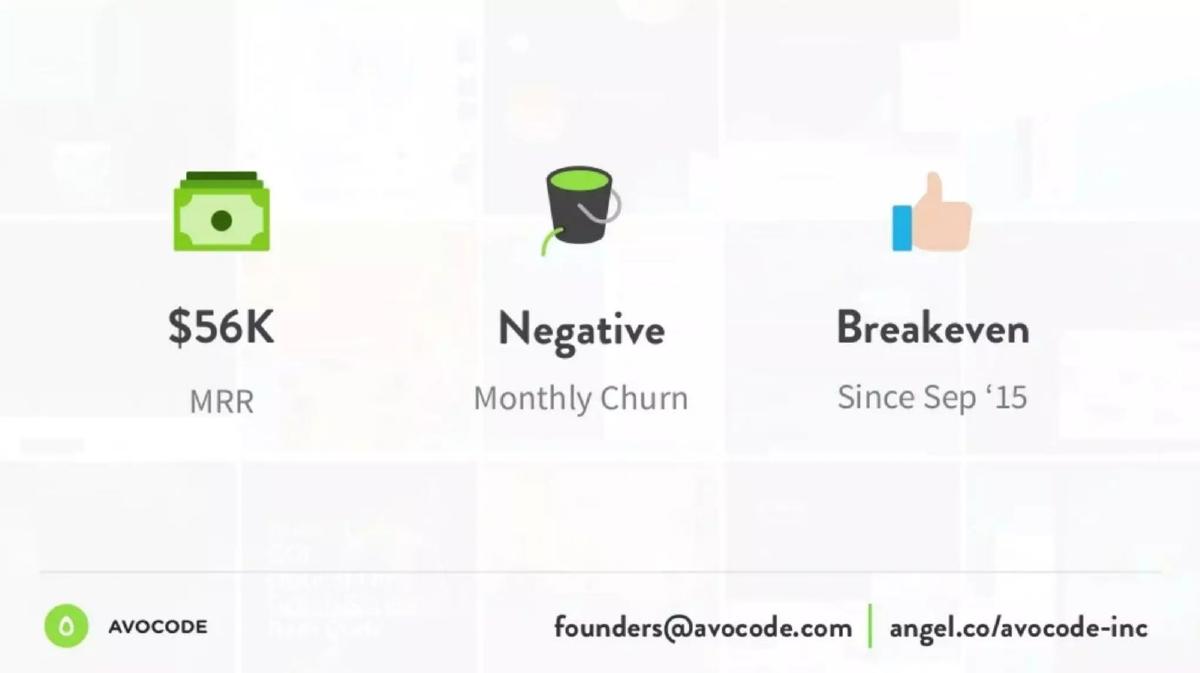
Design-to-code software. Three figures with icons.
Avocode deck, slide 3. Exact stored slide matched to this analysis.
Our analysis: A qualitative label ("negative") in place of a number, on a basis the reader has to infer.
Evidence and limitation: The period is stated (monthly). Churn can only be negative when it is measured on revenue and expansion exceeds lost revenue; a count of customers can't fall below zero losses. So the claim implies net revenue churn, though the slide doesn't say so or give the figure.
What a founder can adapt: Give the number and both parts: "Net MRR churn −[X]%/month; customer churn [Y]%/month".
Supporting analysis
What the deck claims: "$56K MRR." "Negative Monthly Churn." "Breakeven since Sep '15."
Presentation choice: Negative net revenue churn is a strong signal when defined, because existing customers' revenue grows without new sales. Here the reader can't see by how much, or how many customers left.
When it does not fit: Don't present negative revenue churn as if no customers left.
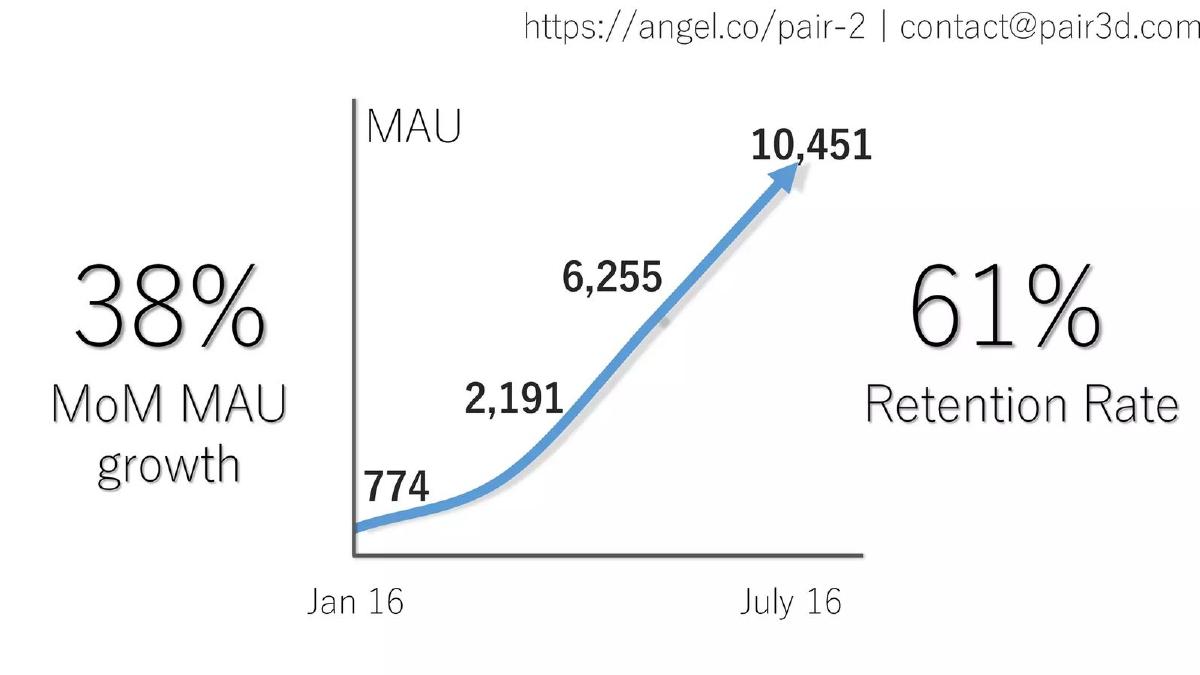
Consumer AR app. A MAU chart between two large percentages.
Pair deck, slide 3. Exact stored slide matched to this analysis.
Our analysis: A user retention figure placed beside user growth, without the window that would let a reader relate the two.
Evidence and limitation: The unit is implied by the chart (users), but the retention period isn't given: day 30, month over month, and share of all users active again are all common definitions and give very different values.
What a founder can adapt: Say "[X]% of users active again [N] days after first use" and name the cohort months.
Supporting analysis
What the deck claims: "38% MoM MAU growth." MAU chart labelled 774, 2,191, 6,255, 10,451, Jan 16 to July 16. "61% Retention Rate."
Presentation choice: For consumer apps, retention after a fixed number of days from signup is the usual form. Without it, 61% could be strong or weak.
When it does not fit: Don't pair a retention rate with a MAU chart without saying whether MAU includes returning users counted in that rate.
DeFi aggregator, Series B. A list of on-chain metrics by network with a Dune query source.
1inch Network deck, slide 3. Exact stored slide matched to this analysis.
Our analysis: A retention rate attached to a cumulative user total, with no window.
Evidence and limitation: The unit is users on Ethereum; on-chain, a "user" is typically a wallet address, and one person can control several. The retention period and definition aren't given. The Dune link is cited for the trader ranking table, not clearly for the retention figure.
What a founder can adapt: If users are wallets, say so, and give the window ("53% of wallets that swapped in [month] swapped again within 30 days").
Supporting analysis
What the deck claims: "910,000+ Total users Ethereum with 53% retention rate." Other bullets give volume and swaps per chain.
Presentation choice: The figure sits inside a dense list, so it reads as a supporting detail; it would carry more weight with a definition.
When it does not fit: Don't imply people when the count is addresses.
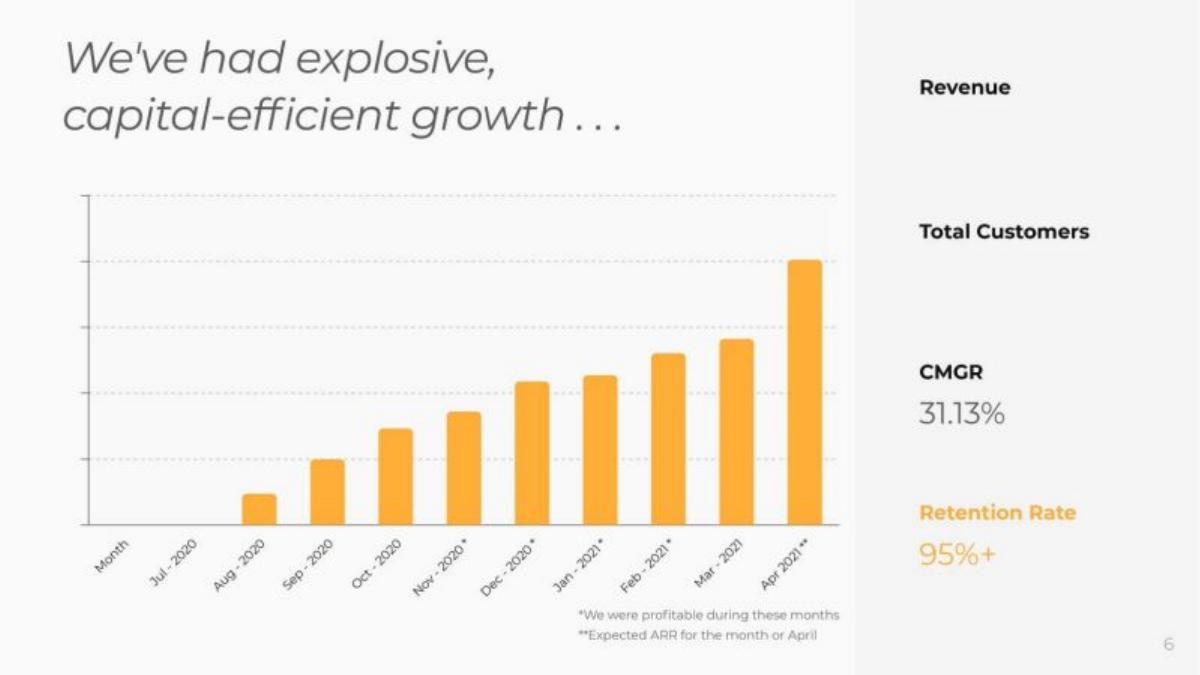
Series A. A monthly revenue bar chart with a side panel of metrics.
Lula deck, slide 5. Exact stored slide matched to this analysis.
Our analysis: A retention figure whose meaning depends entirely on a period the slide doesn't give.
Evidence and limitation: "95%+" is a lower bound with no unit or period. If it were a monthly customer rate, it would allow up to about 46% of customers lost in a year (0.95^12 ≈ 0.54); if annual, up to 5%. The April bar is marked as expected, not actual, and the chart has no printed axis values.
What a founder can adapt: State "[X]% monthly customer retention" or "[X]% of customers retained after 12 months".
Supporting analysis
What the deck claims: Side panel: "Revenue", "Total Customers", "CMGR 31.13%", "Retention Rate 95%+". Chart Jul 2020 to Apr 2021; footnotes: "*We were profitable during these months" and "**Expected ARR for the month of April".
Presentation choice: The footnotes are good practice: they separate projected and actual bars. The retention line needs the same precision.
When it does not fit: Don't leave a lower-bound retention figure without a period.
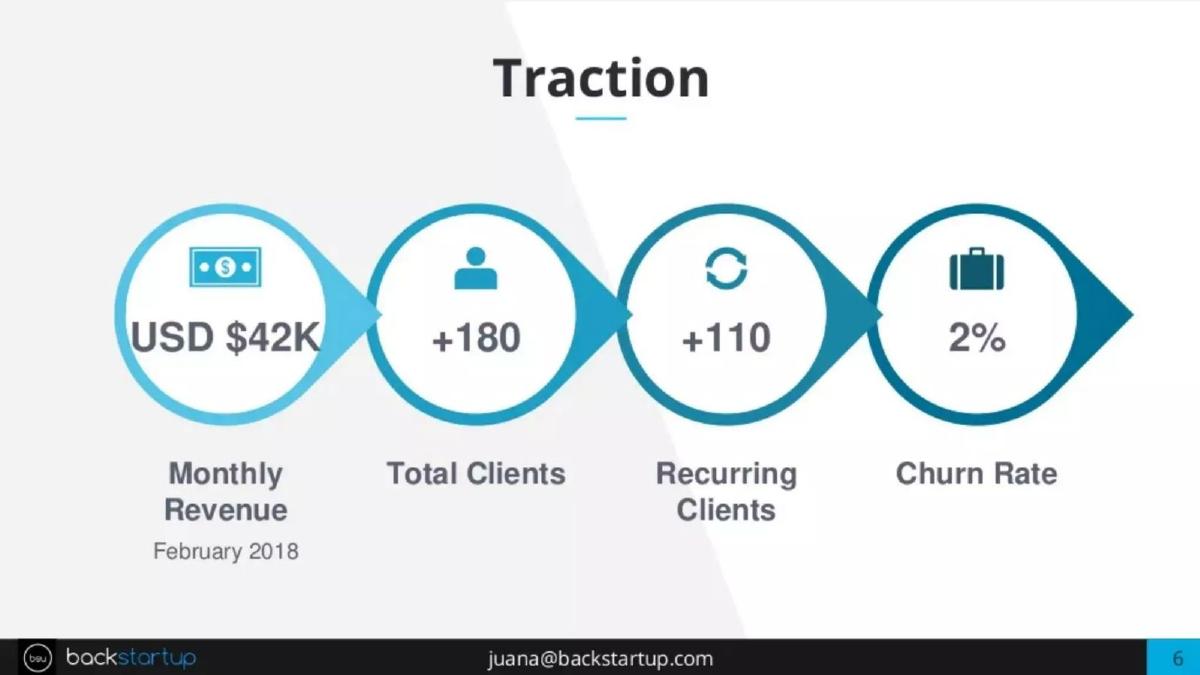
Accounting and legal services for SMEs in Latin America. Four figures in circles.
Backstartup deck, slide 6. Exact stored slide matched to this analysis.
Our analysis: A churn rate beside a recurring-client count, with nothing saying whether it applies to all clients or only the recurring ones.
Evidence and limitation: The revenue has a month; the churn rate has no period or unit. 110 of 180 is about 61%, but that is the share of clients on recurring plans, not retention. Conditional conversion: if 2% is monthly client churn, about 22% of clients would be lost over a year.
What a founder can adapt: Say which clients the rate covers and the period: "2% monthly churn among recurring clients".
Supporting analysis
What the deck claims: "USD $42K Monthly Revenue, February 2018." "+180 Total Clients." "+110 Recurring Clients." "2% Churn Rate."
Presentation choice: Mixed one-off and recurring clients make the base especially important: churn among one-off clients isn't meaningful in the same way.
When it does not fit: Don't read the recurring share (≈61%) as a retention rate.
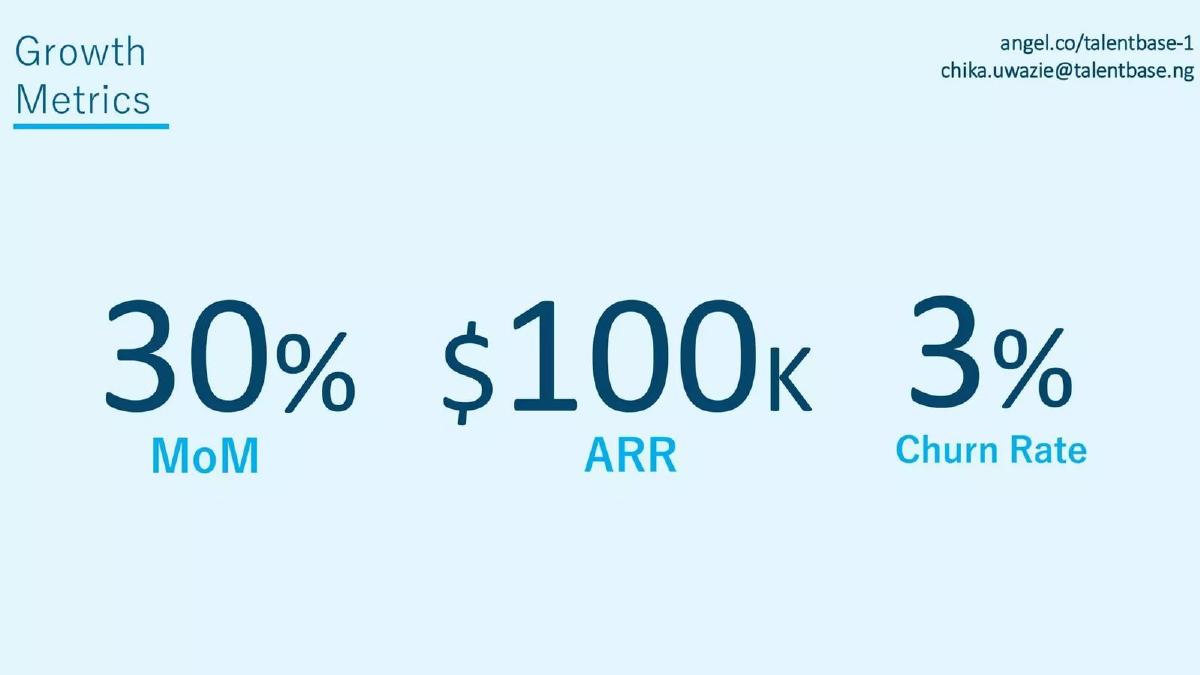
HR and payroll software, Nigeria. Three figures under "Growth Metrics".
TalentBase deck, slide 6. Exact stored slide matched to this analysis.
Our analysis: The same three-number pattern as Hivebeat and Backstartup, with the same missing period.
Evidence and limitation: Neither the metric behind 30% MoM nor the period or unit of the churn rate is stated. Beside a monthly growth figure, a reader will likely assume monthly churn: that would mean about 31% of customers lost over a year (1 − 0.97^12). If it is annual, it means 3%.
What a founder can adapt: Match the period of the growth and churn figures and label both.
Supporting analysis
What the deck claims: "30% MoM." "$100K ARR." "3% Churn Rate."
Presentation choice: The layout invites the reader to net growth against churn, which only works if both use the same period and base.
When it does not fit: Don't set a monthly growth rate beside a churn rate of unstated period.
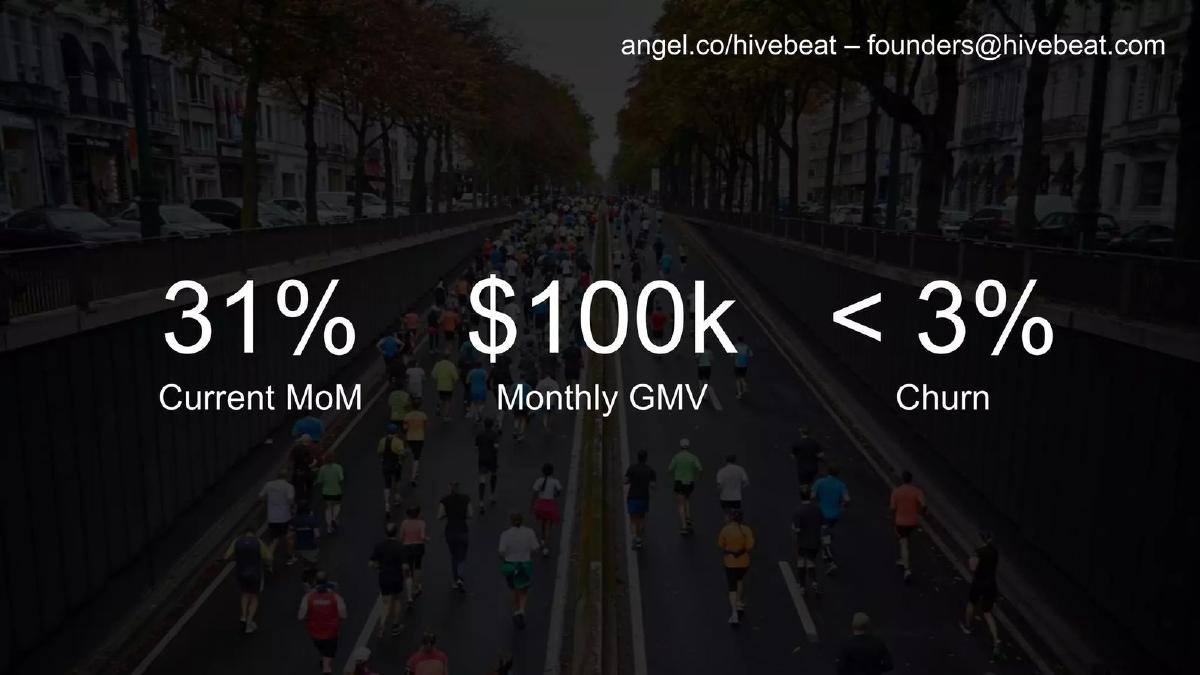
Seed. Three figures over a photo of a running race.
Hivebeat deck, slide 6. Exact stored slide matched to this analysis.
Our analysis: A churn figure next to gross merchandise value, a volume measure, with no link between the two.
Evidence and limitation: "< 3%" is an upper bound. The unit isn't given: next to GMV, it could be customers, event organisers or GMV itself. No period is stated.
What a founder can adapt: Name who churns ("organisers") and the period, and keep it separate from GMV.
Supporting analysis
What the deck claims: "31% Current MoM." "$100k Monthly GMV." "< 3% Churn."
Presentation choice: For a platform, churn of sellers or organisers and churn of GMV can differ a lot; the reader can't tell which is meant.
When it does not fit: Don't imply GMV retention from a customer churn figure, or the reverse.
Back Office (now Finally) traction slide — slide 6
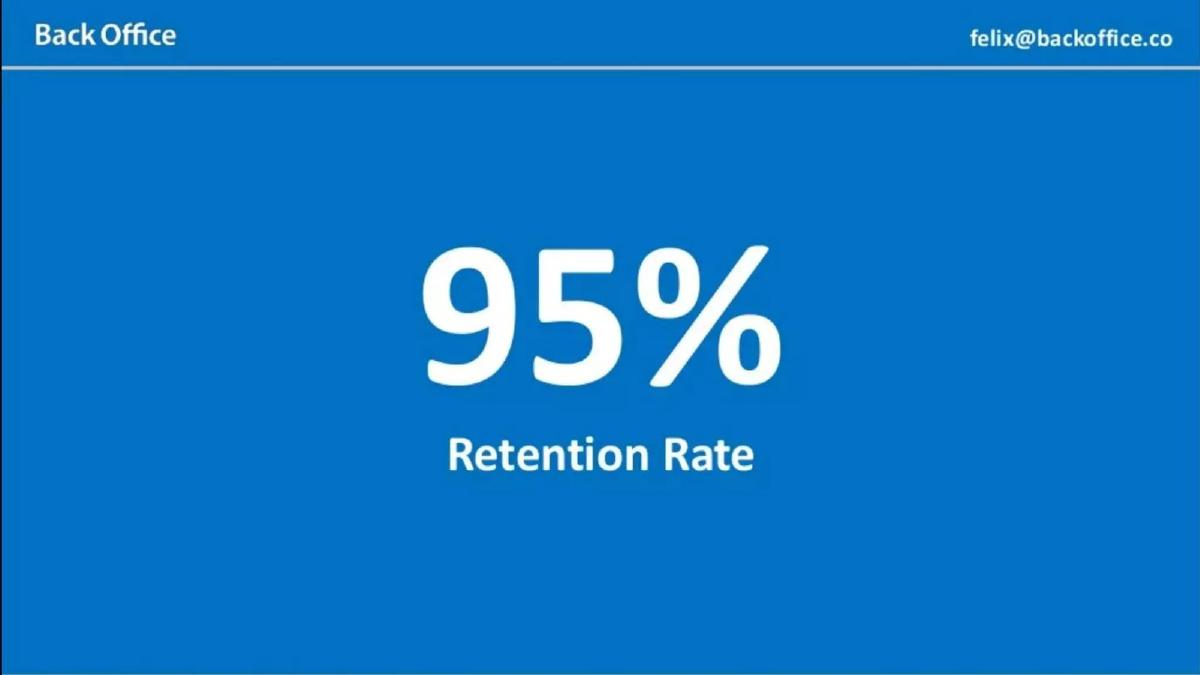
Accounting services. A full slide given to one number.
Back Office deck, slide 6. Exact stored slide matched to this analysis.
Our analysis: Maximum emphasis on the figure, minimum definition.
Evidence and limitation: No unit, period, base or sample size is shown on the slide. As with Lula, 95% monthly and 95% annual retention describe very different businesses.
What a founder can adapt: Keep the emphasis but add one line underneath: unit, period and number of customers.
Supporting analysis
What the deck claims: "95% Retention Rate."
Presentation choice: A whole slide signals that retention is central to the story, which is exactly when the definition matters most.
When it does not fit: Don't give a full slide to a rate the reader can't interpret.
Digital musculoskeletal care. A three-column value slide; retention appears in the subtitle.
Hinge Health deck, slide 4. Exact stored slide matched to this analysis.
Our analysis: A 100% claim used as framing for the slide rather than as a measured metric.
Evidence and limitation: "Client" is not defined on the slide (it may mean paying employer or plan clients rather than patients), and neither the number of clients nor the period is shown. The footnotes support the clinical and ROI claims, not the retention figure.
What a founder can adapt: Give the count and window: "[N] of [N] clients renewed, [year–year]".
Supporting analysis
What the deck claims: "We're the market leader with 100% client retention for several reasons." Columns cover the clinical model, programmes and "proven financial ROI", with footnoted studies.
Presentation choice: "100%" is easy to remember, but its weight depends on how many clients over how long, which the slide omits.
When it does not fit: Don't let footnotes for other claims appear to support the retention figure.
Whether each churn or retention figure states its unit, period and base. "Implied" means a reader could reasonably infer it from context, but the slide doesn't state it.
Example
Claim
Unit
Period
Base / cohort
Main gap
DoorDash (memo)
Repeat rate by cohort, m0–m7
Customers ordering again
Months since first order
Each monthly cohort
Few months per later cohort
Cove.tool
Cohort table (placeholder values)
Implied: revenue
Months since signup
Each monthly cohort
Values stated as not real
Pendo
Cohort lines + ARR by cohort
Implied: revenue / ARR
Quarters since signup
Each quarterly cohort
No axis values
Hopper
Revenue by install cohort
Revenue
Calendar years
Each install year
No scale; 2021 is forward-looking
Ethos
Cohort retention line; 5-yr XX%
Not stated
Points 1–9, unlabelled
Not stated
Placeholders; predicted figure
Aftersale
Zero churn
Implied: retailers
Past 4 quarters
Not stated
Unit not explicit; small base
Tipalti
1% gross annual churn
Not stated
Annual
Not stated
Customers or revenue?
Avocode
Negative monthly churn
Implied: revenue (net)
Monthly
Not stated
No figure given
Pair
61% retention
Implied: users
Not stated
Not stated
Retention window
1inch Network
53% retention
Users (wallets)
Not stated
Not stated
Definition and window
Lula
Retention 95%+
Not stated
Not stated
Not stated
Period; lower bound
Backstartup
2% churn
Not stated
Not stated
Not stated
All clients or recurring?
TalentBase
3% churn
Not stated
Not stated
Not stated
Period
Hivebeat
< 3% churn
Not stated
Not stated
Not stated
Who churns vs GMV
Back Office
95% retention
Not stated
Not stated
Not stated
Everything
Hinge Health
100% client retention
Clients (undefined)
Not stated
Not stated
Count and window
Key Takeaways
Name the unit: customers (logos), users, or revenue. Revenue churn can be negative; customer churn can't.
Name the period: monthly and annual rates differ by roughly a factor of twelve, and more once compounded.
Name the base: all customers at the start of the period, or one signup cohort.
"Retention rate" equals 100% minus churn only when both use the same unit, period and base.
A cohort curve shows how retention changes with customer age; a single rate hides it.
A cohort chart is only checkable with axis values, cohort sizes and a stated unit. Four founder slides here show the layout but hide or omit the numbers.
"Zero churn" or "100% retention" needs the number of customers and the window to mean much.
Write your churn or retention line
Fill in each line before putting a churn or retention figure on a slide.
Unit. Customers, users, or revenue. If revenue: gross (losses and downgrades only) or net (after expansion)?
Period. Monthly, quarterly or annual. For user retention: which day or month after first use (day 30, month 3).
Base. Customers at the start of the period, excluding new ones added during it; or a named signup cohort.
Calculation. Churn = lost in period ÷ at start of period. Retention = 1 − churn only on the same unit, period and base.
Annual equivalent. Annual retention ≈ (1 − monthly churn)^12. 2%/month ≈ 78% kept after a year; 5%/month ≈ 54%.
Sample. How many customers or users the rate covers, and over which months.
Copyable framework: [X]% monthly [customer / user / gross revenue] churn, average of [first month]–[last month], [N] [customers] at start.
Illustrative example 1 — written by us
Before: 2% Churn Rate
After: 2% monthly churn among recurring clients, [first month]–[last month] ([N] clients at start).
What improved: Our illustrative rewrite; not Backstartup's wording. Bracketed values are placeholders, and "monthly" and "recurring clients" are assumptions for illustration. It states the unit, period and base, so the figure can be compared.
What this guide adds
The net revenue retention guide covers revenue-based retention: NRR, gross revenue retention and how expansion is counted. This page covers the simpler rates founders more often print: customer or user churn, a "retention rate", "zero churn" and cohort retention curves. The main traction guide lists churn as one possible metric but does not explain how to state it.
Three questions every churn or retention figure must answer
Who is counted? Customer (logo) churn counts accounts lost. User retention counts people who come back. Revenue churn counts recurring revenue lost, and net revenue churn subtracts expansion, which is why it can go below zero. These can move in opposite directions: losing many small customers while one large one expands can give high customer churn and negative revenue churn.
Over what period? A monthly rate describes one month. A rough annual equivalent is 1 − (1 − monthly churn)^12: 2% a month keeps about 78% of customers after a year (≈22% lost); 3% a month keeps about 69% (≈31% lost). Multiplying a monthly rate by 12 overstates the annual loss slightly, and it assumes the rate is steady.
From what base? Churn in a period is usually customers lost ÷ customers at the start of that period, excluding customers added during it. Cohort retention instead follows one group that started together, for example everyone who first ordered in July, and shows what share is still active each month after.
Three ways founders draw cohorts, and what each needs to be checkable
The triangle table. Each row is a signup cohort, each column is months since signup, and each cell is the share of the starting value still there. Cove.tool's slide uses this layout. If cells count customers, they can only fall or stay flat; if they count revenue, cells above 100% mean the surviving customers now pay more than the whole cohort did at the start. A reader needs to know which, plus the starting size of each row, before the table means anything.
The cohort curve. One line per cohort (or one averaged line), with time since signup on the horizontal axis. DoorDash's memo chart and Pendo's left-hand chart use this layout. The shape tells you whether losses stop after the first months; the vertical axis tells you at what level. Without axis values, as in Pendo's copy, only the shape can be read.
The revenue layer cake. Calendar periods on the horizontal axis, revenue stacked by the year or quarter customers joined. Hopper's and Pendo's right-hand charts use this layout. If older layers keep their thickness or grow, earlier customers are still paying. It mixes retention with growth, so it should not be read as a retention rate, and it needs a revenue scale to show size.
Whatever the layout, state the unit (customers, users or revenue), the cohort period (month or quarter of signup), the base (cohort size at start) and whether any part is a forecast. Those four labels are what turn a cohort picture into evidence.
Why so many cohort slides hide the numbers
Three of the four founder cohort slides in this guide remove or never show their numbers: Cove.tool says its table's metrics are "not real", Pendo's public copy has no axis values, and Ethos prints "XX%". Shared or published versions of decks are often scrubbed, and some slides are templates. That is a reasonable confidentiality choice, but a reader of the public copy should treat these as layouts, not evidence. If you share a redacted deck, say what was removed and offer the full chart in the data room.
How we read each slide
We quote figures as shown. Where a slide doesn't state the unit, period or base, we say so, and any conversion we show (for example monthly to annual) is conditional on an assumption we name. A missing definition does not mean the figure is wrong; it means the reader can't tell what it measures.
Common mistakes
No period. "3% churn" could mean about 31% or 3% lost in a year.
Unit not named. Customer, user and revenue churn can differ a lot, and only revenue churn can be negative.
Retention ≠ 100% − churn by default. Only when both use the same unit, period and base.
New customers in the base. Adding customers gained during the period to the denominator makes churn look lower.
Share mistaken for retention. Recurring clients ÷ total clients is a mix, not a retention rate.
"Zero" or "100%" with no count. With a handful of customers, a perfect rate says little.
Cohort chart without a scale. Shape alone shows direction, not level; investors can't compare it with anything.
Forecast mixed into actual cohorts. A projected year drawn like the others reads as measured.
Diagnostic checklist
Unit named: customers, users, gross or net revenue.
Period named, and the same as any growth rate beside it.
Base named: start-of-period customers or a signup cohort.
Sample size or window given.
Retention and churn figures consistent with each other.
Cohort chart used if you have several months of cohorts.
Cohort chart has axis values, cohort sizes and a stated unit.
Forecast cohorts or years marked on the chart itself, not only in the text.
Placeholder or scrubbed numbers labelled as such.
Frequently asked questions
Should I show a cohort chart or a single churn rate?
If you have at least several months of cohorts, show both: the cohort chart for shape (does loss stop after the first months?) and one stated rate for comparison. A single rate is enough very early, as long as it names unit, period and base.
Why can a revenue cohort go above 100%?
Because remaining customers can pay more than the whole cohort paid at the start, through upgrades or more usage. Customer counts can't exceed 100% of the starting cohort. Label which one your chart shows.
Is it acceptable to hide cohort numbers in a shared deck?
Yes, if the slide says so, as Cove.tool's does. Investors will ask for the real values; make them available in a data room rather than relying on an unscaled chart.
How do I present a predicted long-term retention figure?
Label it as predicted, give the number of months of actual data behind it and the method, and show the measured cohorts beside it. Ethos's slide uses the word "predicted", which is the minimum.
How we chose these examples
Corpus: published pitch deck teardowns on StartupFundraising.com. Founder-uploaded private decks are excluded.
Selection (2026-09-25): we searched stored slide text on slides 2–8 for churn, cohort, retention rate, retained and month-N retention wording, kept only slides with a stored slide image, and inspected sixteen candidate images. We kept slides where a company churn or retention figure appears and each shows a different choice of unit, period or base. Considered but not used: Gymtrack p4 ("40–50% churn rate, 2 years" appears to describe the gym industry rather than the company), Flo p5 (retention mentioned only as text on a download/MAU chart), Giraffe360 p2 ("net of churn" subscription count with no churn rate), Vic.ai p2 ("no churn", already analysed in the data moat guide), Minut p5–p6 (covered in the net revenue retention guide) and a duplicate Back Office upload (usefinally slug).
DoorDash: our library records this item as a Sequoia Capital investment memo with supporting charts (2014), not a founder-made pitch deck. It is included because it shows a cohort retention chart; it does not show how DoorDash's founders presented retention.
Figures are quoted as shown in the stored slide images; chart readings are approximate. Conversions are ours: annual retention ≈ (1 − monthly churn)^12, shown only as conditional on the named assumption. A missing definition is not a claim that a figure is wrong.
Dates: periods are quoted from the slides; deck years from our library index are given only as context where stated.
Update (2026-10-01): added four founder-made cohort slides found by searching stored slide text across all pages for cohort analysis, cohort retention and cohort chart wording. Pages were rendered from the original deck PDFs and checked against the images: Cove.tool p10, Pendo p16 (printed slide 17), Hopper p22, Ethos p13. Considered but not used: Smartrr p7 and Beehiiv p10 (cohort analysis listed as a product feature, not company retention), Tive p6 (already used in the go-to-market guide; no distinct cohort lesson), Instructure p25 and Matterport p27 (listed companies, excluded).
Review: stored slide text and images were checked on 2026-09-25 (the four added slides on 2026-10-01) and matched to company, deck and slide number (editorial model review). No person has yet completed an editorial review of this page. We make no claim that any slide caused a fundraising outcome.