Net Revenue Retention in a Pitch Deck: 9 Real Slides
How to show net revenue retention (NRR or NDR) in a pitch deck so investors can assess it: definition, cohort, period and gross retention beside it.
Net Revenue Retention in a Pitch Deck: How to Show It So Investors Can Assess the Number
Net revenue retention (NRR, also called net dollar retention or NDR) compares what one group of existing customers pays at the end of a period with what the same group paid at the start. It is a common metric on software pitch decks, and one that is easy to present in a way that can't be checked. This guide compares nine real slides.
TL;DR
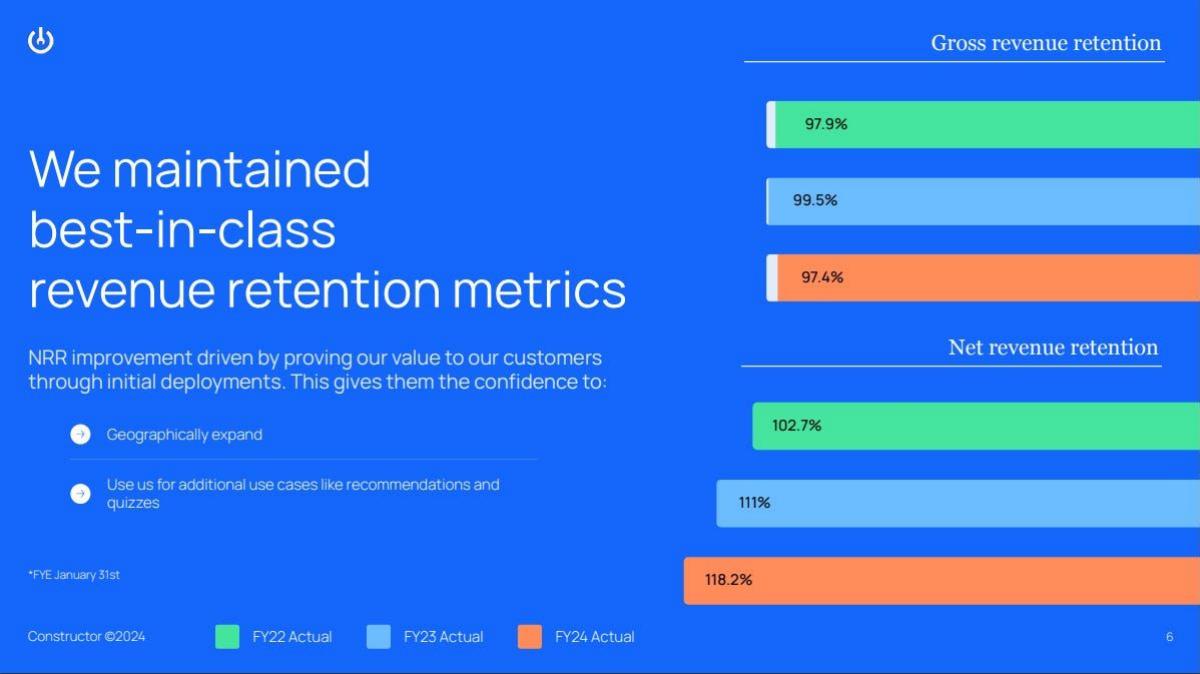
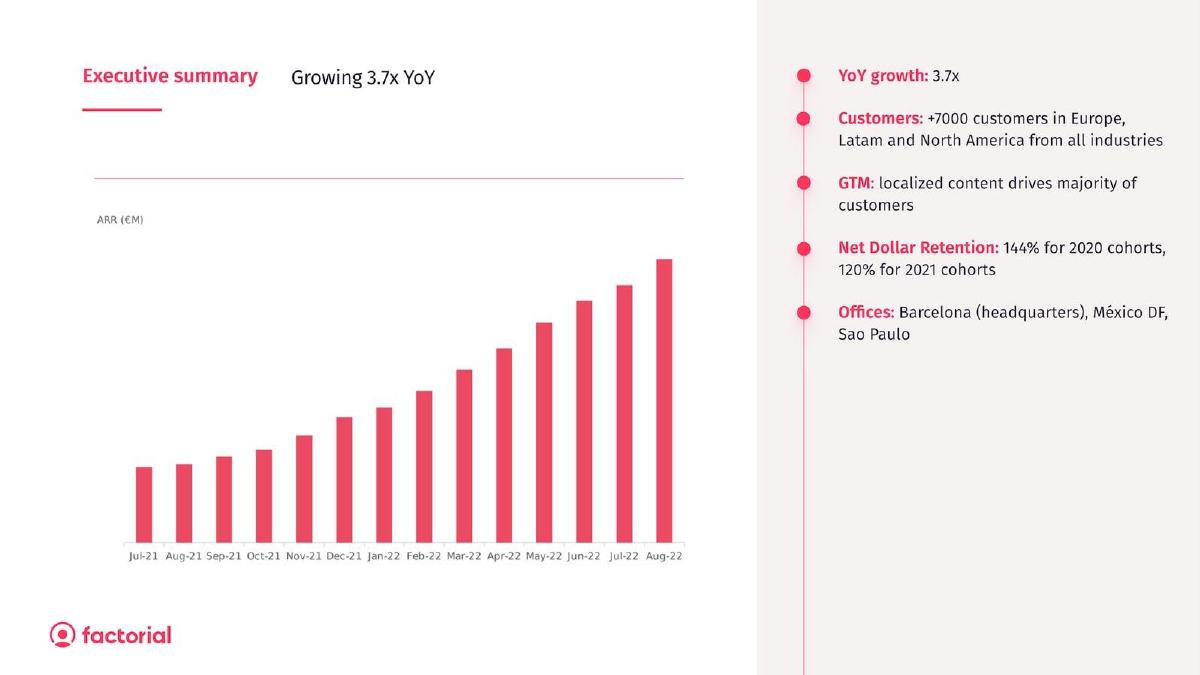
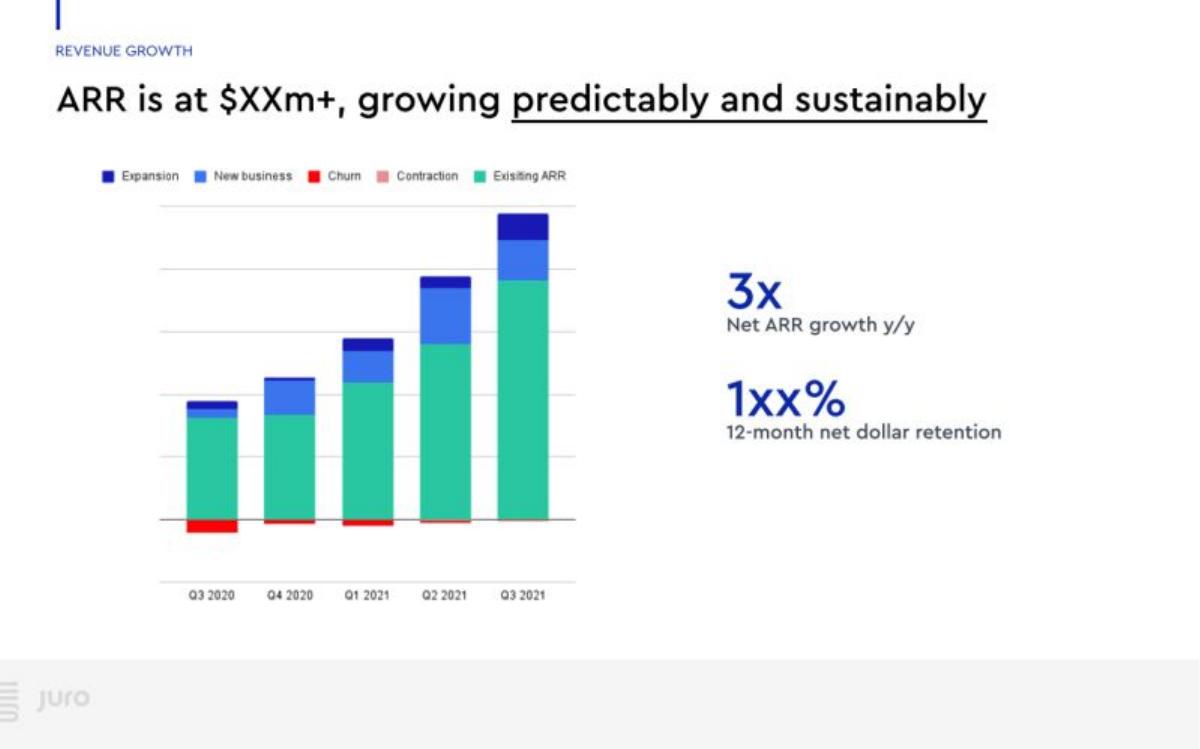
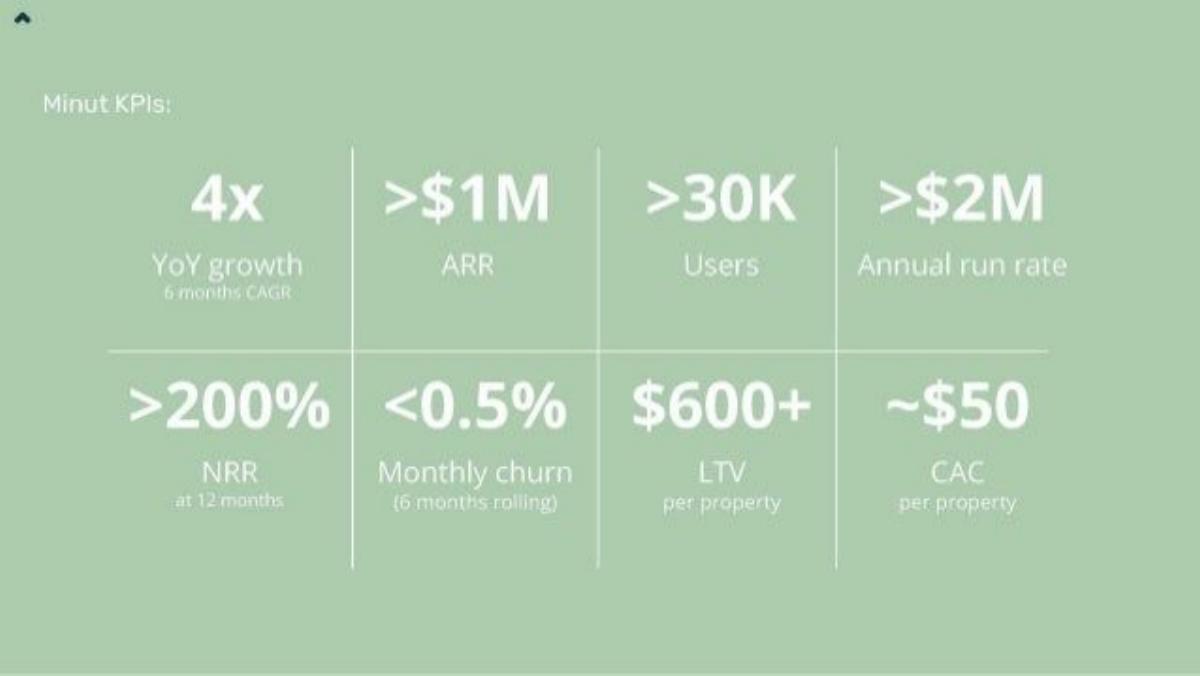
Show the figure with its definition, its period, the customer group it covers and the gross retention beside it. DoubleVerify prints 123% with a footnote stating which revenue is counted and what is excluded. Constructor shows three years of net retention (102.7%, 111%, 118.2%) beside gross retention (97.9%, 99.5%, 97.4%), which lets the reader see both measures together. Factorial gives separate figures for 2020 and 2021 customer cohorts (144% and 120%), and Honeycomb gives "177% at Year 1" and "255% at Year 2"; neither slide states the observation window or denominator. Juro shows the structure of a revenue bridge (expansion, new business, churn, contraction), but the published version blanks out the values. The weaker slides leave out information needed to assess the figure: KarmaCheck's 179% and Minut's ">200%" come without a definition or customer base, and their revenue figures need dates or scope labels to be reconciled; Contractbook's 110% has no definition or period; and AI Rudder says "high NRR" with no number.
Net revenue retention on real pitch deck slides
Each example shows the exact stored slide above its analysis and links to the full teardown. Stronger examples first. Figures are quoted as shown on the slides; we have not verified the calculations behind them, and the notes below describe presentation choices, not how any particular investor reacted.
DoubleVerify traction slide — slide 5
Digital advertising measurement software. A "by the numbers" grid of six figures from its 2021 investor presentation.
DoubleVerify deck, slide 5. Exact stored slide matched to this analysis.
Our analysis: One figure, one year, one written definition.
Evidence and limitation: The only slide in this set that defines the number on the slide: which customers, which revenue, and what is excluded.
What a founder can adapt: Write your definition in one footnote line: which cohort, which revenue, which periods and anything left out.
Supporting analysis
What the deck claims: "DoubleVerify by the Numbers: 2020 Stats." $244M revenue, 34% revenue growth, "123% Net Revenue Retention¹", $73M adjusted EBITDA, 30% margin. Footnote 1: "In-year revenue from prior year existing customers / prior year revenue from this subset of customers; excludes portion of unallocated programmatic revenue."
Presentation choice: The footnote answers the definition questions a reader would otherwise have to ask, and it discloses an exclusion rather than leaving it unstated.
When it does not fit: Keep the footnote readable; at this size it is barely legible on a projected slide.
E-commerce search software. A slide dedicated to retention, with two sets of bars for three fiscal years.
Constructor deck, slide 6. Exact stored slide matched to this analysis.
Our analysis: Paired gross and net figures over several years give more context than a single net figure.
Evidence and limitation: Three years of both measures. Reported gross retention moves between 97.4% and 99.5% while reported net retention rises. The slide does not say which customers left or expanded, or how either measure is defined.
What a founder can adapt: Show net and gross retention side by side for each year you have, defined the same way, and label any explanation of the change as your view.
Supporting analysis
What the deck claims: "We maintained best-in-class revenue retention metrics." Gross revenue retention: 97.9% (FY22), 99.5% (FY23), 97.4% (FY24). Net revenue retention: 102.7%, 111%, 118.2%. "NRR improvement driven by proving our value to our customers through initial deployments." Footnote: "FYE January 31st."
Presentation choice: Seeing gross retention beside net retention lets the reader separate revenue kept from revenue added through expansion, at the level the slide reports. The explanation for the improvement is the company's own; the figures shown do not independently confirm it.
When it does not fit: "Best-in-class" needs a named benchmark; the slide doesn't give one.
HR software for small businesses. An executive summary with a monthly ARR chart and five bullet points.
Factorial deck, slide 2. Exact stored slide matched to this analysis.
Our analysis: A cohort split rather than a single blended average.
Evidence and limitation: Separate figures for two starting-year cohorts. The slide does not state the observation window for each figure, the revenue base or how many customers each cohort contains.
What a founder can adapt: If you report NRR by cohort, give each cohort's observation window, revenue base and size.
Supporting analysis
What the deck claims: "Growing 3.7x YoY." "Net Dollar Retention: 144% for 2020 cohorts, 120% for 2021 cohorts." Also: "+7000 customers in Europe, Latam and North America," and an ARR (€M) bar chart from July 2021 to August 2022.
Presentation choice: Reporting by cohort shows the reader that the figure differs between customer groups. Without matched observation windows and definitions, the two numbers cannot be used to conclude that older customers expand more or that expansion continues in later years.
When it does not fit: Add a value scale to the ARR chart; its bars have no numbers.
Software observability tools. A three-panel summary slide (the third panel is redacted in the published deck).
Honeycomb deck, slide 2. Exact stored slide matched to this analysis.
Our analysis: Figures by customer age, presented beside the growth curve, whose meaning depends on a definition the slide omits.
Evidence and limitation: Two figures labelled by year, with no stated denominator or observation window. "255% at Year 2" could be measured against the cohort's revenue at the start of year 2 (an annual interval) or against its revenue at acquisition (cumulative); the slide does not say which.
What a founder can adapt: If you show NRR by customer age, state the baseline for each figure (start of that year or first-year revenue) and the number of customers in each group.
Supporting analysis
What the deck claims: "Honeycomb is the observability category king." "4 years and counting of 2x+ growth" over a revenue curve for 2020–2022. "NRR: 177% at Year 1, 255% at Year 2."
Presentation choice: Because the baseline is not stated, the 255% should not be read as a multiple of original revenue. Even with a stated baseline, a cohort-level figure describes the cohort's total revenue, not what each individual customer pays.
When it does not fit: Add a value scale to the growth curve; the chart has years but no revenue figures.
Contract management software. A revenue-growth slide with a quarterly stacked bar chart.
Juro deck, slide 6. Exact stored slide matched to this analysis.
Our analysis: The chart illustrates the structure of a revenue bridge, but without values it cannot be used to calculate NRR.
Evidence and limitation: The chart separates revenue into its components each quarter. In the published version the ARR and NRR values are blanked and the bars carry no values. We have not seen any other version of the deck.
What a founder can adapt: Chart each period's revenue as existing, expansion, new, contraction and churn with values, and state which cohort and period the NRR figure uses.
Supporting analysis
What the deck claims: "ARR is at $XXm+, growing predictably and sustainably." Bars from Q3 2020 to Q3 2021 split into expansion, new business, churn, contraction and existing ARR. "3x Net ARR growth y/y." "1xx% 12-month net dollar retention."
Presentation choice: A bridge can support an NRR figure only if it starts from a fixed customer cohort, excludes revenue from new customers and uses periods that match the NRR definition. With values and those conditions stated, a reader could check the figure; here only the layout can be seen.
When it does not fit: Unlabelled bars show direction but not size.
Noise and occupancy sensors for short-term rentals. A grid of eight KPIs.
Minut deck, slide 5. Exact stored slide matched to this analysis.
Our analysis: Well-labelled periods, with scope and date questions left open.
Evidence and limitation: Most figures carry a period label. ">$1M ARR" and ">$2M Annual run rate" are both lower bounds and may measure different things (for example, recurring revenue only versus all revenue), but the slide does not say what each includes or its date. The slide does not explain how "4x YoY growth" relates to "6 months CAGR". The NRR figure has no definition or customer base, and the churn figure is monthly while the NRR is 12-month.
What a founder can adapt: Keep the period labels, and add one line saying what each revenue figure includes and its date.
Supporting analysis
What the deck claims: "4x YoY growth (6 months CAGR)." ">$1M ARR." ">30K Users." ">$2M Annual run rate." ">200% NRR at 12 months." "<0.5% Monthly churn (6 months rolling)." "$600+ LTV per property." "~$50 CAC per property."
Presentation choice: A reader needs to know what each revenue figure covers and when it was measured to relate them to each other and to the 200%.
When it does not fit: Don't present a monthly churn rate as if it were comparable to an annual retention figure; state each on its own basis.
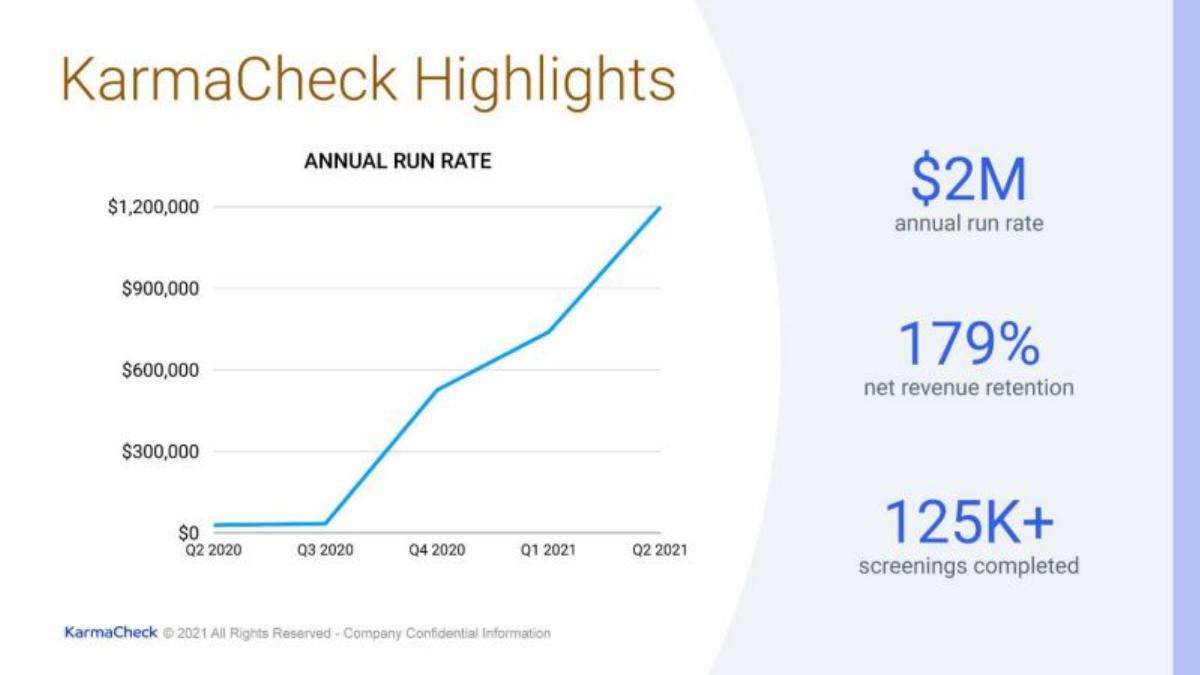
Background-check software. A highlights slide with an annual run rate chart and three headline figures.
KarmaCheck deck, slide 3. Exact stored slide matched to this analysis.
Our analysis: A retention figure presented without the inputs needed to assess it, beside revenue figures that need date labels to be reconciled.
Evidence and limitation: The chart ends at $1.2M in Q2 2021; the $2M headline is undated, so the two may refer to different dates. The 179% has no definition, period, cohort size or customer count.
What a founder can adapt: Date every headline figure, extend the chart to the latest date or label the gap, and give the NRR definition and cohort size.
Supporting analysis
What the deck claims: "KarmaCheck Highlights." Chart: "Annual run rate" from about $0 in Q2 2020 to $1.2M in Q2 2021. Headline figures: "$2M annual run rate," "179% net revenue retention," "125K+ screenings completed."
Presentation choice: The slide does not show how many customers the 179% covers, how the cohort was chosen or what drove the figure, so a reader cannot assess it from the slide alone.
When it does not fit: Don't leave a headline figure and a chart on the same slide without dates that let them be reconciled.
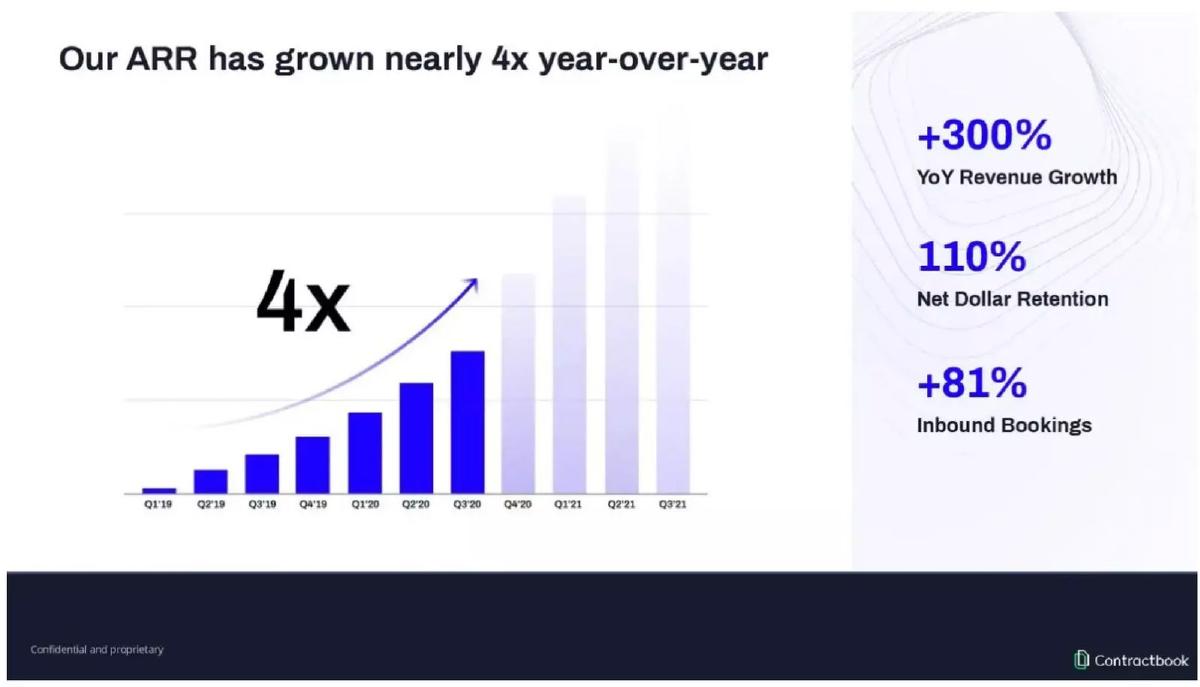
Contract management software. A growth slide with a quarterly bar chart and three figures on the right.
Contractbook deck, slide 6. Exact stored slide matched to this analysis.
Our analysis: A retention figure placed beside overall growth, without the details that would let the two be related.
Evidence and limitation: An NRR figure with no period, definition or gross retention. The chart has no values, and the faded bars aren't explained (they may be forecasts).
What a founder can adapt: If you want to show where growth came from, state the split directly, with the period and revenue base.
Supporting analysis
What the deck claims: "Our ARR has grown nearly 4x year-over-year." "+300% YoY Revenue Growth." "110% Net Dollar Retention." "+81% Inbound Bookings." Bars from Q1 2019 to Q3 2021, the last four faded.
Presentation choice: Working out how much of the growth came from existing versus new customers would need both figures on matching periods and revenue bases. The slide doesn't state these, so that split can't be derived from it.
When it does not fit: Label forecast bars as forecasts and add values to the chart.
Whether the figure comes with a definition, a stated denominator and observation window, more than one data point and gross revenue retention on the same basis.
Example
Figure shown
Definition
Denominator / window
Trend or cohorts
Gross revenue retention
DoubleVerify
123%
Yes (footnote)
Prior-year revenue of the same customers; 2020
No
No
Constructor
102.7% → 111% → 118.2%
No
Fiscal years stated; denominator not stated
Three years
97.9%, 99.5%, 97.4%
Factorial
144% / 120%
No
Not stated
By cohort (2020, 2021)
No
Honeycomb
177% / 255%
No
Not stated (annual or cumulative unclear)
By customer age
No
Juro
1xx% (blanked)
No
12 months; values blanked
Quarterly bridge (no values)
No (churn/contraction bars, no values)
Minut
>200%
No
12 months; denominator not stated
No
No (monthly churn <0.5% shown; not GRR)
KarmaCheck
179%
No
Not stated
No
No
Contractbook
110%
No
Not stated
No
No
AI Rudder
"High" (no figure)
No
No
No
No
Key Takeaways
Define it: which customer cohort, which revenue (ARR or recognised revenue), over which comparable periods.
Put gross revenue retention beside it, measured over the same period and cohort.
Give the denominator and observation window for every figure, especially cohort or "year 2" figures.
Label dates and scope on every revenue figure so readers can reconcile them.
A description such as "high NRR" without a number leaves the reader nothing to assess.
Write your retention line
Fill in each line before putting net revenue retention on a slide. Use the same cohort, periods and revenue base for every figure.
Figure. Your NRR for the latest full period, as a percentage.
Revenue base. ARR, subscription revenue or all recognised revenue; and anything excluded.
Cohort. Which customers are included (for example, all customers active 12 months before the end date) and roughly how many.
Denominator and window. The starting revenue you divide by and the dates of both measurements (for example, ARR on 30 June 2024 vs 30 June 2025). For figures by customer age, say whether each is measured against the previous year or the first year.
Gross revenue retention. The same calculation without expansion, on the same cohort, period and revenue base. Customer (logo) churn is a different measure; if you show it, label it separately and don't convert a monthly rate into an annual one.
History. Earlier periods or cohorts, each with its own window and definition.
Copyable framework: NRR [X]% ([revenue base] of customers active on [start date], measured on [end date]; excludes new customers). Gross revenue retention [Y]% (same cohort and period). [Earlier period, same definition]: [Z]%. Cohort: [N] customers.
Illustrative example 1 — written by us
Before: Land & expand: High net revenue retention (NRR) with big accounts.
After: NRR [X]% for our [N] largest accounts ([revenue base], [start date] to [end date]); gross revenue retention [Y]% on the same basis.
What improved: Our illustrative rewrite; not AI Rudder's wording. It replaces the adjective with the figure and states the cohort, period and revenue base. The bracketed values are placeholders, not AI Rudder's figures.
What this guide adds
The SaaS traction, Series B traction and unit economics guides mention retention and churn as part of a wider set of metrics. None explains how to present net revenue retention itself: what to put in the footnote, what to show beside it and which omissions make it hard to assess. This page covers that one metric.
Honeycomb's slide 2 (the observability company) is a different deck from the Honeycomb insurance deck used in the NPS guide.
What net revenue retention measures
Take a defined cohort of customers and the revenue (often ARR) they generated at the start of a period. At the end of a comparable period, measure the revenue from the same cohort, including expansion and net of contraction and churn. Revenue from customers who joined after the start is excluded. Divide the second figure by the first.
Above 100% means that measured cohort's revenue grew over that period. It does not by itself show that the whole company will grow, and it says nothing about profitability.
Gross revenue retention is the same calculation without expansion, so it cannot exceed 100%; it shows how much of the cohort's starting revenue was kept. It is not the same as customer (logo) churn, which counts customers rather than revenue, and a monthly churn rate cannot be swapped for an annual retention figure.
Definitions differ between companies
Companies choose the revenue base (ARR, subscription revenue or all recognised revenue), the period, how the cohort is fixed and what is excluded. For example, Braze's 2021 results release describes taking the ARR of a customer cohort 12 months before a period end, measuring the same cohort's ARR at period end (including expansion, net of contraction and attrition, excluding new customers), and averaging that ratio across month-ends in the trailing 12 months. Another company's figure may be calculated differently.
So two NRR figures are only comparable when their definitions are known. A slide that states its definition lets the reader judge the figure; a slide that doesn't leaves those questions open.
Common mistakes
No definition. Without the cohort, revenue base and period, the figure can't be compared with others or checked.
No gross revenue retention. A net figure alone doesn't show how much of the cohort's starting revenue was kept.
Undated revenue figures. A headline and a chart on the same slide need dates and scope labels so readers can reconcile them.
Unstated denominator. Figures such as "Year 2" NRR can mean an annual interval or a cumulative multiple; say which.
Mixing bases. Monthly customer churn, annual gross revenue retention and NRR are different measures; state each on its own basis.
Adjective instead of number. "High" or "best-in-class" without the figure gives the reader nothing to assess.
Diagnostic checklist
NRR figure with its cohort, revenue base and measurement dates.
One-line definition in a footnote.
Gross revenue retention on the same cohort, period and basis.
Denominator stated for cohort or customer-age figures.
Revenue figures on the slide dated and scoped so they can be reconciled.
Frequently asked questions
How we chose these examples
Corpus: published pitch deck teardowns on StartupFundraising.com. Founder-uploaded private decks are excluded.
Selection (2026-09-25): we searched stored slide text for "net revenue retention", "net dollar retention", "NRR", "NDR", "net retention" and "gross retention" and kept only slides with a stored slide image (about 40 slides), then inspected the images of the candidates. We kept slides where retention is a visible claim and each teaches a different presentation choice. Excluded: Paddle's three decks (they explain NDR as a vendor topic rather than report the company's own figure), Cloudsmith and Humaans (value redacted), Cerebrium and Skilljar (placeholders), CreatorDB (a plain one-line figure already covered by other examples), and slides where retention is one word in a paragraph (Muck Rack).
Figures are quoted as shown in the stored slide images. We have not verified any calculation behind them, and we do not infer definitions, denominators, cohort sizes or benchmarks that a slide does not state.
Definition variation: summarised from Braze's third-quarter fiscal 2022 results release (filed with the SEC, December 2021). We did not rely on other companies' filings.
Version 2 (2026-09-25) corrects version 1, which overstated what several slides show (Constructor, Factorial, Honeycomb, Juro, Minut, KarmaCheck, Contractbook) and generalised about very high NRR figures. Slides and selection are unchanged.
Review: stored slide text and images were checked on 2026-09-25 and matched to company, deck and slide number (editorial model review). No person has yet completed an editorial review of this page. We make no claim that any slide caused a fundraising outcome.