Traction Slide Examples: What Counts as Traction at Seed
How real seed decks showed traction: revenue, retention, pilots, usage and early signals when there is little revenue, with examples and mistakes to avoid.
Traction Slide Examples: What Counts as Traction at Seed
Compare ten real traction slides across software, consumer, public-sector, finance, and robotics businesses, plus three pilot slides, then choose the evidence that best fits your model and stage.
TL;DR
A traction slide should show the strongest real evidence that customers want the product, measured over a defined period and labeled precisely. These examples show how revenue growth, retention, usage, paid pilots, customer outcomes, and early commitments can each carry the argument without presenting pipeline or goals as achieved results.
Traction slides from real seed decks
Each example pairs the exact traction slide stored for that public teardown with analysis of the company's metric choice. Figures are company claims as shown on the slide; one unavailable exact image is recorded rather than replaced.
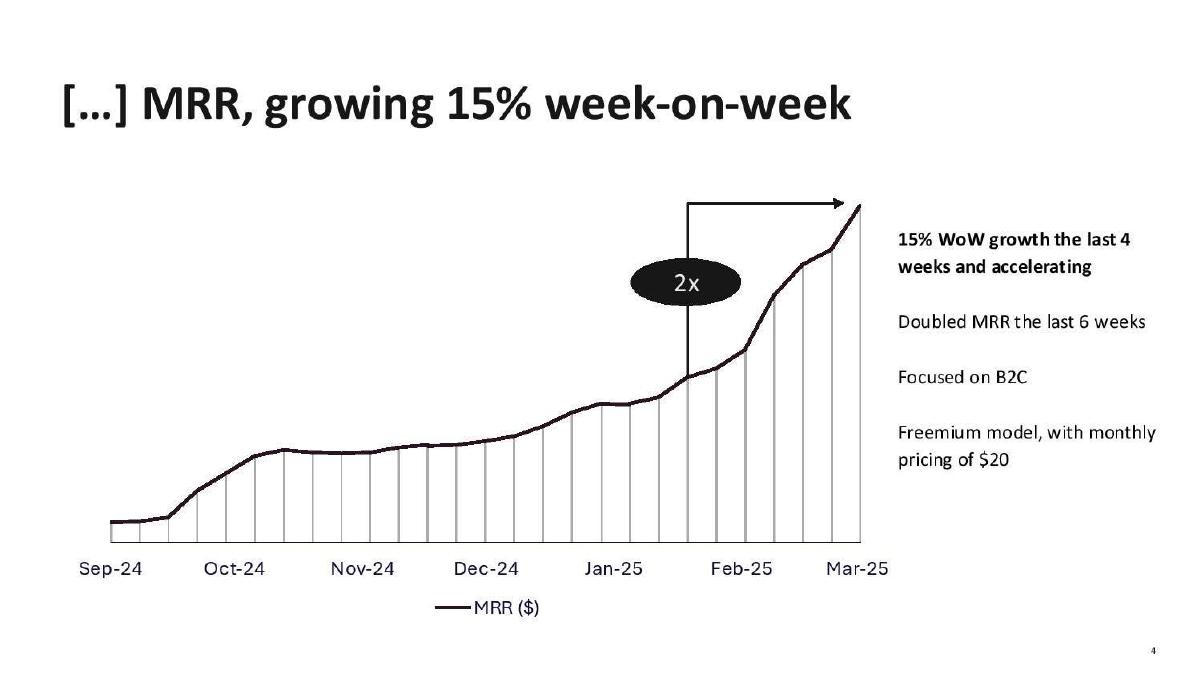
Alice.Tech traction slide — slide 4
Early-stage AI edtech deck (B2C freemium, about $20 a month).
Alice.Tech deck, slide 4. Exact stored slide matched to this analysis.
Our analysis: A small revenue base shown as a clearly defined growth rate over a defined window, with the pricing model beside it so the investor can reason about scale.
Evidence and limitation: Weekly growth rates on a very small base can swing sharply; show the underlying monthly values too.
What a founder can adapt: If your total is small, lead with the rate and the window, and put the price next to it.
Supporting analysis
What the deck claims: MRR growing 15% week-on-week over the last four weeks and accelerating; MRR doubled in the last six weeks; the pricing model stated alongside.
Presentation choice: A small revenue base shown as a clearly defined growth rate over a defined window, with the pricing model beside it so the investor can reason about scale.
When it does not fit: Weekly growth rates on a very small base can swing sharply; show the underlying monthly values too.
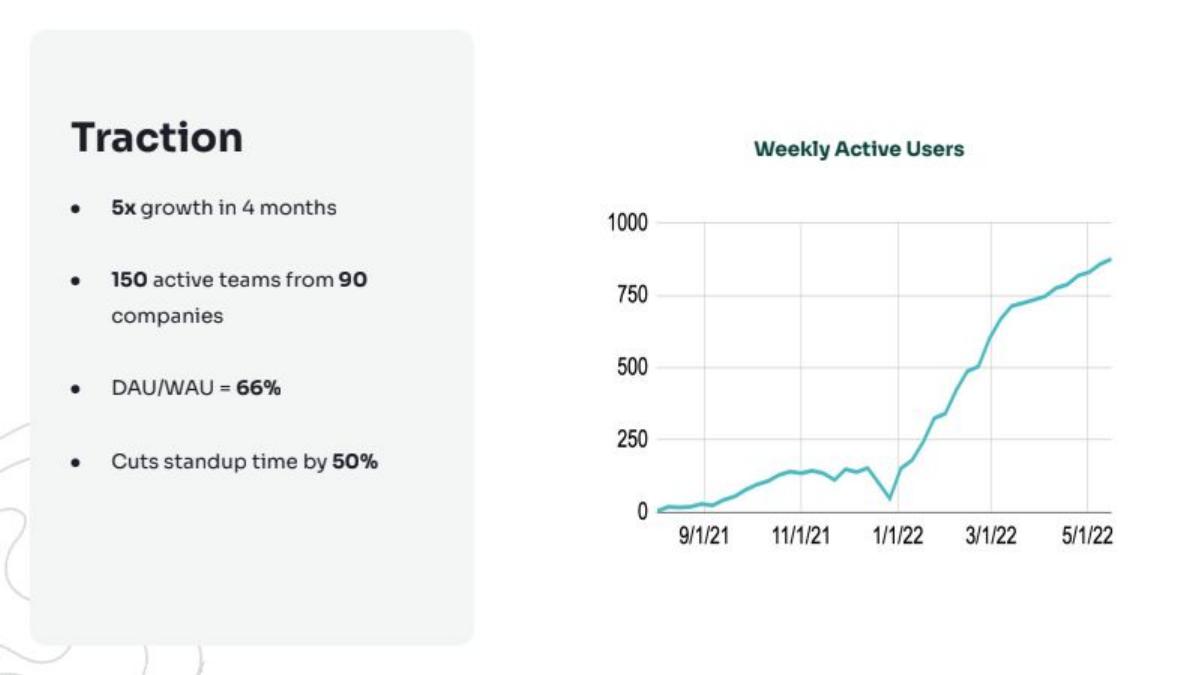
Spinach deck, slide 6. Exact stored slide matched to this analysis.
Our analysis: Growth and intensity side by side: the reader sees that users are arriving and that weekly users come back most days.
Evidence and limitation: Outcome claims such as "cuts stand-up time by 50%" need a stated source (customer survey, product data) or they read as marketing.
What a founder can adapt: Pair a growth number with an engagement ratio that shows the product is habitual.
Supporting analysis
What the deck claims: Weekly active users up about five times in four months, about 150 teams from 90 companies, a DAU/WAU of 66%, and the claim that it cuts stand-up time by half.
Presentation choice: Growth and intensity side by side: the reader sees that users are arriving and that weekly users come back most days.
When it does not fit: Outcome claims such as "cuts stand-up time by 50%" need a stated source (customer survey, product data) or they read as marketing.
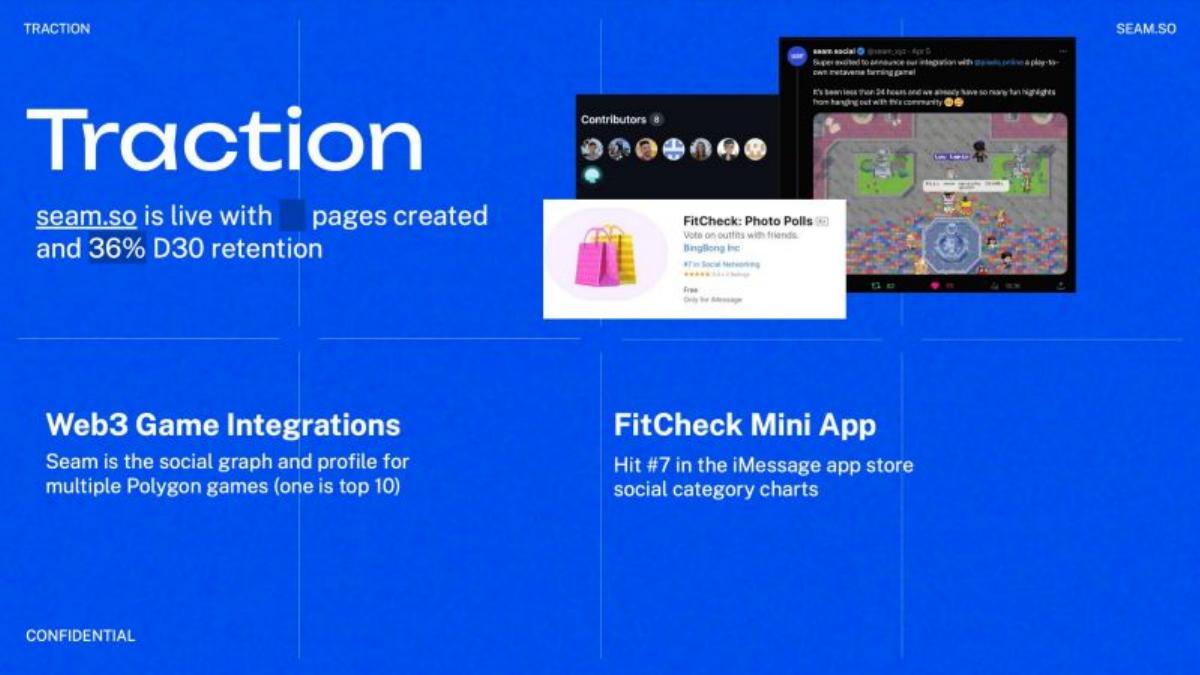
Seam Social deck, slide 5. Exact stored slide matched to this analysis.
Our analysis: Leads with 30-day retention, the behaviour metric consumer investors ask for first.
Evidence and limitation: Chart rankings are volatile; date them and do not let them replace the retention story.
What a founder can adapt: For a consumer product, put D30 (or D7) retention near the top and define the cohort.
Supporting analysis
What the deck claims: The product is live with pages created and 36% D30 retention; integrations with multiple Polygon games, one in the top ten; a mini app that reached #7 in its iMessage app store category.
Presentation choice: Leads with 30-day retention, the behaviour metric consumer investors ask for first.
When it does not fit: Chart rankings are volatile; date them and do not let them replace the retention story.
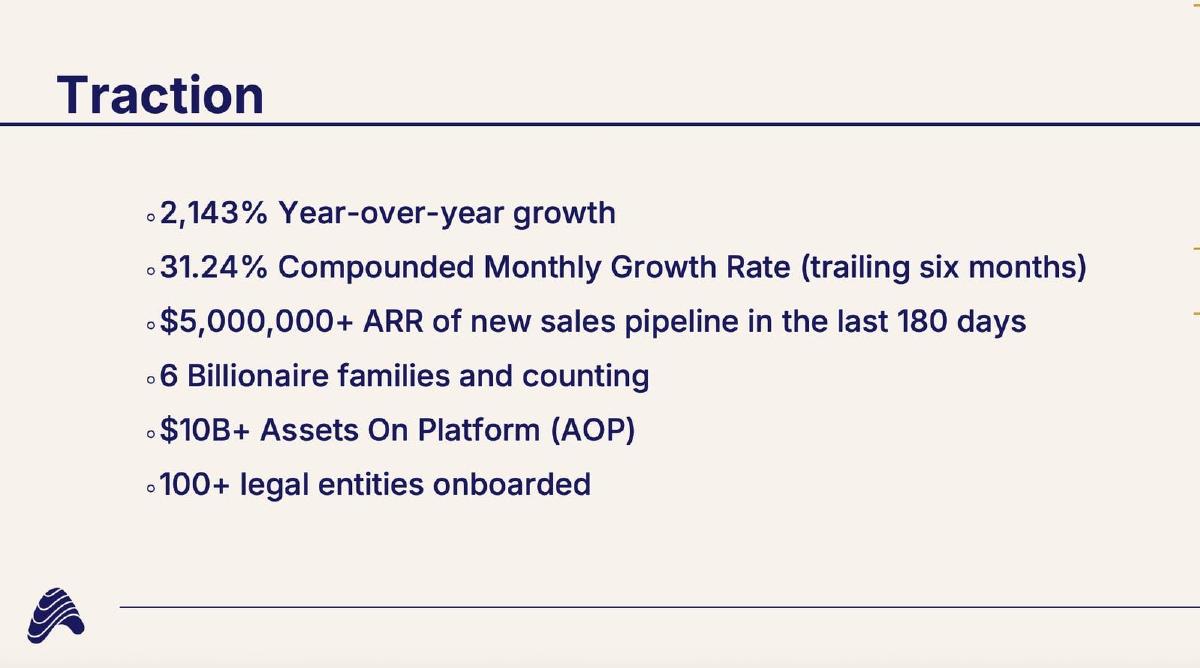
Asseta AI deck, slide 3. Exact stored slide matched to this analysis.
Our analysis: In a market with few, very large customers, customer quality and assets on the platform say more than user counts.
Evidence and limitation: Pipeline is not revenue. Label it clearly and do not let it sit where a revenue number would be expected.
What a founder can adapt: When each customer is large, show who they are (by type) and how much of their business runs on you.
Supporting analysis
What the deck claims: Year-over-year growth, a compounded monthly growth rate over six trailing months, more than $5M ARR of new sales pipeline in 180 days, six billionaire families, over $10B of assets on the platform and more than 100 legal entities onboarded.
Presentation choice: In a market with few, very large customers, customer quality and assets on the platform say more than user counts.
When it does not fit: Pipeline is not revenue. Label it clearly and do not let it sit where a revenue number would be expected.
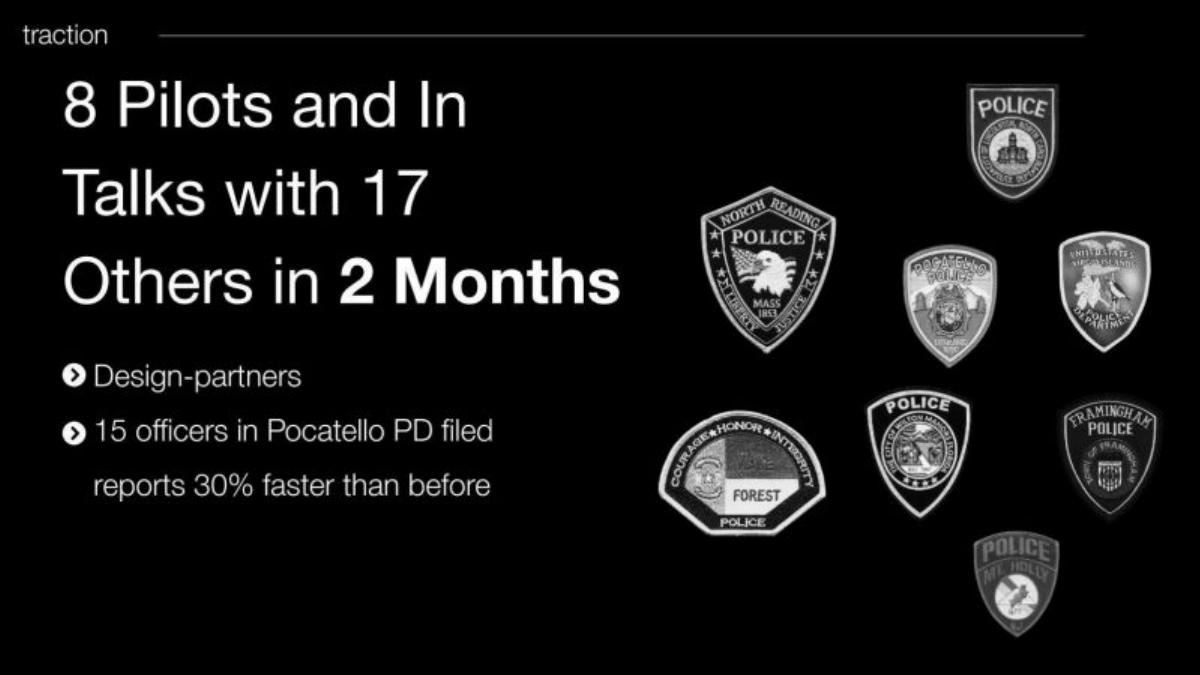
Code Four deck, slide 5. Exact stored slide matched to this analysis.
Our analysis: Public-sector sales are slow, so pilots within two months plus a measured outcome at one customer is a strong early signal.
Evidence and limitation: Say whether pilots are paid and when they convert; otherwise investors will assume they are free.
What a founder can adapt: Separate signed pilots from conversations and attach one measured customer outcome.
Supporting analysis
What the deck claims: Eight pilots and active talks with seventeen more departments within two months; design partners; officers in one police department filing reports 30% faster than before.
Presentation choice: Public-sector sales are slow, so pilots within two months plus a measured outcome at one customer is a strong early signal.
When it does not fit: Say whether pilots are paid and when they convert; otherwise investors will assume they are free.
In twelve weeks: first five paying customers, more than thirty in-depth research interviews, a pipeline developed through referrals and word of mouth; customer logos redacted.
The exact traction image is not present in the stored slide-image set. No substitute is used.
Our analysis: Honest, specific early traction with a clear time frame. Nothing is inflated.
Evidence and limitation: Interviews are research, not demand. Keep them secondary to paying customers.
What a founder can adapt: If you are very early, count paying customers and interviews precisely and state the weeks since launch.
Supporting analysis
What the deck claims: In twelve weeks: first five paying customers, more than thirty in-depth research interviews, a pipeline developed through referrals and word of mouth; customer logos redacted.
Presentation choice: Honest, specific early traction with a clear time frame. Nothing is inflated.
When it does not fit: Interviews are research, not demand. Keep them secondary to paying customers.
Robotics deck built around a chronological roadmap to a large seed round.
RIVR Robotics deck, slide 4. Exact stored slide matched to this analysis.
Our analysis: For hardware, paid pilots, reliability and certification are the milestones investors expect before orders.
Evidence and limitation: Name what an LOI commits the customer to; LOIs vary from binding to purely symbolic.
What a founder can adapt: Show traction as milestones on a timeline when your product needs certification or hardware iterations.
Supporting analysis
What the deck claims: For 2022–2023: three or more paid pilot programmes, improved reliability, letters of intent, a second hardware generation and certifications.
Presentation choice: For hardware, paid pilots, reliability and certification are the milestones investors expect before orders.
When it does not fit: Name what an LOI commits the customer to; LOIs vary from binding to purely symbolic.
Early pay-as-you-go computer access deck for low-income markets; the deck is undated.
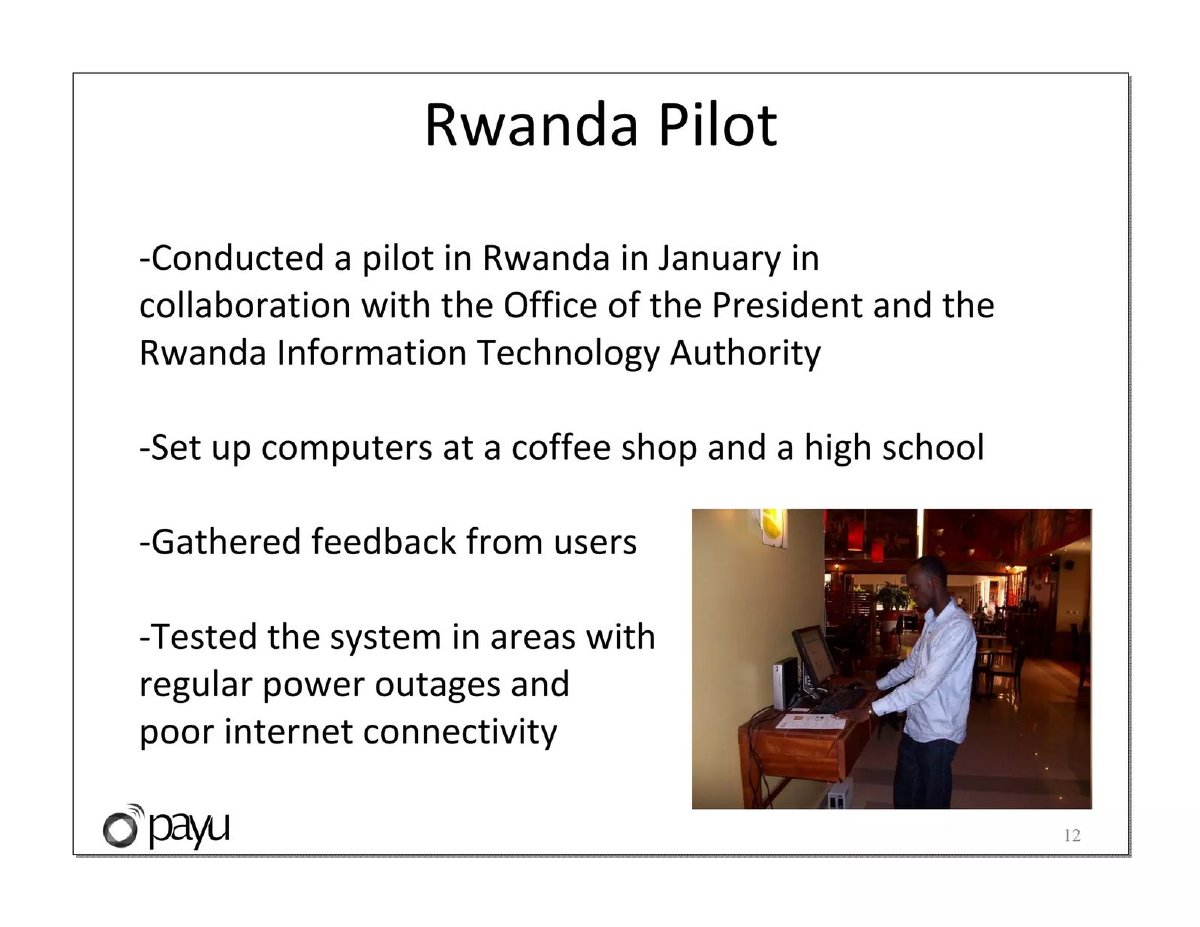
PayU deck, slide 12. Exact stored slide matched to this analysis.
Our analysis: It states the conditions the pilot was designed to test, which are the conditions its target market really faces.
Evidence and limitation: The slide reports no result. Official partners show access, not success; add what the feedback and tests actually found.
What a founder can adapt: Name the hardest conditions your pilot tested, the sites and the dates.
Supporting analysis
What the deck claims: A January pilot in Rwanda with the Office of the President and the Rwanda Information Technology Authority: computers at a coffee shop and a high school, user feedback gathered, the system tested in areas with regular power outages and poor internet.
Presentation choice: It states the conditions the pilot was designed to test, which are the conditions its target market really faces.
When it does not fit: The slide reports no result. Official partners show access, not success; add what the feedback and tests actually found.
Construction-supply ordering software (Stagistics) sold through building-supply distributors, 2015 pilot.
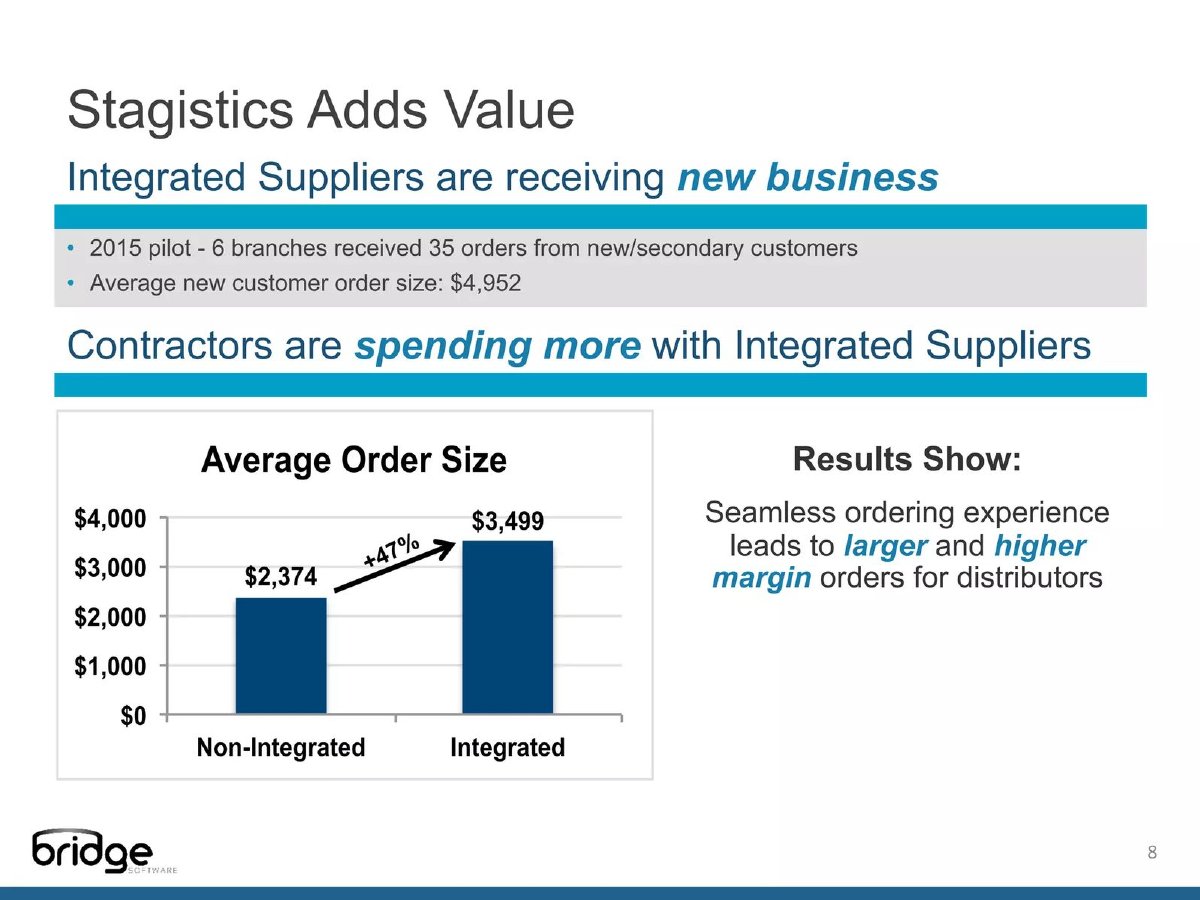
Bridge Software deck, slide 8. Exact stored slide matched to this analysis.
Our analysis: The pilot line has a scope, a period and a measured outcome tied to what the distributor cares about: new customers and order value.
Evidence and limitation: Say whether the comparison chart comes from the pilot, and give a pre-pilot baseline; without one, the orders show activity, not an effect caused by the product.
What a founder can adapt: Report the pilot's outcome in the customer's own terms, with its scope and period.
Supporting analysis
What the deck claims: "2015 pilot - 6 branches received 35 orders from new/secondary customers"; "Average new customer order size: $4,952"; a chart of average order size, $2,374 non-integrated vs $3,499 integrated, labelled +47%.
Presentation choice: The pilot line has a scope, a period and a measured outcome tied to what the distributor cares about: new customers and order value.
When it does not fit: Say whether the comparison chart comes from the pilot, and give a pre-pilot baseline; without one, the orders show activity, not an effect caused by the product.
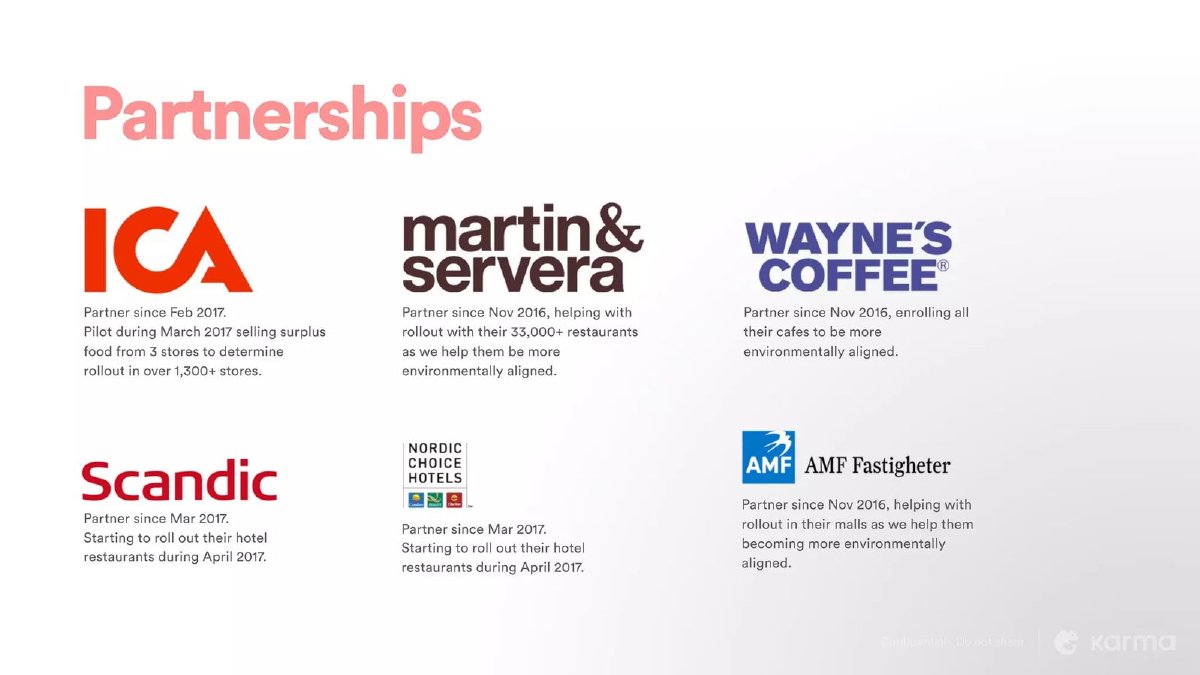
Karma deck, slide 8. Exact stored slide matched to this analysis.
Our analysis: It names the decision the pilot feeds: three stores now, a possible rollout to more than 1,300.
Evidence and limitation: Add the result that would trigger the rollout, and the outcome once known. A possible rollout is not a contract.
What a founder can adapt: State the customer's decision after the pilot and the size of the rollout it could unlock.
Supporting analysis
What the deck claims: ICA: "Partner since Feb 2017. Pilot during March 2017 selling surplus food from 3 stores to determine rollout in over 1,300+ stores." Other partners are described as rolling out or helping with rollout.
Presentation choice: It names the decision the pilot feeds: three stores now, a possible rollout to more than 1,300.
When it does not fit: Add the result that would trigger the rollout, and the outcome once known. A possible rollout is not a contract.
AI infrastructure deck, published with figures redacted.
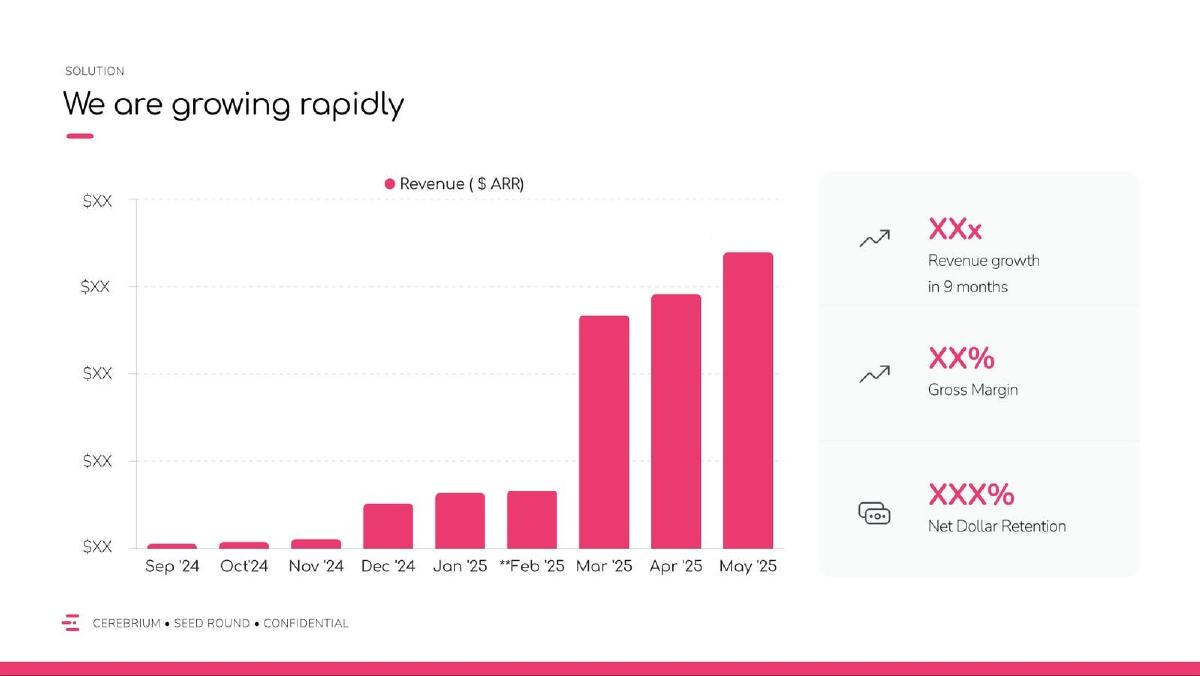
Cerebrium deck, slide 3. Exact stored slide matched to this analysis.
Our analysis: The layout shows which four metrics an infrastructure company chose: revenue, growth, margin and retention.
Evidence and limitation: Do not send investors a version with blanks. Use ranges you can defend if you must hold back exact figures.
What a founder can adapt: Use the structure; fill it with your own defined, dated numbers.
Supporting analysis
What the deck claims: Headline "We are growing rapidly" with ARR, revenue growth over nine months, gross margin and net dollar retention, all shown as placeholders.
Presentation choice: The layout shows which four metrics an infrastructure company chose: revenue, growth, margin and retention.
When it does not fit: Do not send investors a version with blanks. Use ranges you can defend if you must hold back exact figures.
A starting point for choosing the hero metric. Your own business model should decide.
Business type
Strong hero metric
Useful supporting fact
Example in this guide
Consumer app
Retention (D7/D30) or daily use
Growth rate over a defined window
Seam Social; Spinach
B2B SaaS
Revenue (MRR/ARR) and growth
Retention or margin
Alice.Tech; Synder; Careerist
Large-ticket B2B / finance
Named customer types and assets or volume
Pipeline, clearly labelled
Asseta AI
Public sector / enterprise pilots
Signed and paid pilots
One measured customer outcome
Code Four
Hardware / robotics
Paid pilots and conversion to orders
Certification and reliability milestones
RIVR Robotics
Very early (first months)
Paying customers and weeks since launch
Research interviews, referrals
Fifth Dimension AI
Key Takeaways
Choose one hero metric that fits the business. Seam Social leads with D30 retention, while Alice.Tech leads with recurring-revenue growth; neither metric should be copied into a model where it does not indicate customer pull.
Pair growth with evidence of quality. Spinach adds engagement intensity, Careerist adds profitability, and Synder adds longer-window retention so the headline is not just acquisition.
Label commitment levels honestly. Code Four separates pilots from active talks, RIVR distinguishes paid pilots from letters of intent, and Asseta AI identifies pipeline rather than presenting it as revenue.
Small, dated facts beat inflated totals. Fifth Dimension AI's five paying customers in twelve weeks is useful because the stage and time window are explicit.
Build your traction slide
Start with the strongest observed signal, then add only the context needed to interpret it.
Hero metric. Choose the single customer-behavior or revenue measure that best demonstrates demand.
Definition. Define exactly what counts, the cohort or denominator, and the measurement date.
Trend. Show the weekly or monthly series without smoothing away setbacks.
Support. Add up to three facts that test quality: retention, margin, paid status, conversion, or customer outcome.
Copyable framework: [Hero metric] changed from [starting value] to [current value] during [period], defined as [definition]. Supporting evidence: [quality signal].
Illustrative example 1 — written by us
Before: Strong customer traction
After: Eight paid pilots signed in two months; three converted to annual contracts by 31 August
What improved: The rewrite defines commitment, time, and conversion instead of asking the reader to trust an adjective.
What investors read a traction slide for
An investor reads the traction slide to answer one question: is there evidence, outside the founders' own belief, that this is working? Everything on the slide should serve that question. A number is persuasive when it is hard to fake, when it is measured over time, and when it is the number that actually matters for this business model.
That is why the right metric depends on the business. A consumer app should usually show engagement and retention; a B2B software company, revenue or signed customers and how they renew; a marketplace, transaction volume and repeat use on both sides; a hardware company, paid pilots and conversion into orders. Choosing the wrong metric is worse than showing a small one, because it tells the investor you do not know what drives your own business.
Sequoia's pitching guide does not include a separate traction section — it folds evidence into the problem, solution and business model story. That is a useful reminder: traction is not decoration for the end of the deck. It is proof for the claims you made on the earlier slides. (Sequoia Capital)
What counts as traction at seed
Revenue and its growth rate. If you have revenue, show it, and show how fast it is growing. Alice.Tech's slide leads with monthly recurring revenue "growing 15% week-on-week" and "doubled MRR the last 6 weeks": a small base, but a clearly stated rate over a defined period.
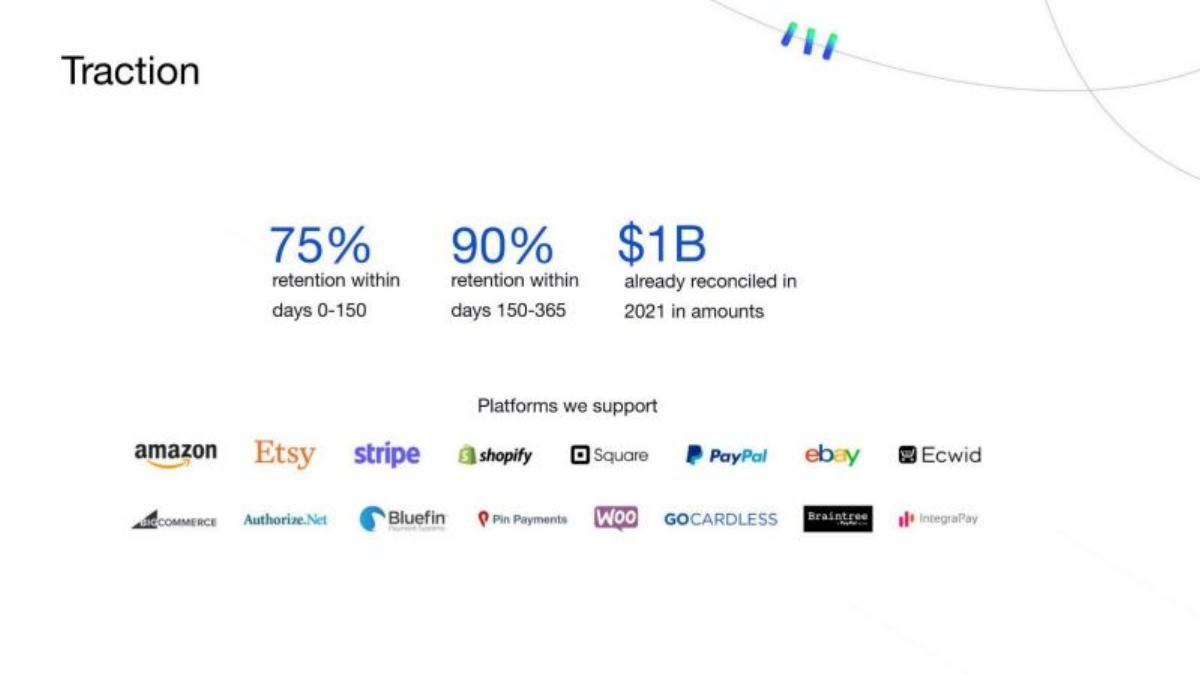
Retention and repeat use. Retention is often more convincing than growth because it is harder to buy. Seam Social's traction slide states "36% D30 retention"; Synder's shows retention in two time windows (days 0–150 and days 150–365). A retention figure tells the investor that users who arrive stay.
Usage intensity. Spinach showed weekly active users growing about five times in four months, alongside a DAU/WAU ratio of 66% — a measure of how often weekly users come back daily. A ratio like that is useful because it is independent of how much the company spent to acquire users.
Paid pilots, agreements and design partners. For B2B, hardware and public-sector companies, early traction often looks like signed pilots. Code Four's deck lists eight pilots and active talks with seventeen other departments within two months; RIVR Robotics described three or more paid pilot programmes and letters of intent. Be precise about what is signed, what is paid and what is still a conversation.
Pipeline and assets on platform. Asseta AI listed year-over-year growth, a monthly growth rate over six trailing months, more than $5 million of new sales pipeline in 180 days, six billionaire families and over $10 billion of assets on the platform. Pipeline is weaker evidence than revenue, but combined with named customer types it shows demand in a market where each customer is large.
Early qualitative signals. Fifth Dimension AI, twelve weeks in, reported its first five paying customers, more than thirty in-depth research interviews and a pipeline built through referrals. That is honest early traction: small, specific and credible.
Presenting a pilot: what it tested, what it showed, what happens next
Calling a pilot paid or signed tells investors how committed the customer is. It does not tell them what the pilot proved. A pilot slide is more convincing when it answers five questions: what the pilot was meant to test, where and with whom it ran, when it ran, what was measured, and what the customer decides once it ends.
Test conditions. PayU's "Rwanda Pilot" slide (slide 12) says the company ran a pilot "in January" with the Office of the President and the Rwanda Information Technology Authority, set up computers "at a coffee shop and a high school", "gathered feedback from users" and "tested the system in areas with regular power outages and poor internet connectivity". The slide makes clear what the pilot was designed to stress. It reports no result, and the partners' names alone do not show the pilot succeeded.
A measured result. Bridge Software's slide 8 reports: "2015 pilot - 6 branches received 35 orders from new/secondary customers" and "Average new customer order size: $4,952". A separate chart on the same slide shows an average order size of $2,374 for non-integrated suppliers and $3,499 for integrated ones, labelled "+47%". The pilot line gives a scope (six branches), a period (2015) and an outcome (orders from new customers). The slide doesn't say whether the chart comes from the same pilot, and it gives no before-pilot baseline, so the pilot figures show activity but don't prove the product caused it.
The decision the pilot feeds. Karma's partnerships slide (slide 8) describes ICA as a "Partner since Feb 2017" with a "Pilot during March 2017 selling surplus food from 3 stores to determine rollout in over 1,300+ stores". That line names the customer's decision: three stores now, a possible rollout to more than 1,300 stores later. It doesn't state what result would trigger the rollout, and the slide gives no outcome.
None of these three slides states a success criterion in advance, meaning the number that would count as a pass. That is the most common gap. If you have agreed one with the customer, put it on the slide; if the pilot has ended, show the result against that threshold and say what happened next: a contract, a rollout, a renewal, or nothing yet.
Template: "[Pilot] with [customer], [dates]. Tested: [question]. Success = [metric ≥ threshold] by [date]. Result: [measured outcome] (as of [date]). Next: [contract / rollout to N sites / renewal] — [status]." Leave any field blank that you can't yet fill honestly rather than implying a result.
Choose one hero metric, then support it
Look at your business model and ask which single number, if it kept moving the way it is, would make the company valuable. That is the hero metric. Put it at the top of the slide, as a chart over time if you have more than a few data points, and label exactly what it measures.
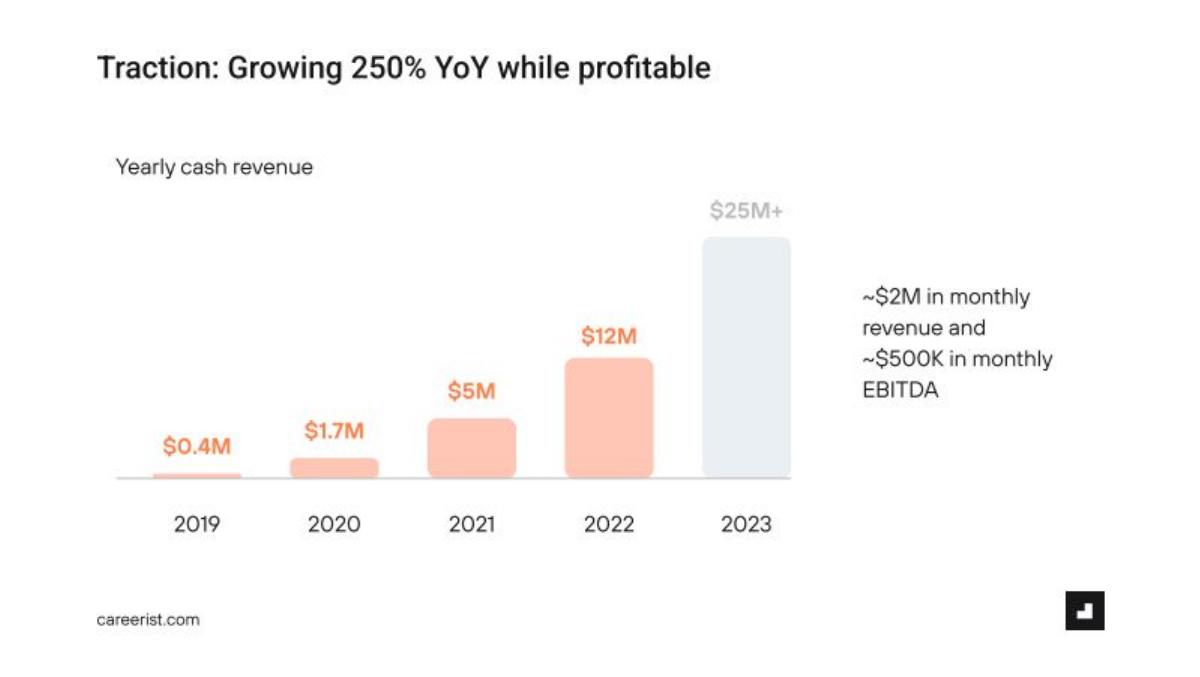
Then add no more than two or three supporting facts that make the hero metric more believable: retention next to growth, margin next to revenue, conversion next to pilots. Careerist's traction slide pairs growth ("Growing 250% YoY") with "while profitable", which answers the obvious follow-up question about how the growth was bought.
Everything else — press mentions, awards, accelerator acceptances, competition results — belongs elsewhere, if anywhere. Limis's traction slide listed meetings with a potential customer, an agreement to test the product and two start-up competition placements. Only the agreement to test is traction in the investor's sense; competitions show the team can present, not that customers want the product.
Showing traction when revenue is small or zero
Many seed companies have little revenue. That is normal, and pretending otherwise damages trust. Instead, show the evidence you do have and make its quality obvious.
Rate beats size. A small number growing quickly over a defined window is more interesting than a larger number with no time frame. State the window ("the last 4 weeks", "since launch in March").
Commitment beats interest. Paid pilots beat free pilots; signed letters of intent beat verbal interest; a waitlist with a conversion rate beats a waitlist total. If you show a waitlist, say how many people converted when you invited them.
Behaviour beats opinion. Retention, repeat purchase and daily use show what users do. Survey scores and testimonials show what users say. Both have a place, but put behaviour first.
Specific beats impressive. "First five paying customers in twelve weeks" is more credible than a vague reference to "strong demand from leading enterprises".
How traction slides change from pre-seed to Series A
At pre-seed, traction is often a prototype, pilot users and a handful of committed customers. The slide should make the next milestone obvious: what the round will turn these early signals into.
At seed, investors expect a first repeatable signal: revenue or usage growing on a steady rate, early retention, or pilots converting into paid contracts. This is where the hero-metric discipline matters most.
By Series A, the question moves from "do people want it?" to "is this a repeatable business?" Retention cohorts, revenue growth by month, net revenue retention and payback period start to replace single headline numbers. If you already have that data at seed and it is strong, showing it early saves a round of diligence questions.
Redacted numbers and placeholders
Some decks in our corpus appear with figures replaced by placeholders. Cerebrium's traction slide, as published, shows revenue, growth, gross margin and net dollar retention as "$XX" and "XX%", and the Scalestack deck shows revenue as "~$XXXK". These were most likely redacted before the deck was shared publicly, which is common and reasonable.
The lesson for your own deck is about structure, not secrecy: Cerebrium's layout shows which metrics a Series A-minded infrastructure company chose to lead with (revenue, growth, margin, retention). If you share a redacted version with early contacts, keep the structure and replace numbers with ranges you are willing to defend rather than blanks, so the reader can still judge the story.
How to build the slide
Start from your data, not from a template. Export the hero metric by week or month since you started tracking it, and chart it without smoothing. If there is a dip, keep it and explain it in one line; investors trust a real curve with a dent more than a perfect one.
Label every number with its definition and its date. "MRR" means different things in different companies; "active user" means even more. A short footnote ("Active = at least one meeting summarised in the week") removes a whole category of follow-up questions.
Finally, check the slide against your ask. If the round is meant to take you from eight pilots to twenty paid contracts, the traction slide should show the eight and the conversion so far. The traction and ask slides should read as the start and the end of the same line.
Common mistakes
Too many metrics. Five charts on one slide dilute the one that matters. Pick a hero metric and at most three supporting facts.
Totals without time frames. "10,000 users" says nothing without when and how fast. Always state the window.
Goals presented as results. Targets belong on the ask or roadmap slide. Mixing plans and results erodes trust in both.
Awards and competitions as traction. They show presentation skill, not customer demand. Move them elsewhere or remove them.
Undefined terms. Define "active", "MRR" and "retention" in a footnote so investors can compare you fairly.
Pipeline in the revenue position. Pipeline and letters of intent are weaker than revenue. Label them honestly.
Blank placeholders. A slide full of "$XX" leaves the investor with nothing to judge. Use defensible ranges instead.
A pilot with no test or result. Naming a pilot partner shows access. Say what the pilot tested, what counted as success, what it measured and what the customer decided next.
Diagnostic checklist
One hero metric chosen for this business model, at the top of the slide.
The metric is shown over time with the window stated.
Every number is defined and dated.
No more than three supporting facts, each making the hero metric more believable.
Signed, paid and in-discussion are clearly separated.
Each pilot states what it tested, its success threshold, its result so far and the next commercial step.
Goals and forecasts are not on this slide.
The traction slide connects to what the round will fund.
Frequently asked questions
What counts as traction for a seed-stage startup?
Any hard-to-fake evidence that customers want the product: revenue and its growth, retention, repeat use, paid pilots, signed agreements, or rapid early growth over a defined period. Revenue is not required at seed if the other evidence is strong.
What if I have no revenue yet?
Show the strongest behaviour you have — retention, daily use, pilot conversion, paying early customers — and emphasise the rate of change over a defined window. Be specific and do not inflate.
How many metrics should a traction slide have?
One hero metric plus two or three supporting facts is enough. More than that usually hides the signal.
Should I show retention on my seed deck?
If it is strong, yes. Retention is harder to buy than growth and is often the first thing consumer and SaaS investors ask about.
Are letters of intent traction?
They can be, but they are weaker than revenue or paid pilots. Say what each letter commits the customer to and label them separately.
Where should the traction slide go in the deck?
Wherever it proves your earlier claims best. If traction is your strongest asset, it can come early, right after the problem and solution.
How we chose these examples
Corpus: published pitch deck teardowns on StartupFundraising.com. Founder-uploaded private decks are excluded entirely.
Classifier check: we reviewed 40 slides from seed-stage decks that our automatic classifier labelled "traction" with high confidence (most recent first). By our editorial model's reading, only 9 of the 40 were actually traction slides; the rest were market, team, product, problem or competition slides. This was model review of a small sample, not a human-reviewed accuracy measurement, but it was enough to stop us using the traction label to select examples.
Selection: instead, we searched the extracted text of seed and pre-seed decks for slides that use the word "traction" together with a customer or revenue metric, read 45 matching slides, and added examples found in the classifier sample. Ten examples were chosen for clarity and variety of business model.
Review: examples were selected and described by our editorial model from the extracted slide text and checked against that text. No person has yet reviewed these examples for this page.
Figures quoted are the companies' own claims as shown on their slides. We have not independently verified them.
We make no claim that any traction slide caused a fundraising outcome.
Pilot section (added 2026-09-28): PayU slide 12, Bridge Software slide 8 and Karma slide 8 were found by searching extracted slide text across the library for pilots with test conditions, results or follow-on decisions. Our editorial model checked every quoted figure and phrase against the original slide images. No person has reviewed this section. We have not verified whether any of these pilots led to a contract or rollout.