How consumer product brands show retail traction in a pitch deck: store count, sales velocity, reorders and channel mix. Seven real slides compared.
Consumer Product Traction Slide: Retail Examples
Seven traction slides from consumer product brands, shown in full, compare how they present retail progress: whether they show where the product is stocked, or whether it actually sells once it's there.
TL;DR
Retail buyers and investors care less about how many stores carry a product than whether it sells off the shelf. The strongest slide below, Chamberlain Coffee's, shows units per store per week against competitors at Target, using named third-party data. Selecty shows a store trial that passed a retailer's sales threshold before expanding. Weaker slides list retailers (Bagito) or channels (Related Garments) with no sales figures. Show where you're stocked, how fast it sells per store, and whether the retailer reordered or expanded.
Consumer product traction slides from real pitch decks
Each example shows the exact stored slide above its analysis and links to the full teardown. Figures are as shown on the slides; we have not verified them. Stage and year are given only where the slide or deck states them.
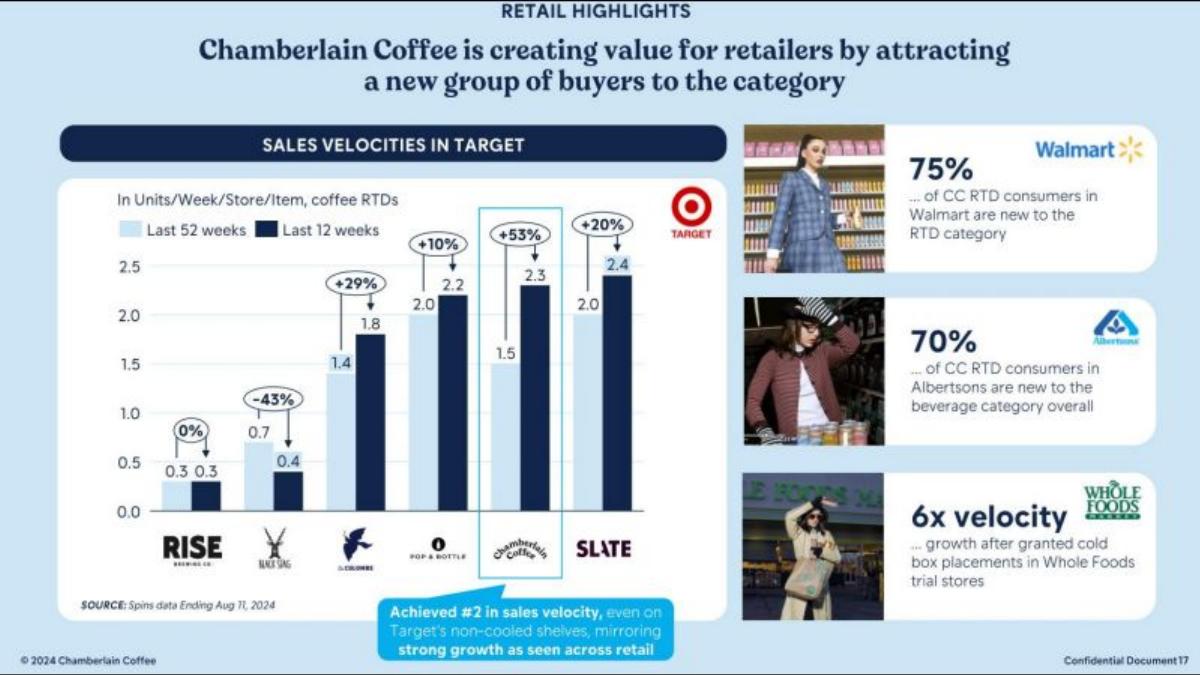
Chamberlain Coffee deck, slide 5. Exact stored slide matched to this analysis.
Our analysis: It uses the retail buyer's own measure, compares against named competitors, dates the data and shows the brand brings new shoppers to the aisle.
Evidence and limitation: Four retailers and three different measures on one slide is dense. Lead with the Target chart.
What a founder can adapt: Show units per store per week against the category leaders, with the data source and date.
Supporting analysis
What the deck claims: "Retail highlights — Chamberlain Coffee is creating value for retailers by attracting a new group of buyers to the category." A chart, "Sales velocities in Target" (units/week/store/item, coffee ready-to-drink), comparing last 52 weeks with last 12 weeks for Chamberlain and five named competitors; Chamberlain's rises to 2.3 (+53%). "Achieved #2 in sales velocity, even on Target's non-cooled shelves." Side panels: "75% of CC RTD consumers in Walmart are new to the RTD category"; "70% of CC RTD consumers in Albertsons are new to the beverage category overall"; "6x velocity growth after granted cold box placements in Whole Foods trial stores". Source: SPINS data.
Presentation choice: It uses the retail buyer's own measure, compares against named competitors, dates the data and shows the brand brings new shoppers to the aisle.
When it does not fit: Four retailers and three different measures on one slide is dense. Lead with the Target chart.
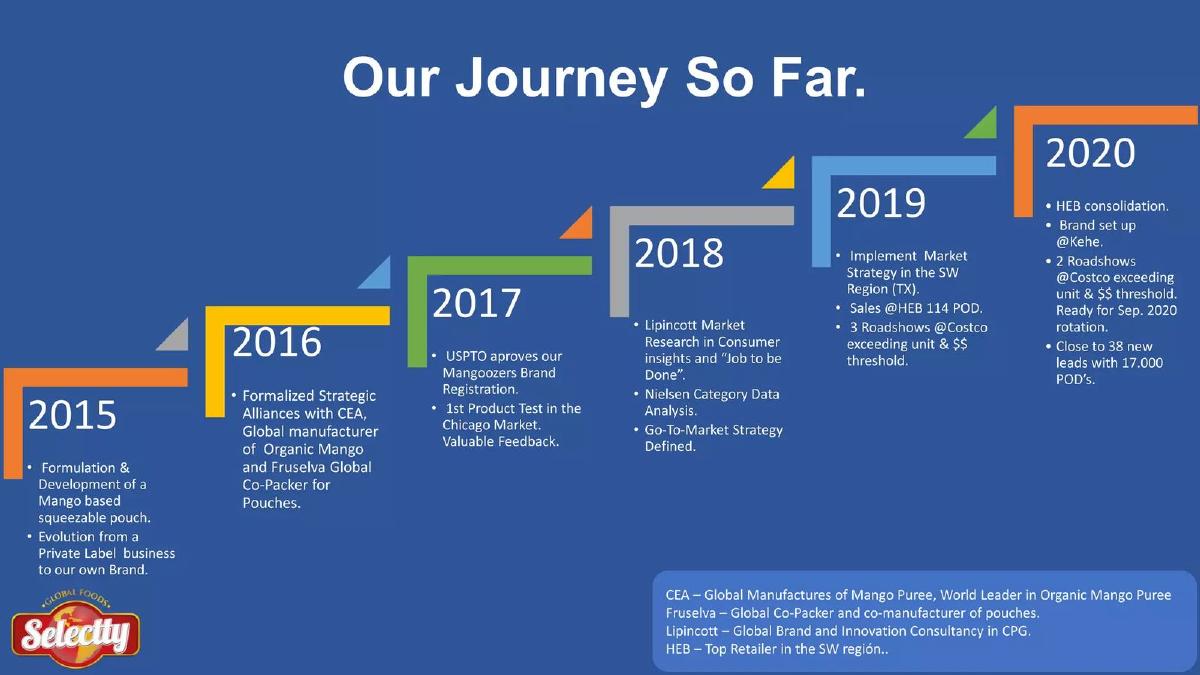
Mango purée pouch brand in the US Southwest. The timeline runs 2015–2020.
Selecty deck, slide 3. Exact stored slide matched to this analysis.
Our analysis: It reports that a trial at Costco passed the retailer's own threshold, which is the evidence a buyer needs before expanding.
Evidence and limitation: The traction is buried in a six-year timeline. Put the Costco and HEB results on their own slide with sales per store, and explain "POD" (points of distribution).
What a founder can adapt: If a retailer trial passed its threshold, say so and give the next step it unlocked.
Supporting analysis
What the deck claims: "Our Journey So Far" timeline, 2015–2020. 2019: "Sales @HEB 114 POD"; "3 Roadshows @Costco exceeding unit & $$ threshold". 2020: "HEB consolidation"; "Brand set up @Kehe"; "2 Roadshows @Costco … Ready for Sep. 2020 rotation"; "Close to 38 new leads with 17,000 POD's". Earlier years cover product development, co-packer, USDA organic approval, first product test in Chicago, and market research.
Presentation choice: It reports that a trial at Costco passed the retailer's own threshold, which is the evidence a buyer needs before expanding.
When it does not fit: The traction is buried in a six-year timeline. Put the Costco and HEB results on their own slide with sales per store, and explain "POD" (points of distribution).
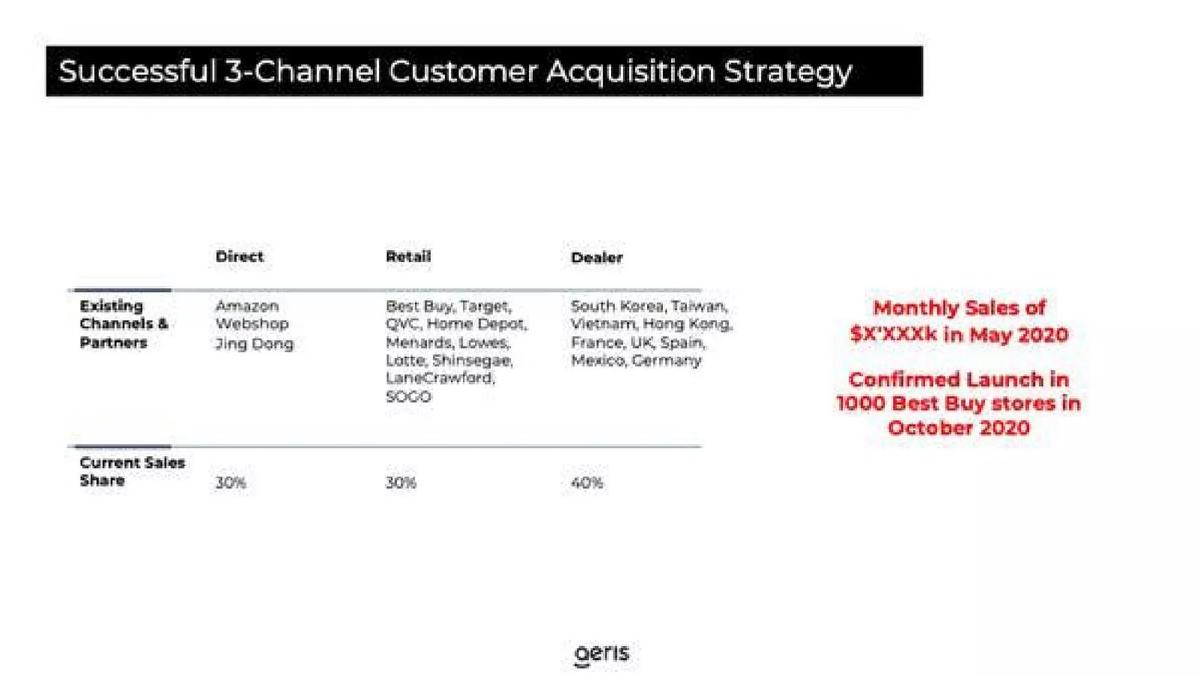
Air purifier brand. The slide refers to May and October 2020. The go-to-market guide uses a slide from a different Aeris deck.
Aeris deck, slide 6. Exact stored slide matched to this analysis.
Our analysis: It gives each channel's share of sales and a confirmed store rollout with a date.
Evidence and limitation: The monthly sales figure is masked in the published version. If you can't share it, show growth or a range instead of placeholders.
What a founder can adapt: Show the share of sales by channel next to the list of partners.
Supporting analysis
What the deck claims: "Successful 3-Channel Customer Acquisition Strategy": Direct (Amazon, webshop, Jing Dong), Retail (Best Buy, Target, QVC, Home Depot, Menards, Lowes, Lotte, Shinsegae, Lane Crawford, SOGO), Dealer (South Korea, Taiwan, Vietnam, Hong Kong, France, UK, Spain, Mexico, Germany). Current sales share: 30% / 30% / 40%. "Monthly Sales of $X'XXXk in May 2020"; "Confirmed Launch in 1000 Best Buy stores in October 2020".
Presentation choice: It gives each channel's share of sales and a confirmed store rollout with a date.
When it does not fit: The monthly sales figure is masked in the published version. If you can't share it, show growth or a range instead of placeholders.
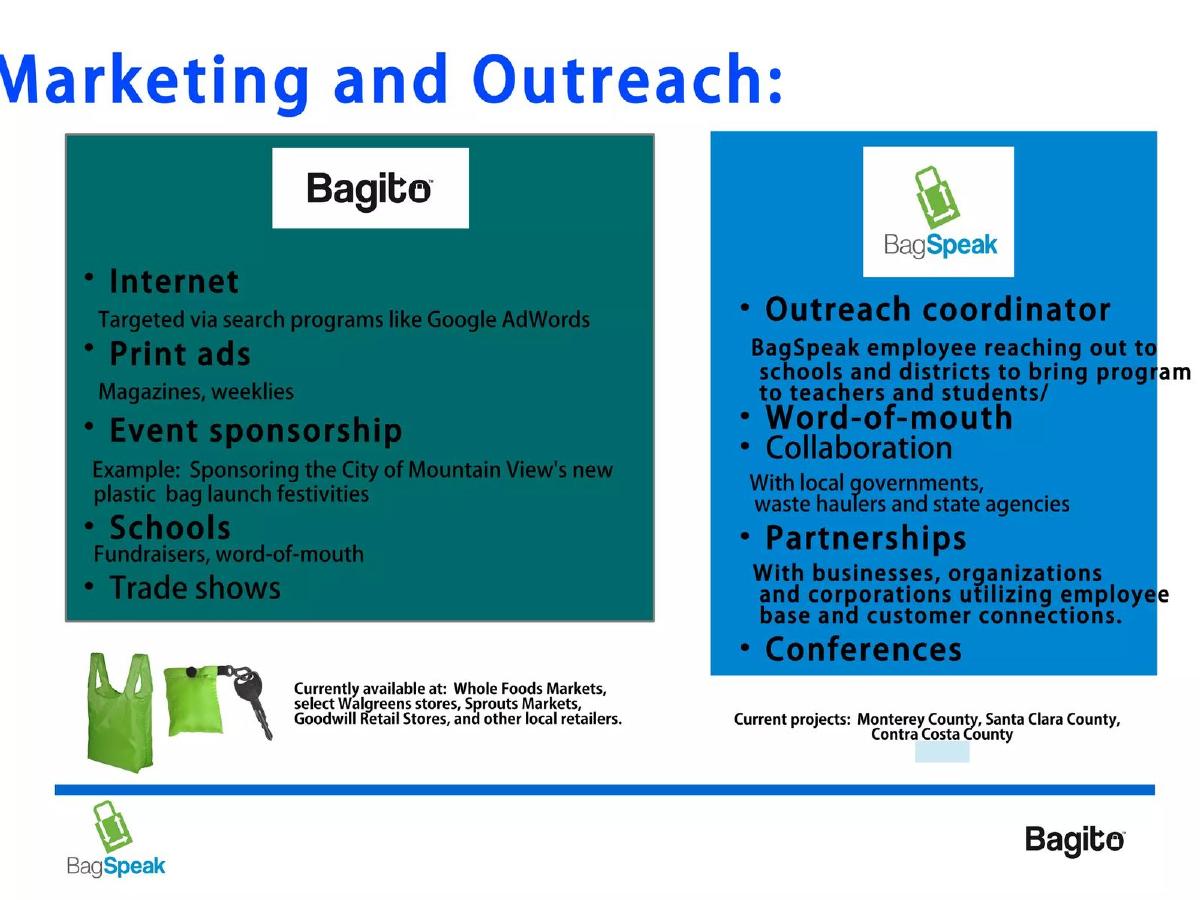
Reusable shopping bags, with the BagSpeak education programme. Stage and year are not stated on the slide.
Bagito deck, slide 5. Exact stored slide matched to this analysis.
Our analysis: Named national retailers carrying the product are real evidence of distribution.
Evidence and limitation: The stockist list is in small print under a marketing plan. Make it the headline and add store counts and sales per store.
What a founder can adapt: Treat this as a slide to improve on. Keep the named retailers.
Supporting analysis
What the deck claims: "Marketing and Outreach": Bagito (internet, print ads, event sponsorship, schools, trade shows) and BagSpeak (outreach coordinator, word of mouth, collaboration with local governments, partnerships, conferences). "Currently available at: Whole Foods Markets, select Walgreens stores, Sprouts Markets, Goodwill Retail Stores, and other local retailers."
Presentation choice: Named national retailers carrying the product are real evidence of distribution.
When it does not fit: The stockist list is in small print under a marketing plan. Make it the headline and add store counts and sales per store.
Clothing manufacturer and brand. Stage and year are not stated on the slide.
Related Garments deck, slide 5. Exact stored slide matched to this analysis.
Our analysis: Well-known named customers in four channels show real commercial relationships.
Evidence and limitation: No sales or share per channel. Add revenue by channel so investors can see which one matters.
What a founder can adapt: Treat this as a slide to improve on. Keep the named customers per channel.
Supporting analysis
What the deck claims: "Channels": Online (direct via its website and online retailers including Amazon, Shopspring, TheDrop, Fancy, Amalife, Souler, ShopMKC); Private label (for Hustler, Landry's, Dolls Kill, Fashion Nova, Rhude, Chinatown Market, Just Don); Hotel (custom programme; partners include Kimpton, Ritz-Carlton, Morgans Hotel Group, Dream Hotel Group, Landry's); Wholesale (boutique and department stores including Traffic, Rolo, Edition, Golden Nugget).
Presentation choice: Well-known named customers in four channels show real commercial relationships.
When it does not fit: No sales or share per channel. Add revenue by channel so investors can see which one matters.
Kenyan textile products brand. The slide refers to spring and summer 2013.
Tosheka Textiles deck, slide 4. Exact stored slide matched to this analysis.
Our analysis: It is honest that sales are just beginning and names the markets.
Evidence and limitation: All text, no numbers. Replace paragraphs with stockists, first orders and their value.
What a founder can adapt: Treat this as a slide to improve on. Keep the honesty about stage.
Supporting analysis
What the deck claims: "We are beginning to sell our products through retail, wholesale and on line in Kenya, USA & recently presented our products at a major trade show in Germany." Paragraphs on price-driven strategy, initial targeting of high-end supermarkets and tourists, securing export orders to the USA for spring and summer 2013, and target customers. Product photos.
Presentation choice: It is honest that sales are just beginning and names the markets.
When it does not fit: All text, no numbers. Replace paragraphs with stockists, first orders and their value.
Distribution shows where you are; velocity and reorders show whether it sells.
Example
Stockists named
Sales per store
Retailer expansion or threshold
Channel split
Chamberlain Coffee
Yes
Yes (units/store/week)
Cold box placements
No
Selecty
Yes
No
Yes (Costco threshold)
No
Aeris
Yes
No
Yes (1,000 Best Buy stores)
Yes
Solidarium
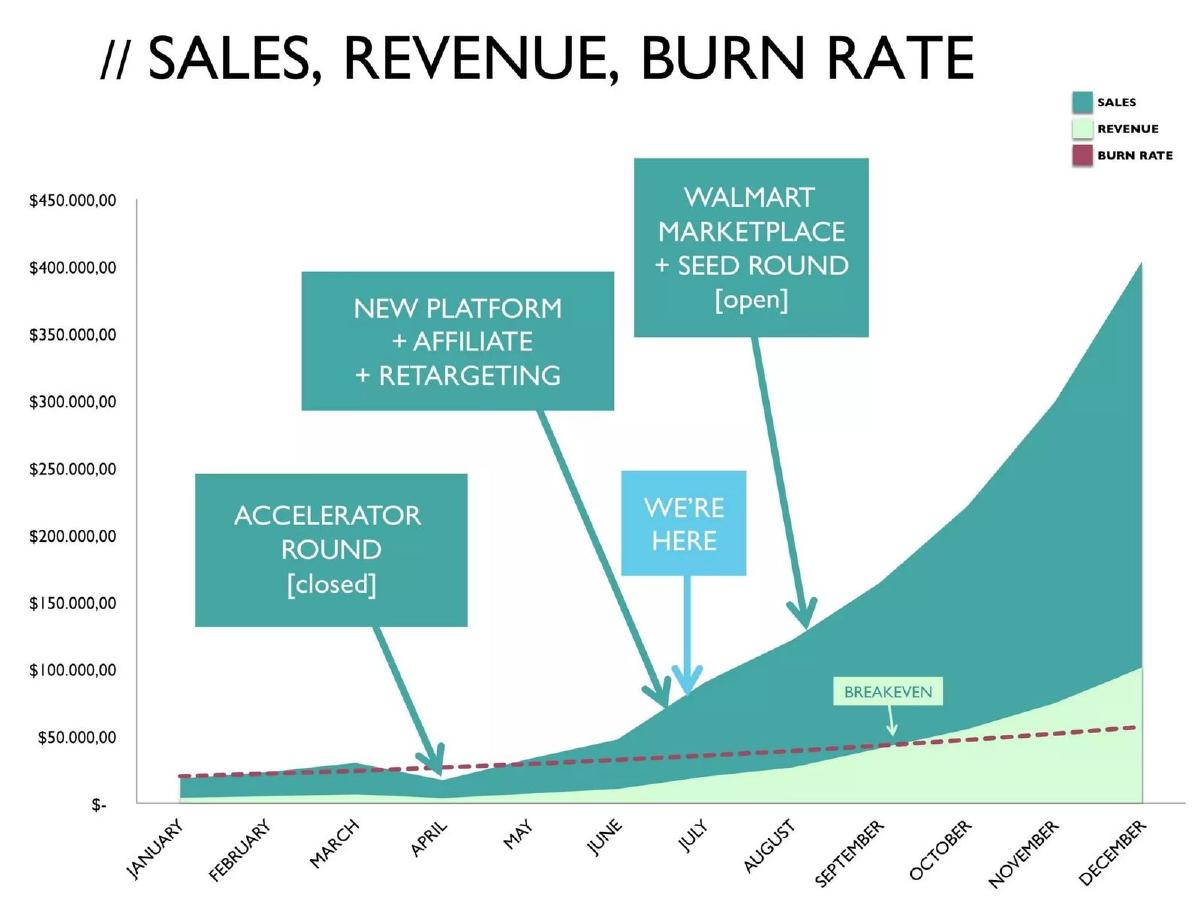
Walmart Marketplace
No
Planned
No
Bagito
Yes
No
No
No
Related Garments
Yes
No
No
Channels, no share
Tosheka Textiles
No
No
No
No
Key Takeaways
Velocity beats store count. Chamberlain reports units per store per week, the figure retail buyers use.
Show a threshold passed. Selecty's Costco roadshows exceeded the retailer's unit and dollar threshold.
Name your data source. Chamberlain cites SPINS data with a date.
Give each channel's share. Aeris splits sales 30% direct, 30% retail, 40% dealer.
A list of stockists is a start, not traction. Add sales per store or reorders.
Build your consumer product traction slide
Fill in each line with real figures.
Where. Which retailers stock you, and in how many stores?
Velocity. Units per store per week, and how that compares with the category?
Proof. Has a retailer reordered, expanded, or confirmed you passed a threshold?
Channels. What share of sales comes from retail, online and wholesale?
Source. Where does the data come from, and what period?
Copyable framework: In [n] stores at [retailers], selling [x] units/store/week vs a category average of [y] ([source], [period]). [Retailer] expanded us from [a] to [b] stores after [trial]. Sales mix: [x]% retail, [y]% online.
Illustrative example 1 — written by us
Before: Currently available at Whole Foods, Walgreens, Sprouts and local retailers.
After: In 140 Whole Foods and 60 Sprouts stores, selling 4.1 units/store/week vs a category average of 2.6 (SPINS, 12 weeks to June). Whole Foods expanded us to two new regions.
What improved: Our illustrative rewrite, not Bagito's text; the figures are invented for the example. It adds store count, velocity, comparison, source and an expansion.
What this guide adds
The main traction guide covers all types of traction; the consumer app guide covers downloads and retention; the go-to-market guide covers how you plan to reach customers. This guide covers only physical products sold through shops and marketplaces, where investors look for sell-through.
Common mistakes
Store count only. Add sales per store.
Forecast shown as traction. Separate actual from projected months.
Masked numbers. Use ranges or growth instead of placeholders.
Traction buried in a timeline. Give retail results their own slide.
Unexplained jargon. Spell out terms like POD.
Diagnostic checklist
Retailers and store counts are named.
Sales per store (velocity) is shown.
A reorder, expansion or passed threshold is reported.
Channel share of sales is given.
Data source and period are stated.
Frequently asked questions
How we chose these examples
Corpus: published pitch deck teardowns on StartupFundraising.com. Founder-uploaded private decks are excluded.
Selection (2026-09-24): we searched extracted text of slides 2–6 for retailer names (Whole Foods, Target, Walmart, Costco and others) together with sales language, and inspected seven candidates from about 25 matches. We excluded Amazon agency and aggregator decks (Amify, Acquco, Boxedup, Accel Club), market-size slides and non-consumer products. All seven inspected slides qualified.
Overlap check: the main traction guide covers all traction; the consumer app guide covers apps; the go-to-market guide covers channel plans. This guide covers only retail and marketplace sales evidence for physical products.
Review: all seven stored slide images were inspected on 2026-09-24 and matched to company, deck and slide number (editorial model review). No person has yet completed an editorial review of this page.
Figures are as shown on the slides. We make no claim that any slide caused a fundraising outcome.