The AT&T × Time Warner analyst deck serves as a masterclass in corporate M&A storytelling, designed to justify a $106.4 billion transaction value. The core thesis rested on vertical integration: combining Time Warner’s premium content (HBO, Warner Bros, CNN) with AT&T’s 144 million worldwide mobile subscribers and 45 million video subscribers. The deck emphasizes financial accretion, promising that the deal would be accretive to adjusted EPS and free cash flow within 12 months. It highlights a 36% premium for Time Warner stockholders and a $40 billion bridge loan to fund the cash portion of t…
Key takeaways
- The total transaction value was stated as $106.4 billion, including Time Warner net debt (Slide 10).
- AT&T offered $107.50 per share, representing a 36% premium over the October 19, 2016, closing price (Slide 9).
- The deal was structured as a 50/50 mix of cash and AT&T stock (Slide 8).
- AT&T aimed to combine its 133 million U.S. mobile subscribers with Time Warner’s content to drive targeted advertising (Slide 7).
- Time Warner’s 2015 financial results showed $28.1 billion in revenue across Turner, HBO, and Warner Bros (Slide 8).
- The merger expected to achieve $1 billion in annual cost-focused synergies (Slide 10).
- Pro forma leverage was projected at 2.5x by the end of year one, with a $40 billion bridge loan in place (Slide 10).
- The deck highlights Time Warner as the owner of the world’s #1 premium cable network and the largest film and TV studio (Slide 6).
The $106 Billion Vision: Marrying Pipes and Pictures
The acquisition of Time Warner by AT&T represents one of the most significant attempts at vertical integration in the history of the media and telecommunications sectors. This analyst deck, presented in October 2016, outlines a future where the owner of the distribution network (the 'pipes') also owns the content flowing through it (the 'pictures'). With a total transaction value of $106.4 billion, the stakes were exceptionally high. The deck is designed to satisfy two distinct audiences: Time Warner shareholders who needed to be convinced of the premium, and AT&T analysts who needed to be reassured about the debt load and the strategic logic of moving away from a pure utility model.
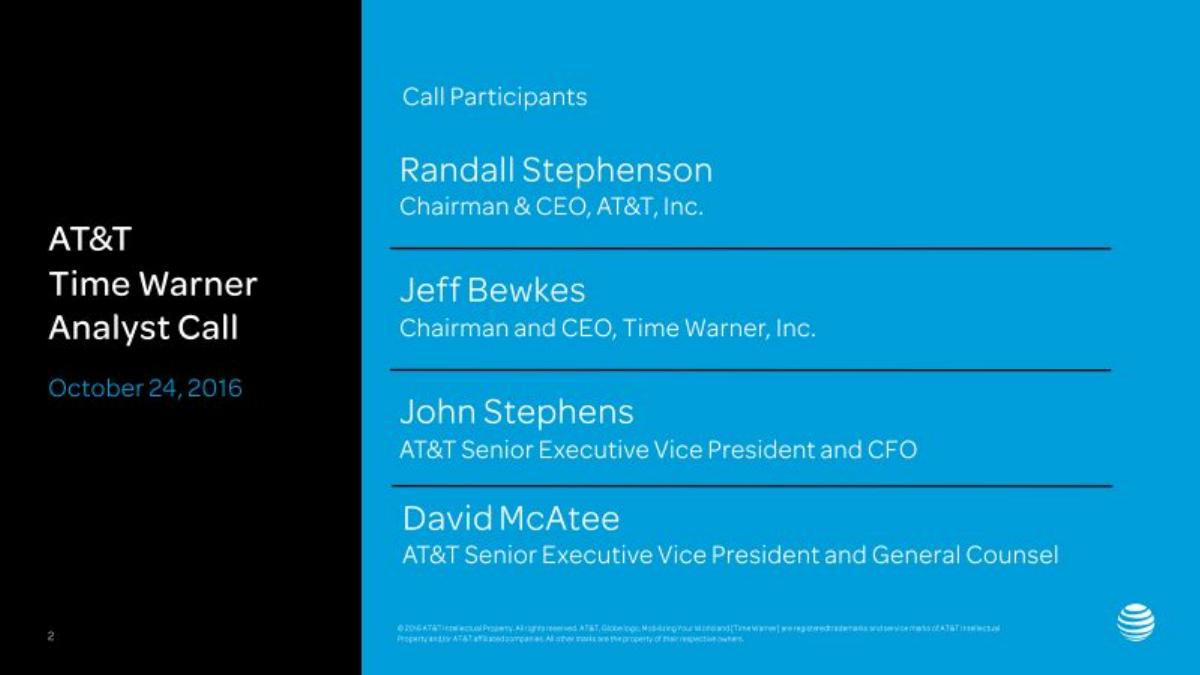
Slides 1-2: The Participants
The deck opens with a standard title slide and a list of call participants. It is notable that the leadership from both sides is present: Randall Stephenson (Chairman & CEO, AT&T) and Jeff Bewkes (Chairman & CEO, Time Warner), along with AT&T’s CFO John Stephens and General Counsel David McAtee. This presence signals a unified front and a high-level commitment to the merger's success. The date, October 24, 2016, marks the formal introduction of the deal to the public markets.
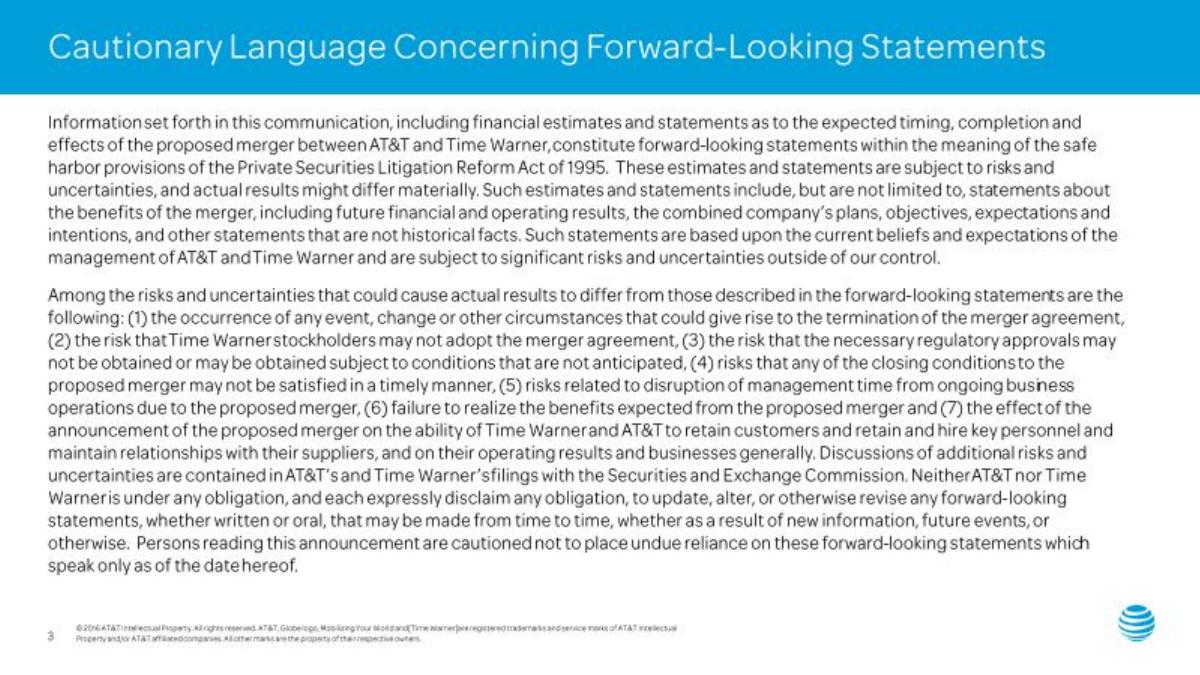
Slides 3-4: Legal Safeguards
Two full slides are dedicated to 'Cautionary Language Concerning Forward-Looking Statements.' In a transaction of this magnitude, the legal boilerplate is not just a formality; it is a shield. These slides explicitly mention the risks of regulatory disapproval, the possibility of stockholders rejecting the merger, and the potential failure to realize expected synergies. Given that the deal faced years of legal challenges from the Department of Justice, these warnings were prescient. The text is dense, emphasizing that the communication does not constitute an offer to sell securities and pointing investors toward SEC filings like the Form S-4.
Slide 5: The Strategic Thesis
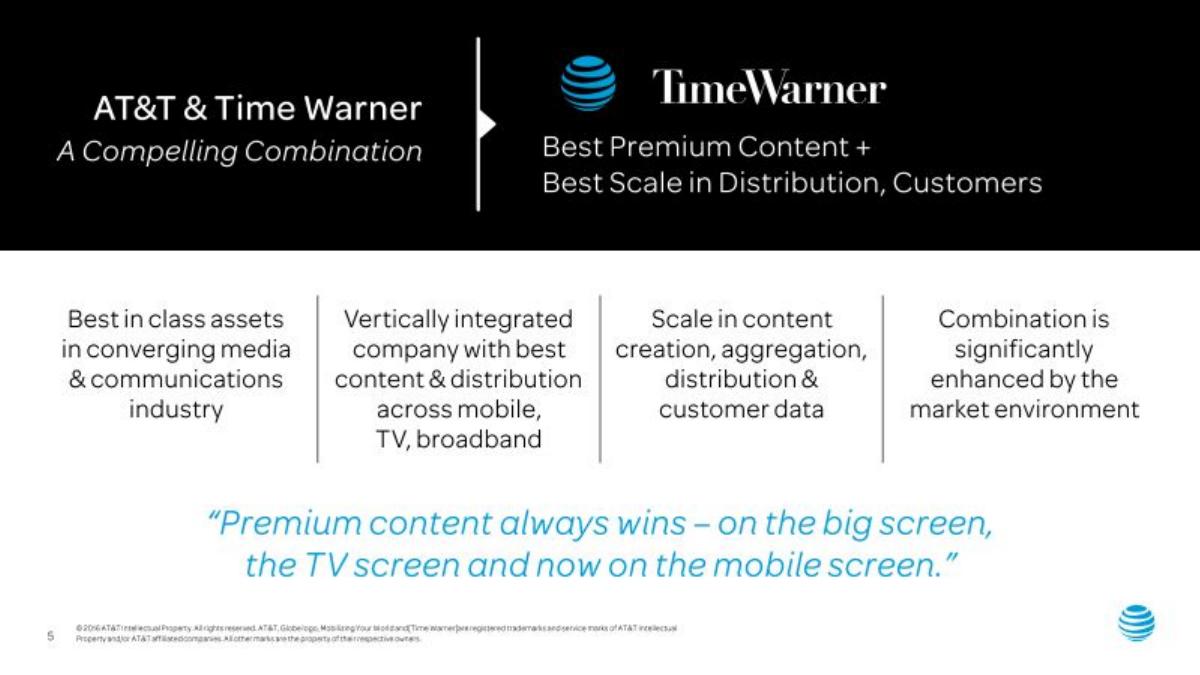
Slide 5, titled 'A Compelling Combination,' is the heart of the pitch. It presents a simple equation: 'Best Premium Content + Best Scale in Distribution, Customers.' The slide uses four pillars to support this: best-in-class assets, vertical integration across mobile/TV/broadband, scale in data, and a favorable market environment. The quote at the bottom, 'Premium content always wins – on the big screen, the TV screen and now on the mobile screen,' encapsulates the entire motivation for the deal. AT&T was betting that content would be the differentiator in a commoditized wireless market.
Slide 6: The Content Powerhouse
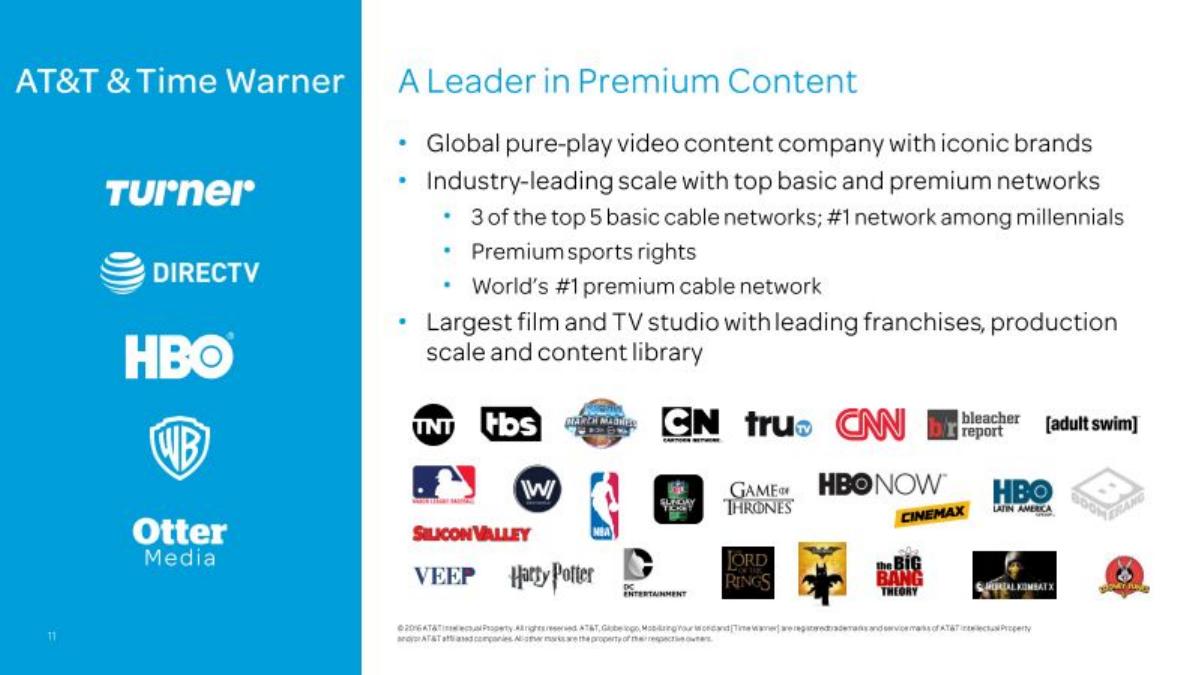
This slide focuses on Time Warner’s assets. It lists iconic brands including Turner, HBO, and Warner Bros. It makes several bold claims: owning 3 of the top 5 basic cable networks, the #1 network among millennials, and the world’s #1 premium cable network (HBO). The visual grid of logos—ranging from CNN and TNT to Game of Thrones and Harry Potter—serves to remind analysts of the sheer volume of intellectual property AT&T was acquiring. The emphasis is on 'pure-play video content' and 'production scale.'
Slide 7: Distribution and Data
While Slide 6 was about the content, Slide 7 is about the 'pipes.' AT&T highlights its 'unmatched distribution platforms,' citing 133 million U.S. mobile subscribers and 25 million video subscribers. The strategic pivot is found in the middle of the slide: 'Robust viewership insights for targeted advertising and content creation.' AT&T wasn't just buying content to show it; they were buying it to collect data on how it was consumed, which they believed would allow them to 'innovate with new subscription and ad models.'
Slide 8: Transaction Summary and Financials
Slide 8 provides the hard numbers for the deal. AT&T agreed to acquire Time Warner for $107.50 per share, split 50% in stock and 50% in cash. The slide also breaks down Time Warner’s 2015 financial results by division: Warner Bros ($13.0B revenue), Turner ($10.6B revenue), and HBO ($5.6B revenue), totaling $28.1B. Crucially, it claims the deal will be 'Accretive to margins, adjusted EPS and free cash flow' and 'Improves FCF dividend coverage,' a key metric for AT&T’s income-focused investor base.
Slide 9: Value for Time Warner Stockholders
This slide is a direct appeal to the sell-side. It highlights the 36% premium over the closing price on October 19, 2016 ($79.24). It also notes that Time Warner stockholders would end up with approximately 15% pro forma ownership of the new combined entity. The language shifts toward the consumer experience, suggesting the merger will 'significantly advance' direct-to-consumer efforts—a nod toward the burgeoning streaming wars.
Slide 10: The Financial Engineering
Slide 10 is the most technical and perhaps the most important for credit analysts. It lists the total transaction value at $106.4 billion (including $21.0 billion in Time Warner net debt). To fund the cash portion, AT&T secured a $40 billion bridge loan. The slide addresses the massive debt load by promising 'strong deleveraging potential' and a return to historical target leverage ranges by the end of year four. It also quantifies the 'annual synergy potential' at $1 billion, specifically noting these are 'cost-focused.'
Slides 11-13: AT&T 3Q16 Performance
The final three slides shift focus back to AT&T’s standalone performance in the third quarter of 2016. This is intended to prove that the 'acquirer' is operating from a position of strength. Slide 11 shows consolidated revenues of $40.9 billion and $11 billion in cash from operations. Slide 12 breaks down results by segment, highlighting record EBITDA margins in U.S. Wireless (50.1%) and growth in Mexico. Slide 13 summarizes these points, emphasizing 'stable margins' and '2016 guidance on track.' The message is clear: AT&T’s core business is healthy enough to absorb a $100 billion acquisition.
What Works in This Deck
Clear Value Proposition: The deck does an excellent job of distilling a complex, multi-billion dollar merger into a single, understandable thesis: content + distribution. By using the 'pipes and pictures' logic, they made the deal seem inevitable rather than opportunistic.
Asset Highlighting: Slide 6 is a visual powerhouse. By grouping dozens of recognizable logos, the deck effectively communicates the cultural and commercial weight of Time Warner without needing deep financial tables for every sub-brand.
Addressing Investor Fears: AT&T knew the $40 billion bridge loan and the total debt load would be the primary concerns. Slide 10 addresses these head-on with specific deleveraging targets and synergy numbers, providing a roadmap for financial stability.
What Is Missing
Integration Specifics: While the deck mentions $1 billion in cost synergies, it is very light on how these would be achieved. Merging a Dallas-based telecom utility with a New York/LA-based creative powerhouse presents massive cultural and operational hurdles that are entirely unaddressed.
Competitive Landscape: The deck operates in a vacuum. There is no mention of Netflix, Amazon, or Disney, all of whom were rapidly changing the media landscape in 2016. The deck assumes that 'owning the pipes' is a permanent advantage, failing to account for the rise of over-the-top (OTT) services that bypass those pipes.
Execution Risk: Beyond the legal boilerplate, there is no discussion of the 'disruption of management time' mentioned in the risks. A six-year regulatory fight (as noted in the editorial context) was a possibility that the deck treats as a standard checkbox rather than a potential deal-killer.
What a Founder Should Copy
The 'Summary' Slide: Slide 8 is a perfect example of how to present a complex deal or investment round. It covers valuation, consideration mix, financial impact, and required approvals in one glance. Founders should use this 'Transaction Summary' format for their 'The Ask' slides.
Segmented Metrics: Slide 12's breakdown of U.S. Wireless, Entertainment Group, and International is a great way to show a diversified business. If your startup has multiple revenue streams or product lines, presenting them with their own margins and growth rates builds credibility.
The Equation Pitch: The 'A + B = Success' logic on Slide 5 is highly effective. Founders should try to boil their entire company's existence down to a single strategic equation that feels both simple and powerful.
Frequently asked questions
- What was the primary strategic justification for the merger?
- The primary justification was vertical integration. As shown on Slide 5, AT&T believed that combining 'Best Premium Content' with 'Best Scale in Distribution' would create a company capable of winning across mobile, TV, and broadband screens. They aimed to use viewership insights from their distribution platforms to inform content creation and innovate new advertising models.
- How was the $106.4 billion transaction funded?
- According to Slide 10, the funding included a $40 billion bridge loan. The consideration paid to Time Warner stockholders was a 50/50 mix of cash and new AT&T equity. This resulted in approximately 1.1 billion new AT&T shares being issued, giving Time Warner stockholders roughly 15% pro forma ownership of the combined entity.
- What were the projected financial benefits for AT&T?
- Slide 10 outlines that the deal was expected to be accretive to adjusted EPS and free cash flow per share within 12 months. It also aimed to improve free cash flow dividend coverage and projected $1 billion in annual cost synergies. The combined company expected to maintain over $60 billion in EBITDA.
- Which Time Warner assets were highlighted as most valuable?
- Slide 8 breaks down the 2015 revenue for key units: Warner Bros ($13.0B), Turner ($10.6B), and HBO ($5.6B). Slide 6 further emphasizes their market positions, noting Turner’s 'premium sports rights,' HBO as the 'World’s #1 premium cable network,' and Warner Bros as the 'World’s largest film and television studio.'
- What regulatory hurdles did the companies anticipate?
- Slide 8 explicitly lists 'Regulatory approvals in U.S., E.U. and various countries abroad' as a requirement for closing. The 'Cautionary Language' on Slides 3 and 4 further details the risks that necessary regulatory approvals might not be obtained or might be subject to unanticipated conditions.