Teranga Gold Corporation's 2016 investor presentation is a data-heavy deck designed for institutional investors in the natural resources sector. The company utilizes a 'relative undervaluation' thesis, supported by four distinct valuation charts on slide 5, to argue that its current enterprise value does not reflect its production capacity or reserve base compared to peers like B2Gold and Endeavour. The deck details the operational strength of the Sabodala Gold Mine in Senegal and outlines a significant M&A strategy involving Gryphon Minerals and Miminvest. With a projected $549 million in cu…
Key takeaways
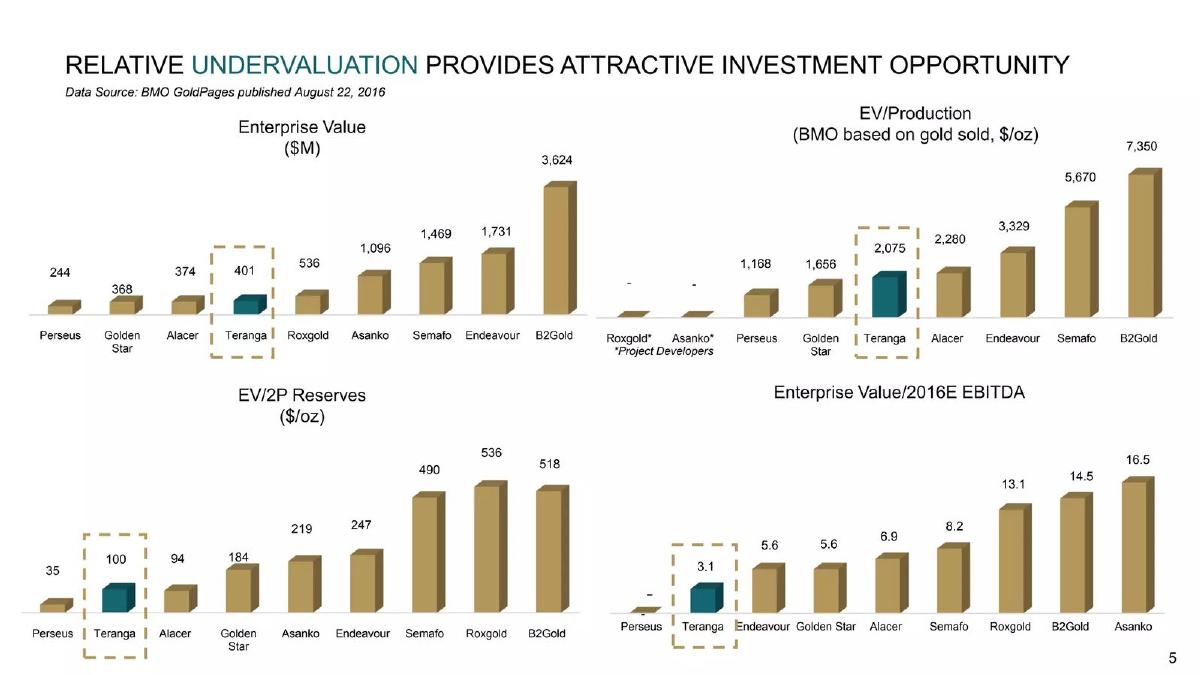
- The company positions itself as undervalued by showing an EV/2016E EBITDA of 3.1, the lowest among its peer group (Slide 5).
- Teranga projects $549 million in cumulative cash flow over the life of the Sabodala mine, despite a planned $44 million negative cash flow year in 2021 due to underground development (Slide 13).
- The core operational asset is the Sabodala Gold Mine in Senegal, West Africa, which serves as the primary cash flow engine (Slide 9).
- A strategic pivot toward M&A is highlighted through the proposed acquisition of Gryphon Minerals and a joint venture with Miminvest (Slide 17).
- The company claims an 80% increase in reserves since its IPO, growing from 1.5 million ounces in 2010 to a pro forma 3.5 million ounces in 2016 (Slide 21).
- Detailed mineral resource tables show a total measured and indicated resource of 4.44 million ounces of gold as of December 31, 2015 (Slide 25).
- Operating costs are managed through low annual sustaining capex, cited as less than $10 million per year (Slide 13).
- The deck is highly technical, including NI 43-101 compliant technical report data and 12 specific footnotes regarding mineral resource definitions (Slide 25).
Teranga Gold: A Deep Dive into Resource-Based Valuation
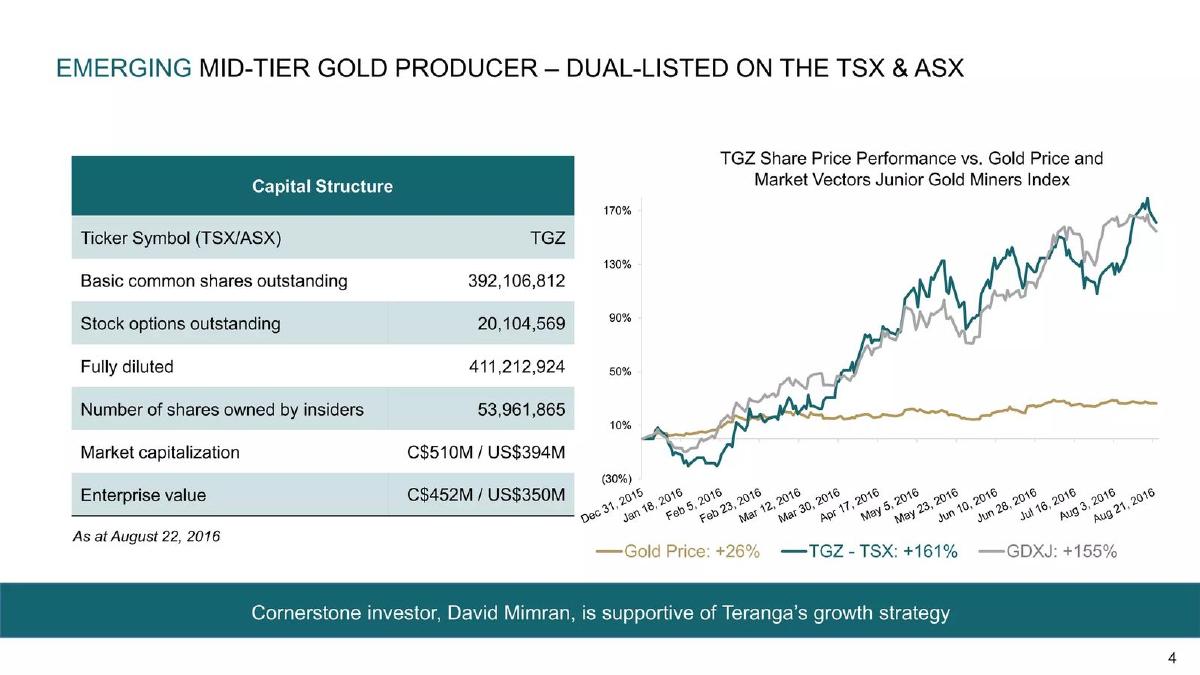
The investor presentation for Teranga Gold Corporation, dated August 24, 2016, represents a classic example of a public-market mining pitch. Unlike early-stage tech startups that sell a vision of the future, Teranga sells a vision of calculated, de-risked extraction. The deck is heavily quantitative, relying on geological data and comparative financial metrics to justify its market position. Listed on both the TSX and ASX under the ticker TGZ, the company uses this deck to communicate its transition from a single-mine operator to a multi-jurisdictional producer.
The Valuation Argument (Slides 1-5)
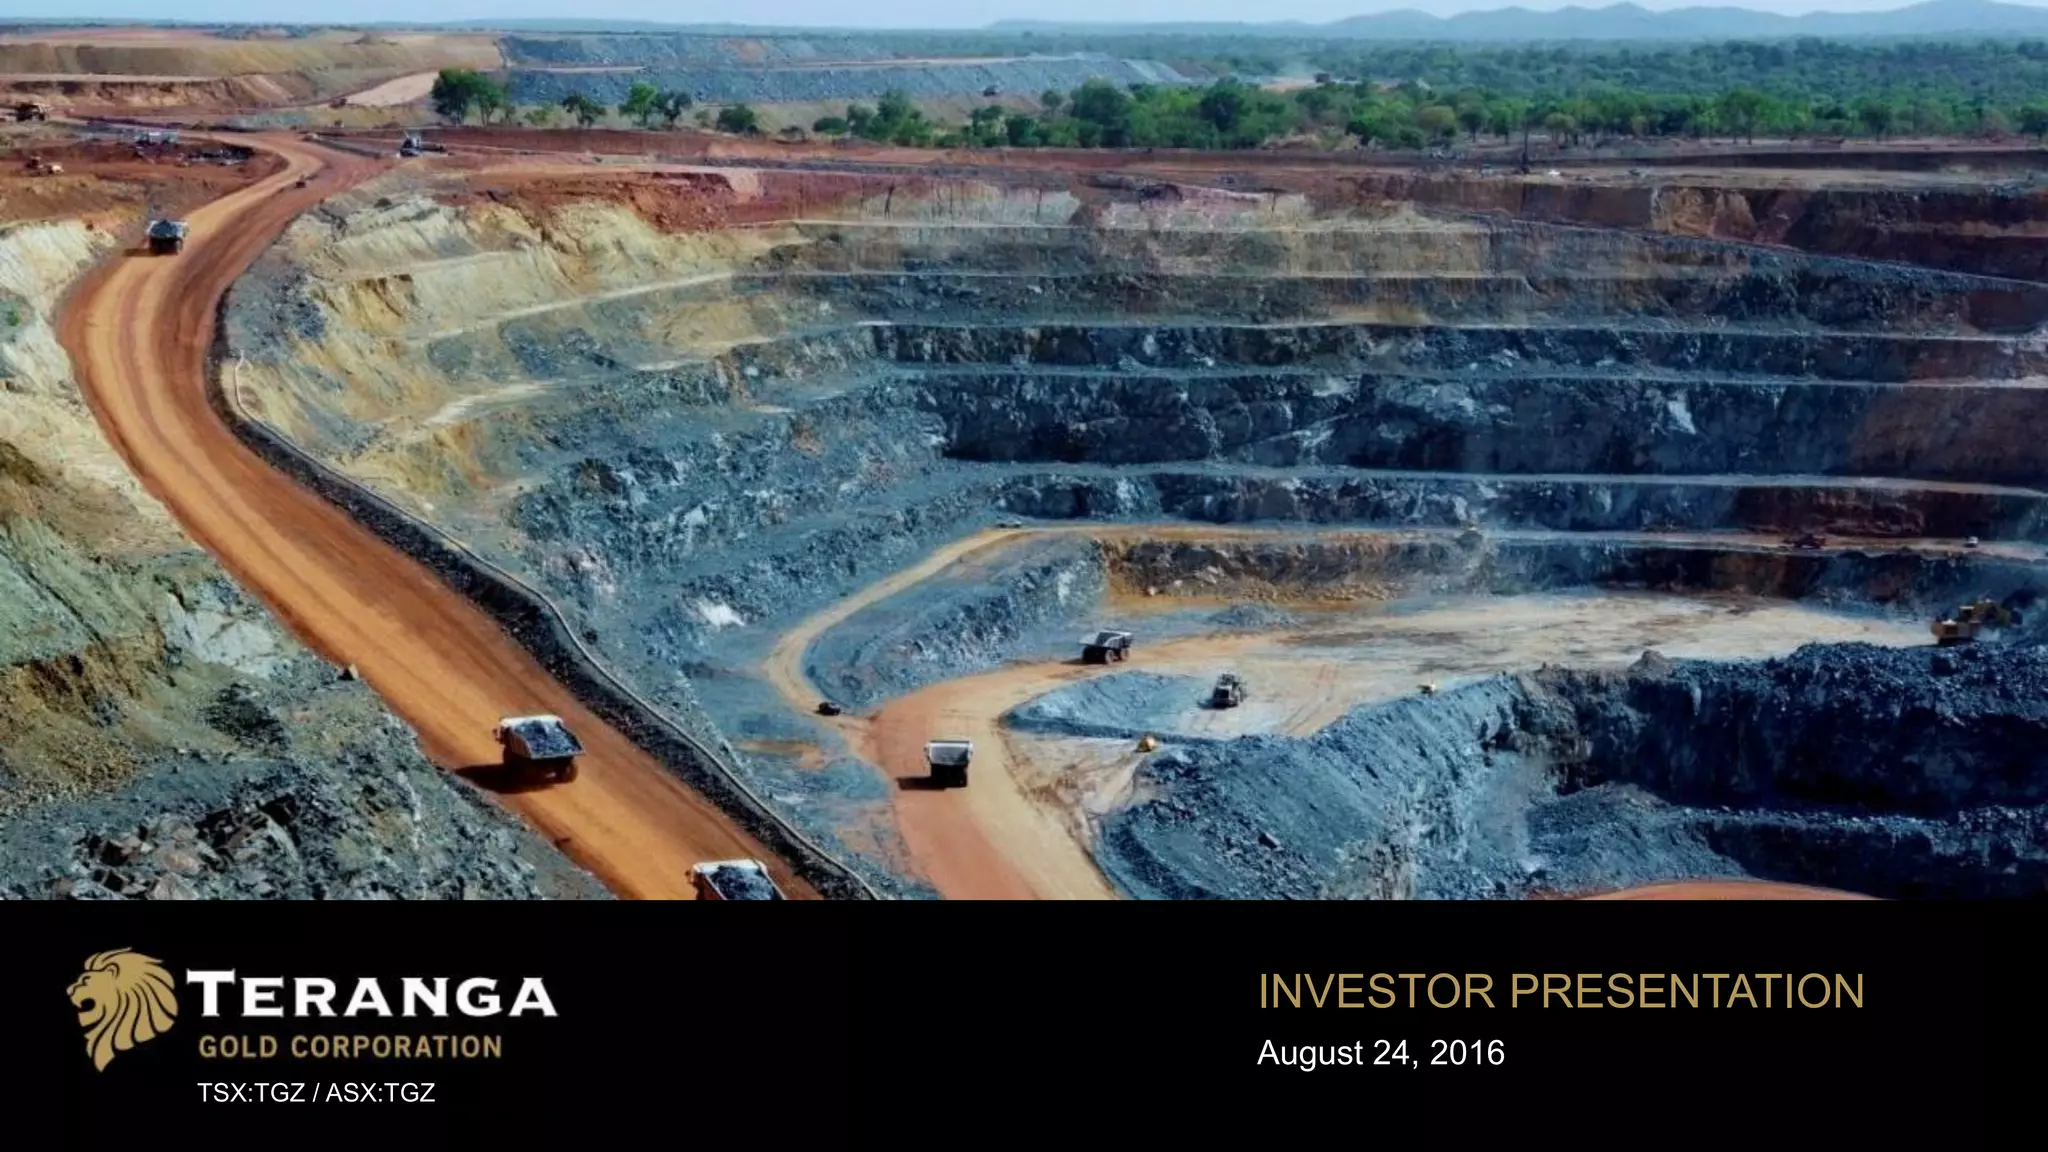
Slide 1 sets the tone with high-quality aerial photography of an open-pit mine, immediately establishing the scale of operations. However, the real work begins on Slide 5 , titled "Relative Undervaluation Provides Attractive Investment Opportunity." This is the most critical slide for any investor looking at the company's financial health. Teranga presents four bar charts comparing itself to peers like Perseus, Alacer, Endeavour, and B2Gold.
The data, sourced from BMO GoldPages, highlights that Teranga's Enterprise Value (EV) of $401M is significantly lower than many peers, yet its EV/Production ($2,075/oz) is competitive. Most importantly, it shows an EV/2016E EBITDA of 3.1 , which is the lowest in the peer group. By highlighting these specific multiples, Teranga is telling investors that the market has not yet priced in the full value of its production and cash flow potential.
Operational Core: Sabodala Gold Mine (Slides 9-13)
Slide 9 introduces the Sabodala Gold Mine in Senegal. This is the company's flagship asset. The presentation moves from the macro valuation to the micro operational details on Slide 13 , which outlines the "Significant Cumulative Cash Flow Build Over Life of Mine." The company projects a total of $549 million in cumulative cash flow based on current reserves.
This slide is particularly honest about the risks of mining. It includes a table showing a projected negative cash flow of ($44 million) in 2021. The text explains this is due to "large capex associated with underground mine development." By being transparent about this dip, the company builds credibility for the subsequent recovery, where cash flow is expected to jump to $137 million by 2024. The slide also notes that sustaining capital is kept low, at less than $10 million annually, which is a key selling point for margin-conscious investors.
Growth Through M&A (Slides 17-21)
To move the needle on valuation, Teranga demonstrates that it is not stagnant. Slide 17 serves as a transition, announcing the "Proposed Acquisition of Gryphon Minerals" in Burkina Faso and a "Joint Venture with Miminvest" in Cote d'Ivoire. This represents a strategic expansion into the broader West African gold belt.
Slide 21 visualizes the impact of these moves. It shows an "80% increase in reserves since IPO," growing from 1.5 million ounces in 2010 to a pro forma 3.5 million ounces in 2016. The chart breaks down this growth into three categories: Exploration & Evaluation (0.9 Moz), Acquisition (1.3 Moz), and Production (-1.1 Moz). The addition of Gryphon’s 0.826 Moz is the final piece of the puzzle that brings the total to the 3.5 Moz mark. This slide effectively communicates that the company is replacing the ounces it mines through both the drill bit and the checkbook.
Technical Rigor and Resource Summary (Slide 25)
For a mining investor, the "Resource Summary" on Slide 25 is the most important page in the deck. It provides a granular breakdown of every deposit, including Sabodala, Gora, Niakafiri, and Masato. The table lists Tonnes, Grade (g/t Au), and Ounces (Au) across Measured, Indicated, and Inferred categories.
The totals are impressive: 4.44 million ounces of gold in the Measured and Indicated categories at an average grade of 1.62 g/t Au . The slide is dense with 12 detailed footnotes, ensuring compliance with regulatory standards. This level of detail is non-negotiable in the mining sector, as it provides the underlying data for all the financial projections mentioned earlier in the deck.
What Works in This Deck
Peer Benchmarking: The use of four different valuation multiples on Slide 5 makes a compelling case for why the stock might be a "buy" based on fundamentals rather than just speculation. · Cash Flow Transparency: Showing a year of negative cash flow (Slide 13) demonstrates a realistic long-term planning horizon and prevents investors from being surprised by future capital requirements. · Visualizing Reserve Growth: The waterfall chart on Slide 21 is an excellent way to show how a company maintains its "inventory" (reserves) over time, despite constant production. · Geographic Focus: By focusing on West Africa, the company positions itself as a regional specialist, which can be a competitive advantage in navigating local regulations and infrastructure.
What Is Missing
Management Team: In the provided slides, there is no mention of the executive team or the board of directors. In mining, the "jockey" is often as important as the "horse," and investors want to know who has successfully built mines in Africa before. · Political Risk Assessment: Operating in Senegal, Burkina Faso, and Cote d'Ivoire carries inherent geopolitical risks. The deck lacks a slide addressing how the company mitigates these risks or its relationship with local governments. · ESG and Sustainability: Modern investor decks require a focus on Environmental, Social, and Governance (ESG) factors. While this deck is from 2016, a contemporary version would need to address water usage, community relations, and carbon footprint. · Gold Price Sensitivity: The projections are based on $1,100 gold (Slide 21). The deck would benefit from a sensitivity analysis showing how cash flows change if gold prices fluctuate to $1,300 or drop to $900.
Founder Takeaways
Even for founders outside the mining sector, there are lessons to be learned from Teranga's approach. First, use relative valuation . If you are raising a Series A, don't just pick a number; show how your metrics (CAC, LTV, Growth) compare to companies that recently raised at the valuation you are seeking. Second, own your capital cycles . If your business requires a heavy investment year to unlock future growth, show the dip and the recovery clearly, as Teranga did on Slide 13. Finally, data is your best defense . The technical summary on Slide 25 is the "proof of work" that backs up every other claim in the deck. In your own pitch, ensure your most aggressive claims are supported by a "Notes" or "Data" slide that an analyst can verify.
Frequently asked questions
- What is the primary investment thesis presented by Teranga Gold?
- The primary thesis is relative undervaluation. On slide 5, Teranga compares its valuation multiples against eight peers. It shows the lowest EV/2016E EBITDA (3.1x) and a significantly lower EV/2P Reserves ($100/oz) compared to the group average. The company argues that its market cap of $401M is disproportionately low given its production levels and cash flow generation compared to companies like B2Gold or Semafo.
- How does the company plan to handle the high costs of underground mine development?
- Slide 13 explicitly addresses this transition. The company forecasts a single year of negative cash flow ($44 million) in 2021 due to large capital expenditures associated with underground development at Sabodala. However, they offset this concern by showing that the years immediately following (2023-2024) are expected to generate the highest annual cash flows in the mine's life, peaking at $137 million in 2024.
- What is the significance of the Gryphon Minerals acquisition mentioned in the deck?
- The acquisition is central to Teranga's growth strategy to move beyond a single-asset producer. As shown on slide 21, adding Gryphon’s reserves (0.826 million ounces) allows Teranga to reach a pro forma reserve base of 3.5 million ounces. This acquisition expands their footprint into Burkina Faso, diversifying their geographic risk which was previously concentrated solely in Senegal.
- What technical standards does Teranga use to report its gold reserves?
- Teranga adheres to strict mining industry reporting standards. Slide 13 references the NI 43-101 Technical Report from March 2016 for its cash flow projections. Furthermore, slide 25 provides a comprehensive breakdown of Measured, Indicated, and Inferred resources following CIM (Canadian Institute of Mining, Metallurgy and Petroleum) definitions, which is standard for companies listed on the TSX.
- Does the deck provide information on the management team or board?
- Based on the 8 slides provided from the 32-slide deck, there is no team slide. While the full presentation likely includes biographies, the core of the pitch is focused on asset quality, financial modeling, and resource calculations rather than individual leadership profiles. This is typical for mid-tier mining companies where the 'rocks in the ground' and the balance sheet are the primary drivers of institutional interest.