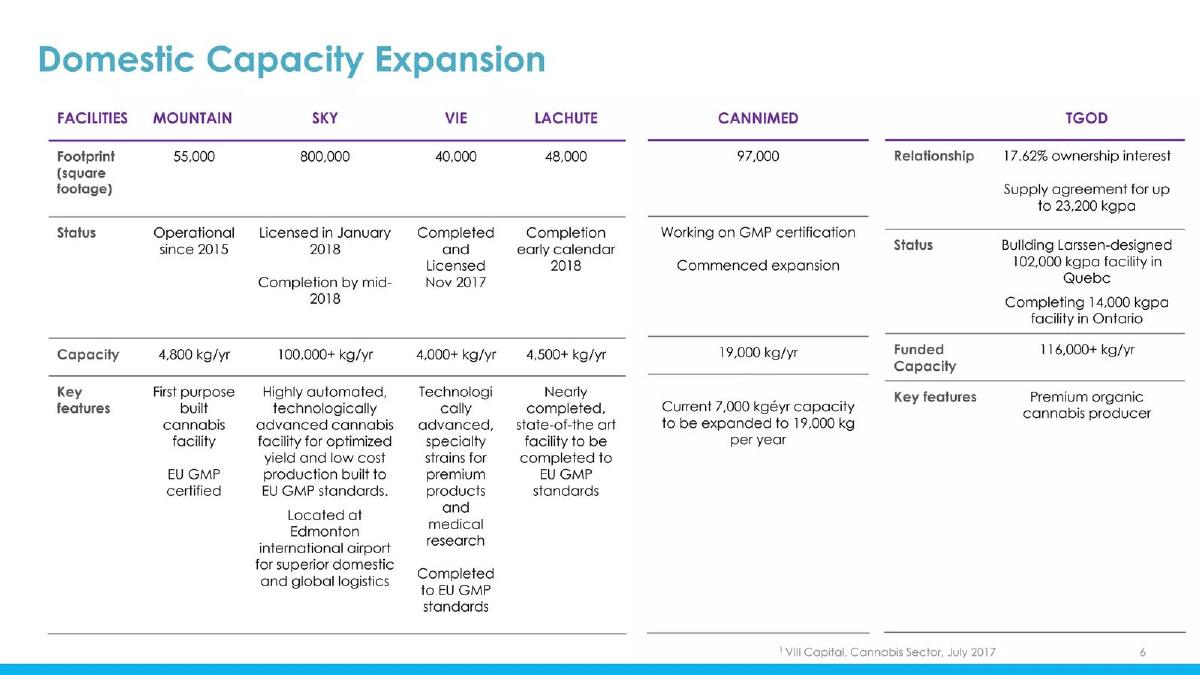
The Aurora Cannabis acquisition deck for CanniMed Therapeutics serves as a masterclass in M&A storytelling for public markets. Dated March 2018, the presentation focuses on three pillars: scale, synergy, and science. By acquiring CanniMed, Aurora sought to add 19,000 kg of annual production capacity and over 20,000 patients, positioning the combined entity as a global leader with a pro forma market cap of approximately C$7.3 billion. The deck effectively uses comparative data to show how the merger would leapfrog competitors like Canopy Growth. It also highlights a critical pivot toward medic…
Key takeaways
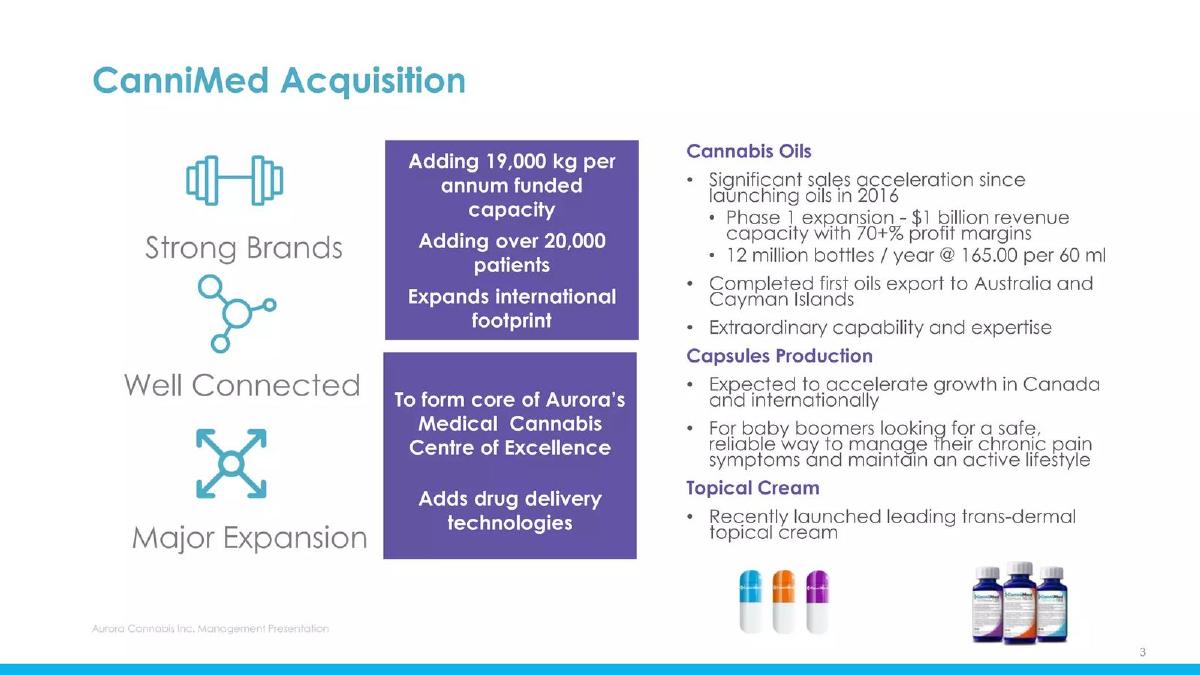
- The acquisition adds 19,000 kg per annum of funded capacity and over 20,000 patients to Aurora's portfolio (Slide 3).
- Aurora identifies a specific strategic gap, noting they have 'no active clinical trials,' which CanniMed fills through existing research initiatives (Slide 11).
- The merger targets a combined international population reach of approximately 588.8 million people across multiple continents (Slide 7).
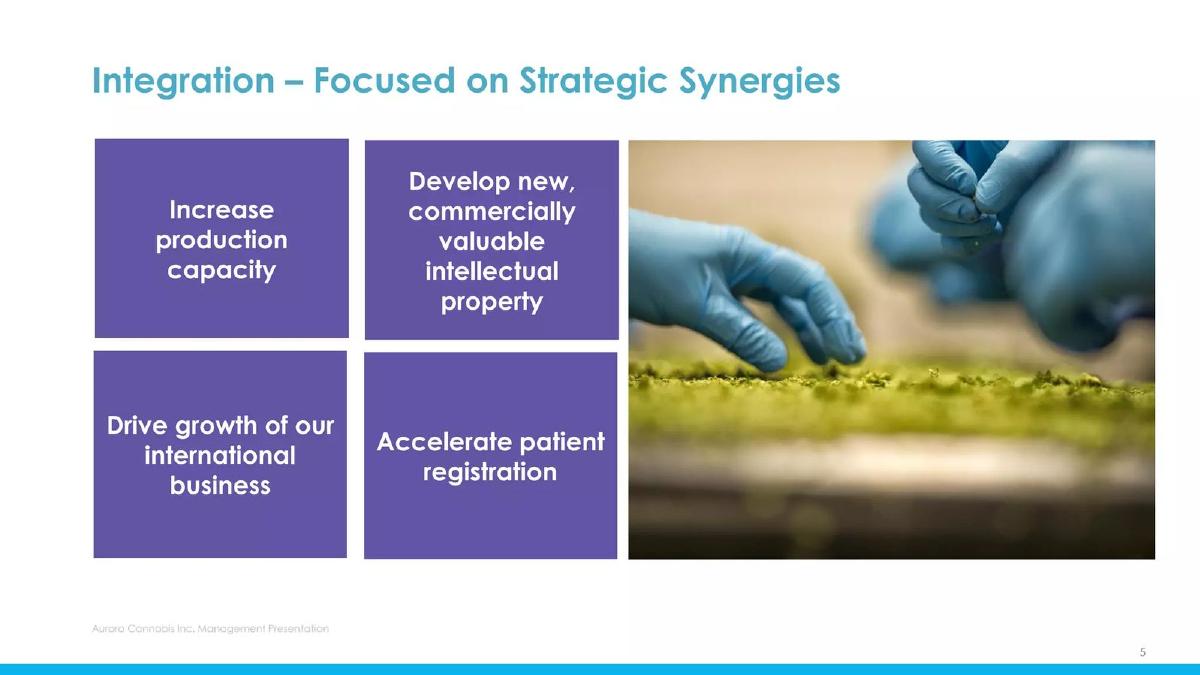
- Strategic synergies are focused on four areas: production capacity, international growth, intellectual property, and patient registration (Slide 5).
- The combined entity's pro forma market capitalization was projected at ~C$7.3 billion, surpassing Canopy Growth's C$6.0 billion at the time (Slide 17).
- CanniMed's oil production is highlighted as a high-margin business, with 70+% profit margins and a price point of $165.00 per 60 ml bottle (Slide 3).
- The deck uses a THC vs. CBD value scatter plot to demonstrate how the acquisition adds four balanced ratio strains to Aurora's medical offering (Slide 9).
- Revenue growth charts show the combined 'ACB+CMED' entity significantly outpacing individual competitors like Aphria and Cronos as of December 2017 (Slide 15).
Introduction and Strategic Vision
The Aurora Cannabis presentation from March 2018 is a definitive artifact of the Canadian cannabis consolidation era. Titled "The Aurora Standard," the deck outlines the acquisition of CanniMed Therapeutics. Unlike a standard startup pitch deck seeking seed funding, this is a management presentation designed to sell a massive M&A transaction to shareholders and institutional investors. The narrative is built on the pillars of Quality, Agility, Innovation, Execution, and Expansion, as stated on the cover slide.
Slide 3: CanniMed Acquisition Value Proposition
Slide 3 serves as the executive summary for the deal. It breaks down the acquisition into three qualitative buckets: Strong Brands, Well Connected, and Major Expansion. The quantitative highlights are significant: the deal adds 19,000 kg per annum in funded production capacity and brings in over 20,000 patients. A key takeaway here is the focus on high-margin derivatives. The slide notes that CanniMed's oil expansion has a "$1 billion revenue capacity with 70+% profit margins," selling 12 million bottles per year at a price point of $165.00 per 60 ml. This emphasizes that the deal isn't just about raw weight; it's about pharmaceutical-grade products like capsules and topical creams.
Slide 5: Integration and Strategic Synergies
This slide outlines the four focus areas for the post-merger integration. Aurora aims to increase production capacity, develop new commercially valuable intellectual property, drive international growth, and accelerate patient registration. The inclusion of "intellectual property" is a subtle nod to the shift from agriculture to biotech, a theme that is expanded upon later in the deck regarding clinical trials.
Slide 7: International Expansion and Global Reach
Slide 7 is perhaps the most ambitious in the deck, featuring a world map that highlights a combined population reach of approximately 588.8 million people. The map details specific footholds: a 51% ownership of Aurora Nordic in Denmark (a 1,000,000 sq ft facility), wholesale distribution in Germany via Pedanios, and government supply contracts in Italy. It also mentions a 22.9% interest in Australia's Cann Group. The strategic logic presented is that Aurora is one of the few companies with the EU GMP certification required to participate in these high-barrier-to-entry international markets.
Slide 9: Medical Genetics and Product Balancing
On Slide 9, the company uses a scatter plot to map CBD Value (%) against THC Value (%). The chart visualizes a clear gap in Aurora's existing portfolio, which CanniMed fills. By adding four "balanced ratio" strains (indicated by red dots in the center of the plot), Aurora can better serve medical patients seeking symptom relief for diseases like arthritis and neuropathic pain without the high THC levels associated with recreational use. This slide is a strong example of using data visualization to prove product-market fit and portfolio synergy.
Slide 11: Clinical Trials and Medical R&D
This is a rare moment of corporate vulnerability used as a selling point. Aurora explicitly states, "Aurora has no active clinical trials." It then positions CanniMed as the solution to this "gap." The slide lists partnerships with the University of Manitoba, McGill, and Dalhousie University, as well as commercial partnerships with Avaria Health & Beauty and Fagron. By acquiring CanniMed, Aurora effectively bought a pre-packaged R&D department, moving them closer to a traditional pharmaceutical model.
Slide 13 & 15: Financial Performance and Revenue Growth
Slide 13 introduces the financial section, and Slide 15 provides a comparative revenue growth chart. The chart tracks revenue development from March 2016 to December 2017. It compares Aurora (ACB) and CanniMed (CMED) against competitors like Canopy (WEED), Aphria (APH), and Cronos (LEAF). The green line representing the combined "ACB+CMED" entity shows a steep upward trajectory, ending the period significantly higher than most competitors, second only to Canopy. This visualizes the "power of two" logic, suggesting that the merger creates a clear market leader.
Slide 17: Market Capitalization and Scale
The climax of the financial argument appears on Slide 17. It shows a bar chart of the top 15 publicly traded Canadian cannabis companies by market capitalization as of March 2, 2018. The "Pro Forma" combined entity is shown at the far left with a market cap of C$7.254 billion, surpassing Canopy Growth at C$6.017 billion. The slide argues that this increased scale leads to "better access to, and lower cost of capital." In the capital-intensive world of 2018 cannabis, this was the ultimate competitive advantage.
Slide 19: Contact Information
The deck concludes with a standard contact slide for Marc Lakmaaker, the Director of Investor Relations. This reinforces that the deck's primary audience was the investment community and shareholders who needed to approve or support the transaction.
What Aurora Does Well
Aurora excels at identifying and articulating specific gaps in their own business model and showing exactly how the acquisition fills them. The admission on Slide 11 regarding their lack of clinical trials is a powerful rhetorical device; it builds trust by being honest about a weakness while simultaneously presenting the acquisition as the perfect cure. Furthermore, their use of comparative data (Slide 17) is highly effective. By showing the pro forma entity at the top of the market cap list, they create a sense of inevitability and leadership that is very attractive to institutional investors.
What Is Missing from the Deck
Despite the 20-slide length (of which 10 are analyzed here), there are notable omissions common in the cannabis industry of that era. First, there is a lack of detailed unit economics. While they mention 70% margins on oils, they do not provide a clear breakdown of the "all-in" cost to produce a gram of dried flower or a milliliter of oil across their various facilities. Second, the deck is light on potential integration risks. M&A at this scale often suffers from cultural clashes and operational redundancies, yet the deck presents a purely frictionless integration. Finally, there is no mention of the regulatory risks associated with international markets, many of which were (and are) in a state of flux.
What a Founder Should Copy
Founders should emulate Aurora's use of the "Gap Analysis" shown on Slides 9 and 11. If you are pitching a partnership or an acquisition, don't just talk about how great both companies are. Show specifically where one company is weak and how the other provides the missing piece. The THC/CBD scatter plot is an excellent way to visualize a product portfolio gap. Additionally, the use of a "Pro Forma" chart to show how a deal changes the competitive landscape is a must-have for any founder discussing mergers or significant strategic pivots. It allows investors to see the future state of the market rather than just the current reality.
Conclusion
The Aurora-CanniMed deck is a product of its time—an era of hyper-growth and aggressive land grabs. It successfully balances the "brute force" metrics of production capacity and market cap with the "soft power" of clinical R&D and pharmaceutical legitimacy. For a fundraising analyst, it serves as a reminder that at the highest levels of corporate finance, the story is often about who can consolidate the most resources the fastest to achieve an unassailable market position.
Frequently asked questions
- What was the primary financial justification for the Aurora-CanniMed merger?
- The primary justification was scale and market dominance. According to Slide 17, the combination was designed to create the largest publicly traded Canadian cannabis company by market capitalization, reaching approximately C$7.3 billion. This scale was intended to provide better access to capital and a lower cost of capital, allowing the combined entity to outcompete smaller players in a rapidly consolidating industry.
- How did Aurora plan to integrate CanniMed's medical research?
- Aurora was transparent about its lack of internal R&D, stating on Slide 11 that it had 'no active clinical trials.' CanniMed was positioned to fill this gap through its involvement in trials for neuropathic pain and arthritis, as well as partnerships with academic institutions like McGill and the University of Manitoba. This moved Aurora from a pure production play to a biopharmaceutical contender.
- What were the specific production capacity gains mentioned in the deck?
- The acquisition was projected to add 19,000 kg per annum of funded capacity immediately (Slide 3). Furthermore, Slide 7 highlights an additional 128,000+ kg per year capacity in Europe through Aurora Nordic. This aggressive capacity building was a central theme of the 'Green Rush' era, where production volume was viewed as the primary metric for success.
- Which international markets were prioritized in this presentation?
- The deck emphasizes a global footprint covering a combined population of ~588.8 million. Key markets identified on Slide 7 include Germany (wholesale distribution), Denmark (Europe's largest cannabis facility), Italy (government supply), Australia (22.9% interest in Cann Group), South Africa, and the Cayman Islands. The focus was on regions requiring EU GMP certification, creating a barrier to entry for competitors.
- What product categories did CanniMed bring to the Aurora portfolio?
- Beyond dried flower, CanniMed brought high-margin derivative products. Slide 3 highlights cannabis oils with 70+% profit margins, capsule production for the 'baby boomer' demographic, and a recently launched trans-dermal topical cream. Slide 9 also notes the addition of four 'balanced ratio' strains (THC and CBD) to better serve the medical market's needs for symptom relief without intense psychoactive effects.