The January 2018 Aurora investor presentation captures the company at the height of the cannabis 'green rush,' focusing heavily on aggressive infrastructure expansion and strategic acquisitions. Rather than focusing on unit economics or customer acquisition costs, the deck prioritizes production capacity (kg per annum) and the ROI of its equity stakes in other firms like Cann Group and Radient Technologies. With a stated goal of becoming a 'globally dominant cannabis company,' the deck uses massive facility footprints and high-yield projections to justify its valuation. It serves as a histori…
Key takeaways
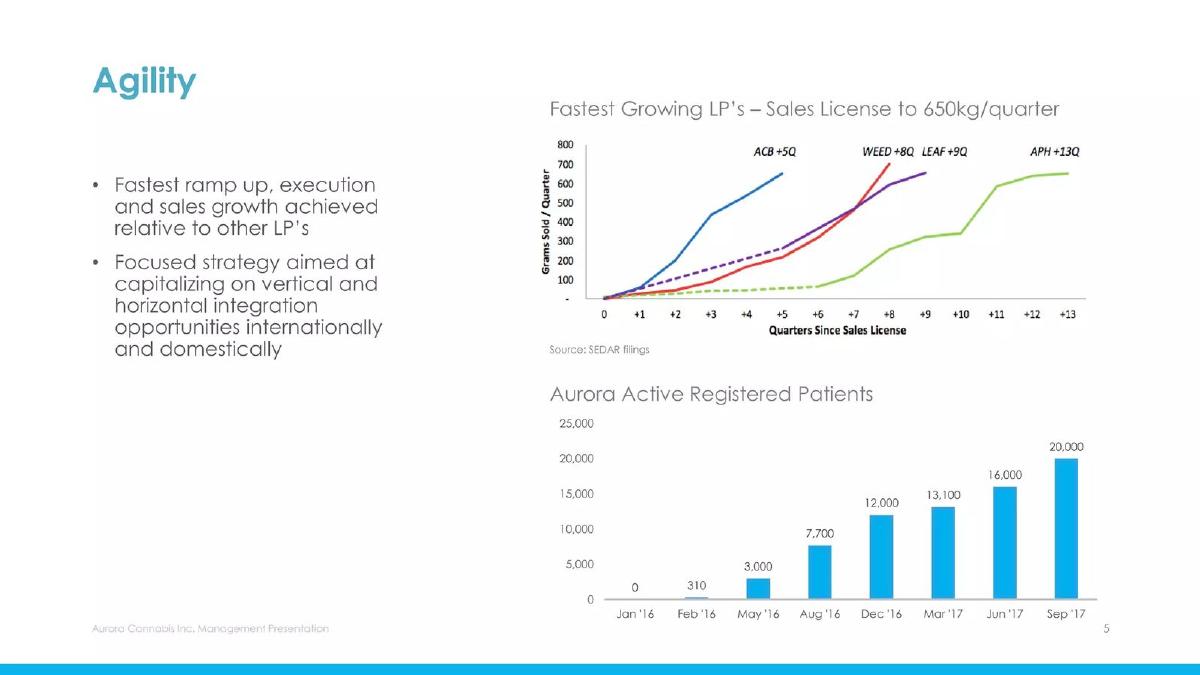
- Aurora positioned itself as the fastest-growing Licensed Producer (LP), reaching 650kg/quarter in five quarters compared to eight or more for competitors (Slide 5).
- The company utilized a heavy M&A strategy, owning 17.62% of TGOD with an option to increase interest to over 50% (Slide 9).
- International expansion was a core pillar, highlighted by a 22.9% stake in Australia's Cann Group which yielded a 330% return on investment (Slide 13).
- Production scale is the primary metric of success, with the 'Aurora Sky' facility projected to reach 100,000+ kg/yr capacity by June 2019 (Slide 17).
- Cost optimization targets are specific, aiming to drive average cash production costs to below $1.00/g as facilities ramp up (Slide 17).
- The investment portfolio was a major value driver, showing a total current value of $174.3 million across three primary holdings (Slide 21).
- Product differentiation focused on high-potency strains, claiming the highest CBD and THC strains in Canada at a $9 per gram price point (Slide 29).
- The deck lacks a traditional 'Ask' slide or a detailed breakdown of the management team's specific bios within the provided 10-slide sample (Slide 33, 37).
Aurora Pitch Deck: The Blueprint for a Global Cannabis Conglomerate
The January 2018 investor presentation from Aurora Cannabis Inc. is a quintessential example of a growth-stage deck in a nascent, capital-intensive industry. At this point in the cannabis market's evolution, investors were less concerned with quarterly profits and more focused on 'land grabs'—the acquisition of licenses, the construction of massive cultivation facilities, and the establishment of international footprints. Aurora’s deck reflects this perfectly, emphasizing capacity, speed, and strategic investments over traditional operational efficiency.
Slide 1: Title and Vision
The cover slide sets a bold tone with the four pillars: AGILITY, INNOVATION, EXECUTION, AND EXPANSION . The subtitle, "Building a globally dominant cannabis company," leaves no room for ambiguity regarding their ambitions. The branding is clean, using a stylized cross/star logo that suggests a medical or scientific foundation, which was critical for legitimacy in 2018.
Slide 5: Agility and Growth Velocity
This slide is the core of Aurora's value proposition to investors. It features two charts. The first, "Fastest Growing LP’s – Sales License to 650kg/quarter," compares Aurora (ACB) against competitors labeled WEED, LEAF, and APH. Aurora claims to have reached the 650kg threshold in just 5 quarters, significantly faster than the 8 to 13 quarters required by their peers. The second chart shows "Aurora Active Registered Patients" growing from 0 in January 2016 to 20,000 by September 2017. This slide effectively argues that Aurora is the most efficient operator in the sector.
Slide 9: Strategic Partnership with TGOD
Aurora highlights its investment in The Green Organic Dutchman (TGOD) as a way to secure premium organic capacity without building it all in-house. Key terms include an initial 17.62% ownership with an option to exceed 50%. The partnership grants Aurora access to 20% of the output from TGOD’s Ancaster and Valleyfield facilities, adding over 20,000 kg p.a. (per annum) to Aurora’s portfolio. This slide demonstrates a sophisticated approach to M&A, using minority stakes to secure supply chains.
Slide 13: Australian Market Opportunity
Expansion into Australia is framed through their 22.9% stake in Cann Group Ltd. The slide notes an initial investment of $6.6 million at AUS $0.30/share, which had grown to a current value of $103.68 million by January 9, 2017 (likely a typo for 2018 given the deck date). They claim a 330% return on investment . This slide serves two purposes: it proves their ability to pick winners in the space and highlights their early-mover advantage in a market with a population of over 24 million.
Slide 17: Operating Metrics and Assumptions
This is the "nitty-gritty" slide for analysts. It breaks down production by facility:
Aurora Mountain: 4,800 kg/yr · Aurora Sky: 100,000+ kg/yr (expected by June 2019) · Vie: 4,000 kg/yr · Lachute Facility: 4,500 kg/yr
Crucially, it sets a target for cash production cost per gram to fall below $1.00/g . This is one of the few efficiency metrics in the deck, signaling to investors that scale will eventually lead to high margins.
Slide 21: Value Creation Through Strategic Investments
Aurora doubles down on its identity as a strategic investor. A table lists three companies: Cann Group, Radient Technologies, and Hempco Food and Fiber. The total investment value is cited at $174.3 million with a weighted average ROI of 330% . The bottom of the slide mentions pending agreements with TGOD and Micron Waste Technologies, reinforcing the image of Aurora as the center of a growing ecosystem.
Slide 25: Facility Features and Innovation
To justify their massive capital expenditures, Aurora details the technology inside their greenhouses. Features include forced air, sealed environments to minimize disease, and a "mobile bench system" for automated plant movement. The focus here is on Yield and Cost Optimization . By highlighting "Harvest to dry" processes and "custom process-flow," they are attempting to move the conversation from agriculture to industrial manufacturing.
Slide 29: Product Quality and Pricing
This slide focuses on the end product. They list 24 distinct strains and 10+ flagship strains. They claim to have the highest CBD and highest THC strains in Canada, with THC levels reaching up to 32%. The pricing is clearly stated: $9 per gram for standard sales and $6 per gram for compassionate pricing. This provides a clear look at their top-line revenue potential per unit of production.
Slide 33 & 37: Leadership and Conclusion
Slide 33 is a transition slide for "Leadership," though the specific bios are not included in this 10-slide set. Slide 37 serves as the summary, reiterating the four pillars (Agility, Innovation, Execution, Expansion) and claiming a "talented, experienced management team driving the sector's fastest growth."
What Aurora Does Well
The deck is exceptionally strong at benchmarking . By constantly comparing their ramp-up speed and production capacity to unnamed but recognizable competitors, they create a sense of urgency and superiority. They also do a great job of quantifying the value of their partnerships . Most startups mention partnerships as vague 'synergies'; Aurora lists the exact percentage of ownership, the dollar value of the ROI, and the specific kilograms of product they are entitled to. This makes the business model feel tangible and grounded in contract law rather than just hope.
What is Missing from the Deck
The most glaring omission in this selection is a clear path to profitability . While they mention reducing production costs to $1.00/g, there is no discussion of SG&A (Selling, General, and Administrative) expenses, which were notoriously high in the cannabis sector during this period. There is also no detailed competitive landscape beyond the growth chart on Slide 5. Investors are not told how Aurora will compete on a brand level once the market becomes saturated with supply. Finally, the specific 'Ask' is missing from these slides—it is unclear how much capital they are looking to raise or what the specific use of proceeds will be for the next round of funding.
Founder Takeaways: What to Copy
1. Use Comparative Velocity: If you are growing faster than your industry average, don't just say it—chart it. Aurora’s Slide 5 is a perfect example of using a competitor's timeline to make your own look impressive. 2. Quantify Your Ecosystem: If your business relies on a network of partners or investments, show the math. Aurora’s Slide 21 turns a list of names into a $174M asset, which is much more compelling to a financier. 3. Connect Tech to Margin: When describing your technology (Slide 25), always link it back to a financial outcome. Aurora doesn't just say they have "forced air"; they say they have it for "Yield and Cost Optimization." Every feature should have a corresponding fiscal benefit.
Frequently asked questions
- What is Aurora's primary competitive advantage according to the deck?
- Aurora identifies 'Agility' as its primary advantage, specifically citing the fastest ramp-up from sales license to 650kg/quarter compared to other Licensed Producers. Slide 5 shows they achieved this in 5 quarters, while competitors like WEED, LEAF, and APH took 8, 9, and 13 quarters respectively. This speed of execution is paired with a strategy of vertical and horizontal integration.
- How does Aurora handle its international market strategy?
- The company uses strategic equity investments to enter foreign markets. Slide 13 details their entry into Australia via a 22.9% stake in Cann Group Ltd. This wasn't just a passive investment; it included a Technical Services Agreement and access to one of the first two licenses issued in Australia, covering cultivation, sales, and R&D.
- What are the key production metrics for their facilities?
- Aurora tracks capacity in kilograms per year (kg/yr). Slide 17 lists Aurora Mountain at 4,800 kg/yr, Vie at 4,000 kg/yr, and the flagship Aurora Sky at a projected 100,000+ kg/yr. A critical financial target mentioned is reducing the cash production cost per gram to below $1.00 as these facilities reach full scale.
- What does the deck reveal about Aurora's investment portfolio?
- Slide 21 shows that Aurora acted almost like a venture fund within the cannabis space. They reported a 330% total ROI on investments in Cann Group, Radient Technologies, and Hempco Food and Fiber. The total current value of these stakes was listed at $174.3 million, suggesting that their balance sheet strength was tied significantly to the market performance of their partners.
- How is the product line structured?
- Slide 29 highlights 24 distinct strains in production, including flagship products like Sundance, Ambition, and Sentinel. They differentiate based on THC and CBD percentages (ranging from <1% to 32% THC) and price their products at $9 per gram, with a $6 per gram 'compassionate pricing' tier for medical patients.