Bringg’s 24-slide Series E deck is a textbook example of late-stage fundraising, prioritizing proof of scale over conceptual explanations. By the time of this 2021 raise, Bringg had already secured $83M in prior funding and reached a 112% 3-year CAGR, as shown on Slide 2. The deck effectively uses a 'David vs. Goliath' narrative, positioning its software as the equalizer for brands like Colgate to compete with the shipping efficiencies of Amazon and Walmart. With a client list featuring McDonald’s, Coca-Cola, and Walmart, the deck moves quickly from the 'why' to the 'how,' detailing a complex…
Key takeaways
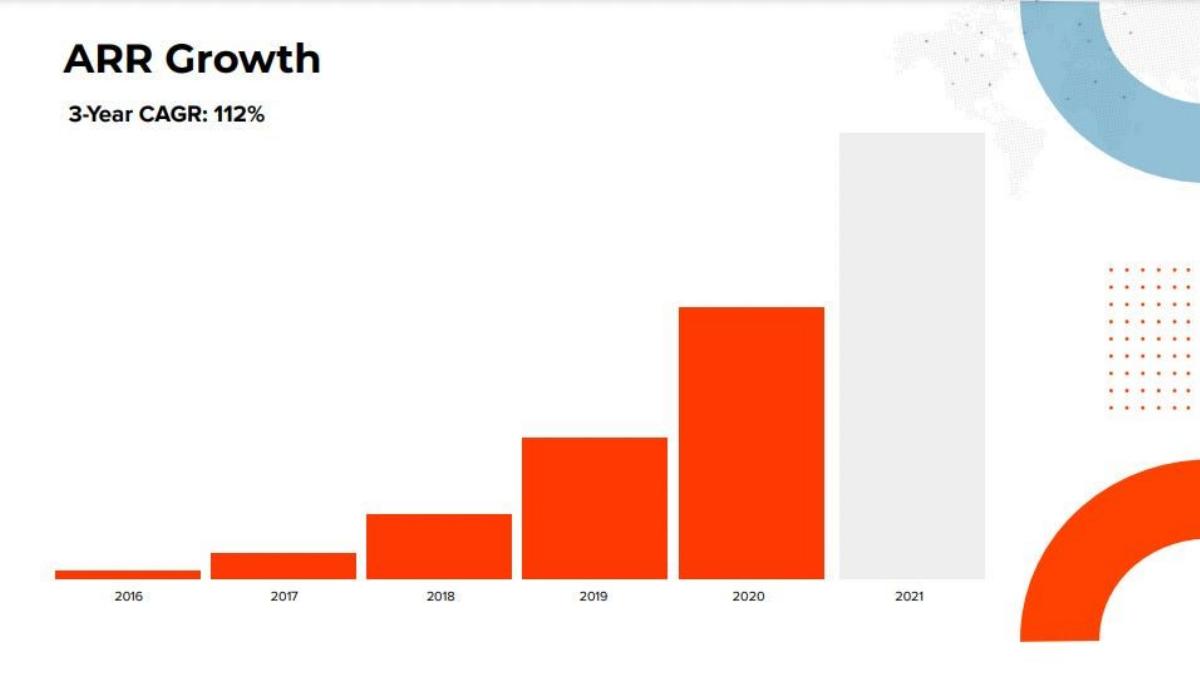
- The company demonstrated exceptional growth with a 3-year CAGR of 112% leading up to 2021 (Slide 2).
- Bringg successfully positioned itself as the 'anti-Amazon' infrastructure for traditional retailers and brands (Slide 3).
- The deck highlights a massive scale of operations, citing approximately 15 million monthly deliveries (Slide 4).
- Enterprise validation is a core pillar, with logos from global giants like Coca-Cola, KFC, and Walmart displayed prominently (Slide 4).
- The presentation identifies 'Last Mile Complexity' as the primary market friction point, listing 14 different delivery variables (Slide 5).
- A sophisticated platform architecture slide illustrates how Bringg sits between customers, internal systems, and third-party delivery providers (Slide 6).
- The deck uses specific case studies to prove speed of implementation, citing a nationwide rollout in just 8 weeks for a major retailer (Slide 8).
- Efficiency metrics are prioritized, specifically highlighting the ability to scale without adding new headcount (Slide 8).
Introduction: The Power of Enterprise Validation
Bringg’s Series E pitch deck, used to raise $100M in 2021, is a masterclass in late-stage storytelling. At this level of fundraising, investors are less interested in the 'vision' and more interested in the 'machine.' The machine Bringg presents is one that processes millions of deliveries for the world’s largest brands. As reported by Business Insider, this round solidified Bringg’s position in the E-commerce and Transportation software sectors, headquartered in the Middle East but operating globally.
Slide 1: The Unified Front
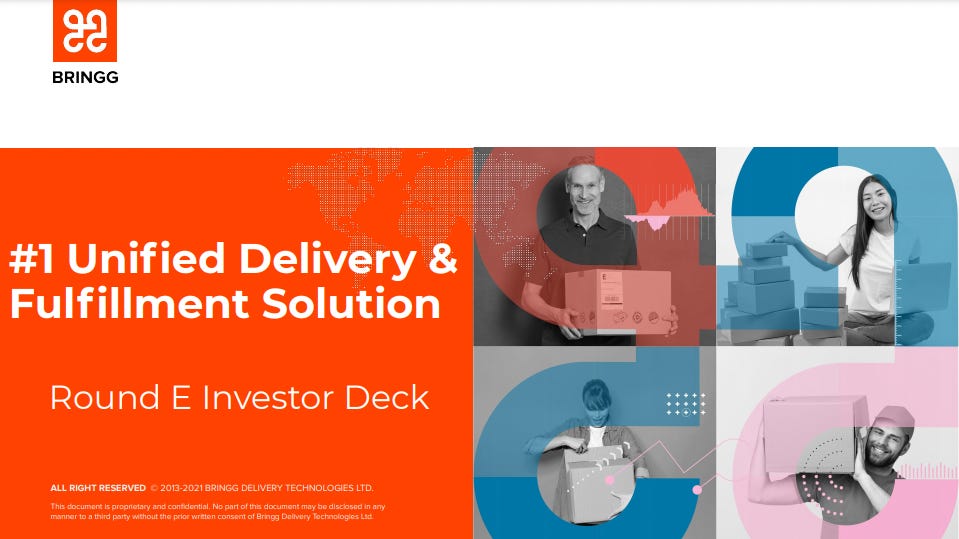
The title slide establishes the company’s primary claim: the '#1 Unified Delivery & Fulfillment Solution.' The imagery is intentionally diverse, showing different stages of the logistics chain—packing, carrying, and receiving. It sets a professional, enterprise-grade tone immediately. The footer notes that the document covers the period from 2013-2021, signaling a mature company with nearly a decade of development behind it.
Slide 2: The Growth Engine
Slide 2 is perhaps the most important slide for a Series E investor. It shows a bar chart of ARR (Annual Recurring Revenue) Growth from 2016 to 2021. While the Y-axis lacks specific dollar amounts, the visual trend is unmistakable. The 3-Year CAGR of 112% is highlighted in the top left. This figure tells investors that not only is the company growing, but it is also maintaining triple-digit momentum even as it scales—a rare feat that justifies a premium valuation.
Slide 3: The Competitive Challenge
This slide shifts from internal metrics to external market pressure. It uses a 'ShopSmiles by Colgate' example to illustrate the problem. A consumer looking at a $20 overnight shipping fee on a brand site is compared to the shipping options at Walmart and Amazon. The slide notes a $20 saving on next-day delivery at Walmart and an $8 saving at Amazon. This positions Bringg not just as a 'nice-to-have' software, but as a survival tool for brands that need to match the logistics efficiency of retail giants.
Slide 4: The Proof of Dominance
If Slide 2 showed the growth, Slide 4 shows the scale. Bringg lists several key company facts: Founded in 2013 , 105% Y/Y Growth , ~15M Monthly Deliveries , and 190 Employees . It also notes $83M Raised prior to this round. The right side of the slide is a 'wall of logos' including Coca-Cola, Walmart, KFC, Panera Bread, and AutoZone. For a Series E investor, this slide removes 'execution risk.' If these global giants trust Bringg with their logistics, the product is clearly enterprise-ready.
Slide 5: Defining Last Mile Complexity
Logistics is messy, and Slide 5 visualizes that mess. It lists various delivery modes: BOPIS/PUDO (Buy Online, Pick Up In Store / Pick Up Drop Off), Curbside , 3PLs , White-glove service , and Same-day deliveries . By labeling this 'Last Mile Complexity,' Bringg defines the 'enemy' they are fighting. The slide suggests that without a unified platform, managing these disparate delivery flows is impossible for a traditional retailer.
Slide 6: The Solution Architecture
This is the 'how it works' slide. It depicts Bringg as a semi-circular hub connecting different ecosystems. On the inner rings, we see Bringg Modules & Capabilities like 'Dispatch & Routing' and 'Fleet & Driver Efficiency.' The outer rings show integrations with Systems (Salesforce, NCR), Customers , and Delivery Providers (Lyft, DoorDash, Uber). This slide communicates that Bringg is the 'connective tissue' of the logistics world, sitting on top of a Cloud Platform and a Data Lake .
Slide 7: The Omnichannel Fulfillment Flow
Slide 7 simplifies the user journey into five steps: Delivery/Pickup Scheduling , Delivery Planning , JIT Order Preparation , Handoff To Driver/Customer , and the Omnichannel Fulfillment Experience . The bottom banner reinforces their value proposition: helping brands 'engineer cost-efficient delivery and fulfillment models.' This slide bridges the gap between the high-level architecture of Slide 6 and the practical reality of how a package moves.
Slide 8: The Case Study (Leading Party Goods Retailer)
The final slide in this sequence provides concrete results. For a 'Leading Party Goods Retailer,' Bringg achieved 300K orders in the first three months and went live just 3 weeks from contract . Most impressively, they claim a nationwide curbside rollout in 8 weeks —before the holiday peak. Efficiency metrics include 0 new headcount required and a 100% real-time operational visibility . Customer experience metrics show a +50% JIT curbside pickup rate , a +6% CSAT boost , and a 10% decrease in wait-related complaints . This is the 'closer' slide that proves the software delivers a high ROI.
What Works in the Bringg Pitch Deck
The most effective element of this deck is the relentless focus on scale . By the time an investor reaches Slide 4, they have seen triple-digit growth and a list of the world's most recognizable brands. This creates a 'fear of missing out' (FOMO) by suggesting that Bringg is already the category winner.
Another strength is the problem-solution alignment . Slide 3 clearly identifies why brands are losing (shipping costs) and Slide 8 shows exactly how Bringg solves it (efficiency and speed). The use of a specific case study with hard percentages (like the 10% decrease in complaints) makes the value proposition tangible rather than theoretical.
What is Missing from the Bringg Pitch Deck
While the 8 slides provided are high-quality, there are notable omissions that were likely in the other 16 slides of the full 24-slide deck. First, there is no mention of unit economics . While ARR growth is shown, there is no data on Customer Acquisition Cost (CAC) or Lifetime Value (LTV), which are critical for a $100M round. Second, there is no competitive landscape slide comparing Bringg to other logistics orchestration platforms like FarEye or Locus. Finally, the 'Ask' is missing ; we know from external reports they raised $100M, but the deck itself (in these slides) does not specify the amount or the intended use of funds.
What Founders Should Copy
The 'Anti-Giant' Positioning: If you are building for the enterprise, show your customers how you help them fight the industry's biggest threat (e.g., Amazon). · The 'Wall of Logos': Don't just list customers; group them to show market breadth. Bringg shows retail, food, and logistics providers all in one view. · Speed-to-Value Metrics: Highlighting that a nationwide rollout took only 8 weeks is a massive selling point for enterprise software, which is notoriously slow to implement. · Visualizing Complexity: Use slides like Slide 5 to show you understand the 'mess' of the industry. It builds trust that your solution was built for the real world, not a vacuum. · CAGR as a Headline: If your growth is over 100%, make it the biggest text on your traction slide. It is the single most important metric for growth-stage investors.
Frequently asked questions
- What was the primary goal of the Bringg Series E deck?
- The deck aimed to secure $100M in growth capital by proving that Bringg had become the industry standard for delivery orchestration. It focused on high-growth metrics (112% CAGR) and a blue-chip customer base to justify a late-stage valuation and demonstrate that the product could handle the complexity of global enterprise logistics.
- How does Bringg frame the competitive landscape?
- Rather than focusing on direct software competitors, Bringg frames the 'threat' as the delivery dominance of Amazon and Walmart. Slide 3 shows how a brand like Colgate loses customers due to high shipping costs ($20) compared to Amazon’s $8 savings, positioning Bringg as the tool that allows these brands to close that gap.
- What specific metrics does Bringg use to show traction?
- The deck highlights three major pillars of traction: financial growth (112% 3-year CAGR), operational volume (~15M monthly deliveries), and organizational scale (190 employees). These figures, found on Slides 2 and 4, provide a comprehensive view of the company's health at the time of the raise.
- Does the deck explain the technical product in detail?
- Yes, Slide 6 provides a 'Unified Delivery & Fulfillment Platform' map. It shows how the software orchestrates data between 'Systems' (like Salesforce and NCR), 'Delivery Providers' (like Lyft and DoorDash), and 'Operations' (like warehouses and dark stores), emphasizing its role as a central nervous system.
- What is missing from the provided Bringg slides?
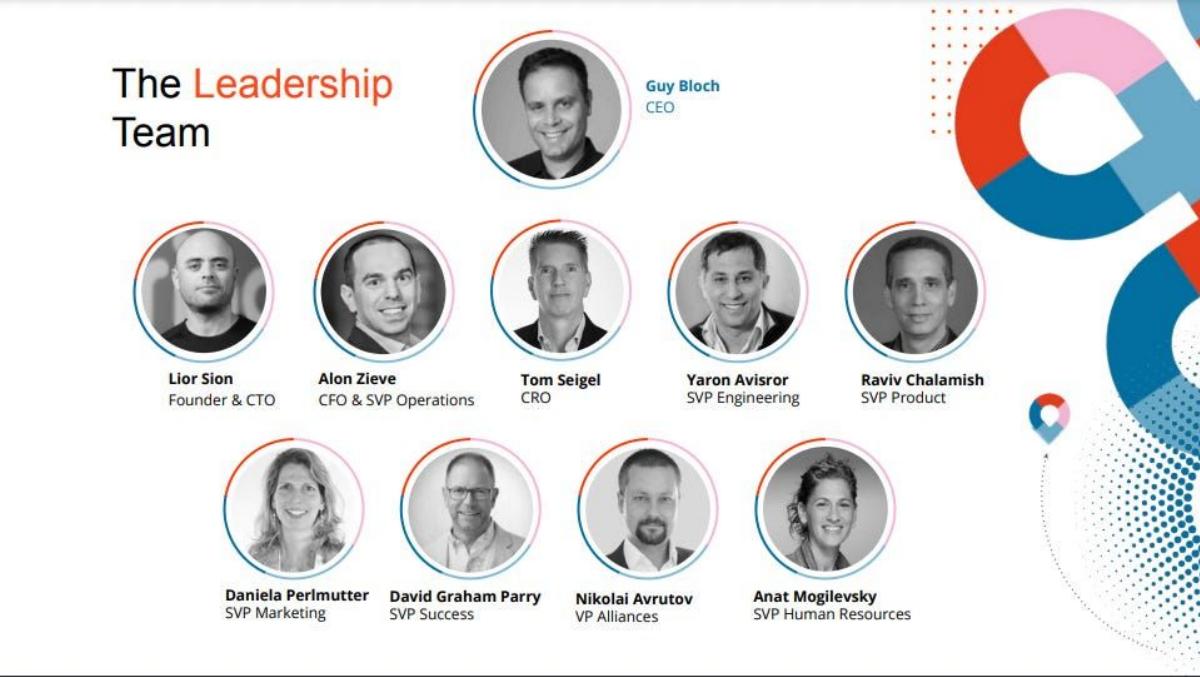
- Based on the 8 slides analyzed, the deck lacks a specific 'Ask' slide detailing how the $100M would be spent, a detailed 'Team' slide showing executive pedigree, and a clear 'Exit' or 'Future Roadmap' slide. These may have been present in the full 24-slide version but are absent here.