The 2014 Chobani deck is not a typical startup pitch; it is a Private Equity 'post-mortem' and forward-looking operational plan following a $671 million investment by TPG. At the time, Chobani was the market leader in the US Greek yogurt category, which grew from 2% of spend in 2007 to 48% in 2013 (Slide 3). However, rapid expansion funded by debt led to a liquidity crisis, with EBITDA falling to -$87 million in Q4 2013 (Slide 7). The deck details a brutal assessment of operational failures, including $76 million in identified waste (Slide 27) and massive order fulfillment issues (Slide 31).…
Key takeaways
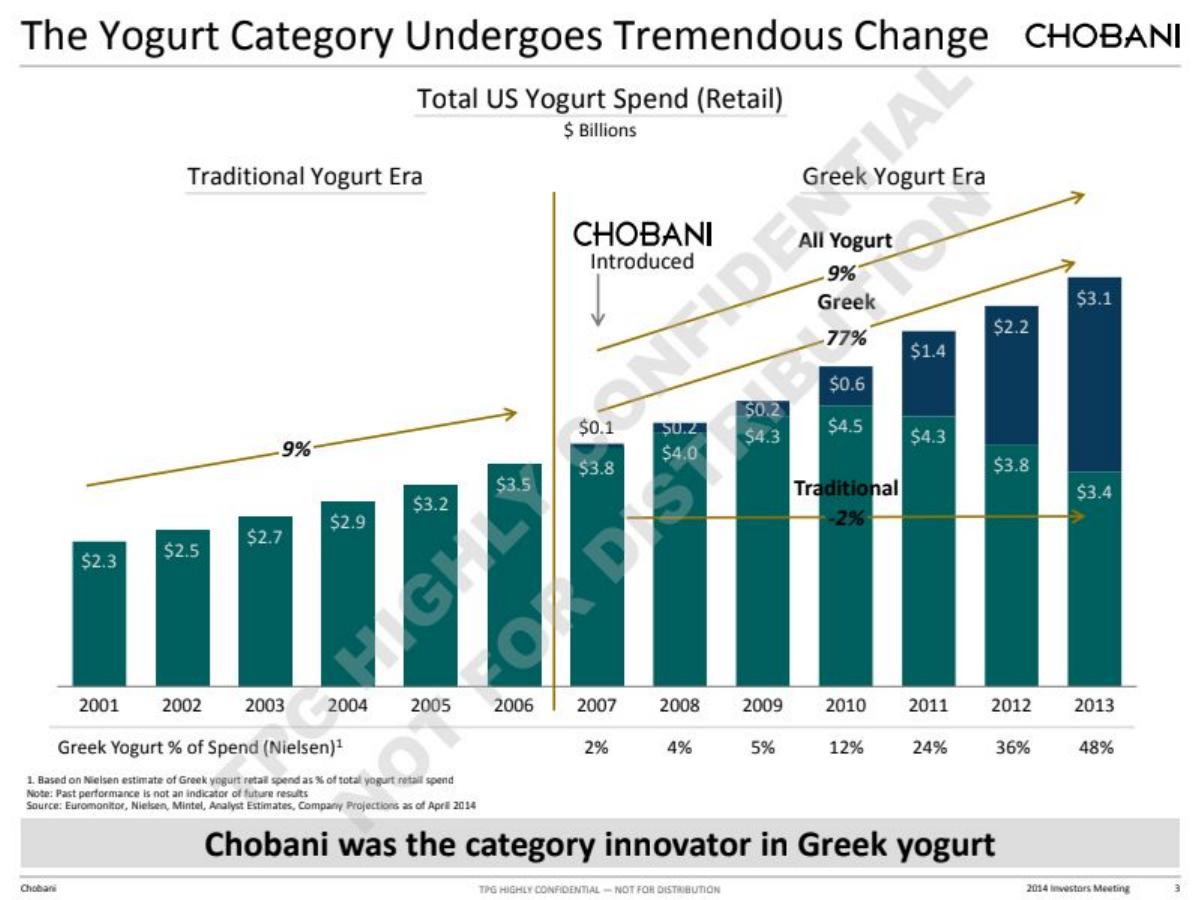
- Greek yogurt spend as a percentage of total US yogurt retail spend exploded from 2% in 2007 to 48% in 2013 (Slide 3).
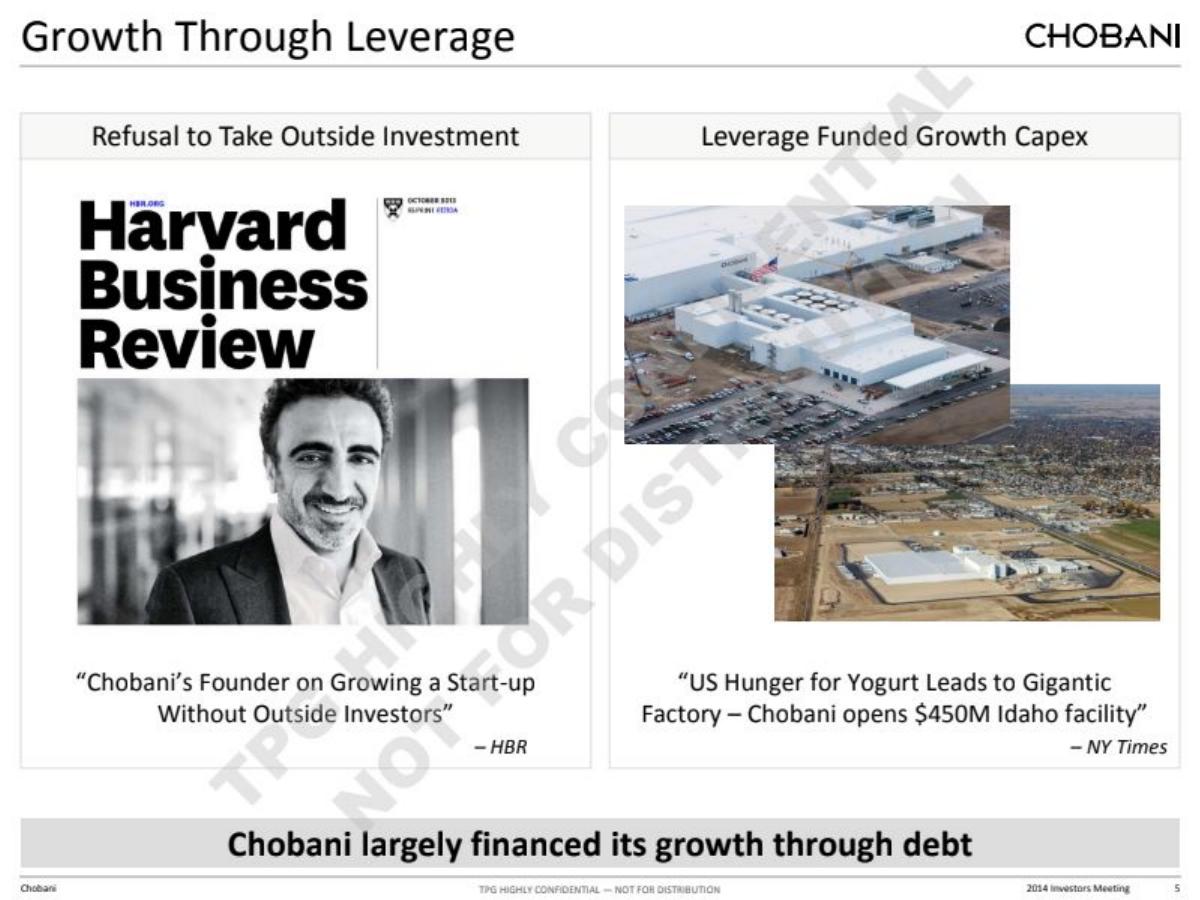
- Chobani's refusal to take outside equity early led to a $450M facility expansion funded primarily through debt (Slide 5).
- The company faced a severe liquidity crisis in late 2013, with net debt reaching $708 million by Q4 (Slide 7).
- TPG's investment was structured as a $750 million second-lien term loan with 'teeth' and equal board representation (Slide 19).
- Operational inefficiency was rampant, with $76 million in waste identified across finished goods, raw materials, and milk yield (Slide 27).
- Customer service was a major failure point, with unfulfilled orders ('cuts') peaking at over 200,000 cases in a single week in 2014 (Slide 31).
- Despite operational woes, Chobani maintained a 14% higher velocity than its closest competitor, despite significantly lower distribution points (Slide 41).
- The 'Pumpkin Spice' launch in 2014 became the fastest-selling product in company history, reaching 51,000 cases sold by week 6 (Slide 43).
Introduction: The Price of Hypergrowth
The Chobani 2014 deck is a rare artifact in the world of fundraising. It is not a deck designed to sell a dream; it is a deck designed to manage a turnaround. By 2014, Chobani was a household name, but behind the scenes, the company was struggling with the weight of its own success. Having funded a $450 million expansion through debt, the company faced a liquidity crunch that required a massive intervention from TPG Capital. This teardown examines the 22 available slides from a 44-slide presentation used during the 2014 Investors Meeting.
Slide 1: The TPG Investment Summary
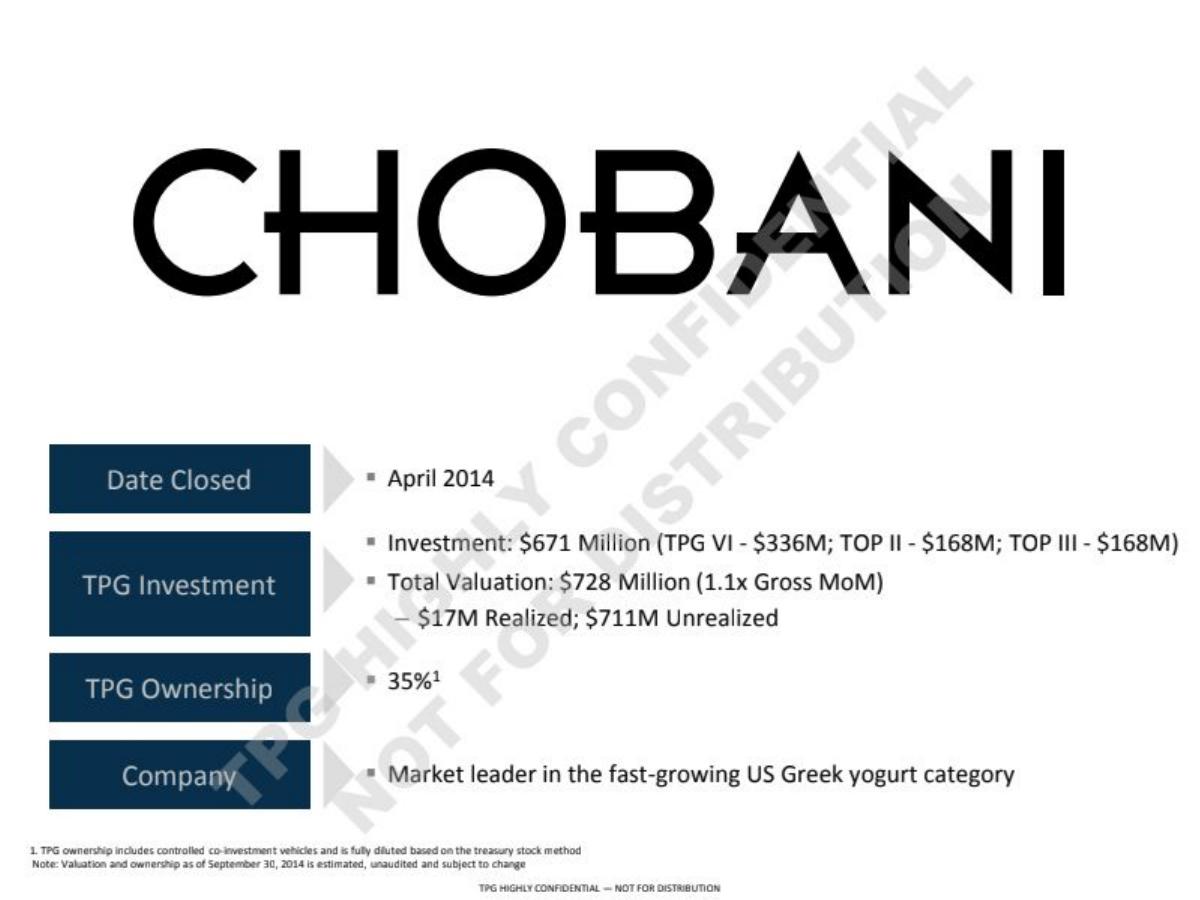
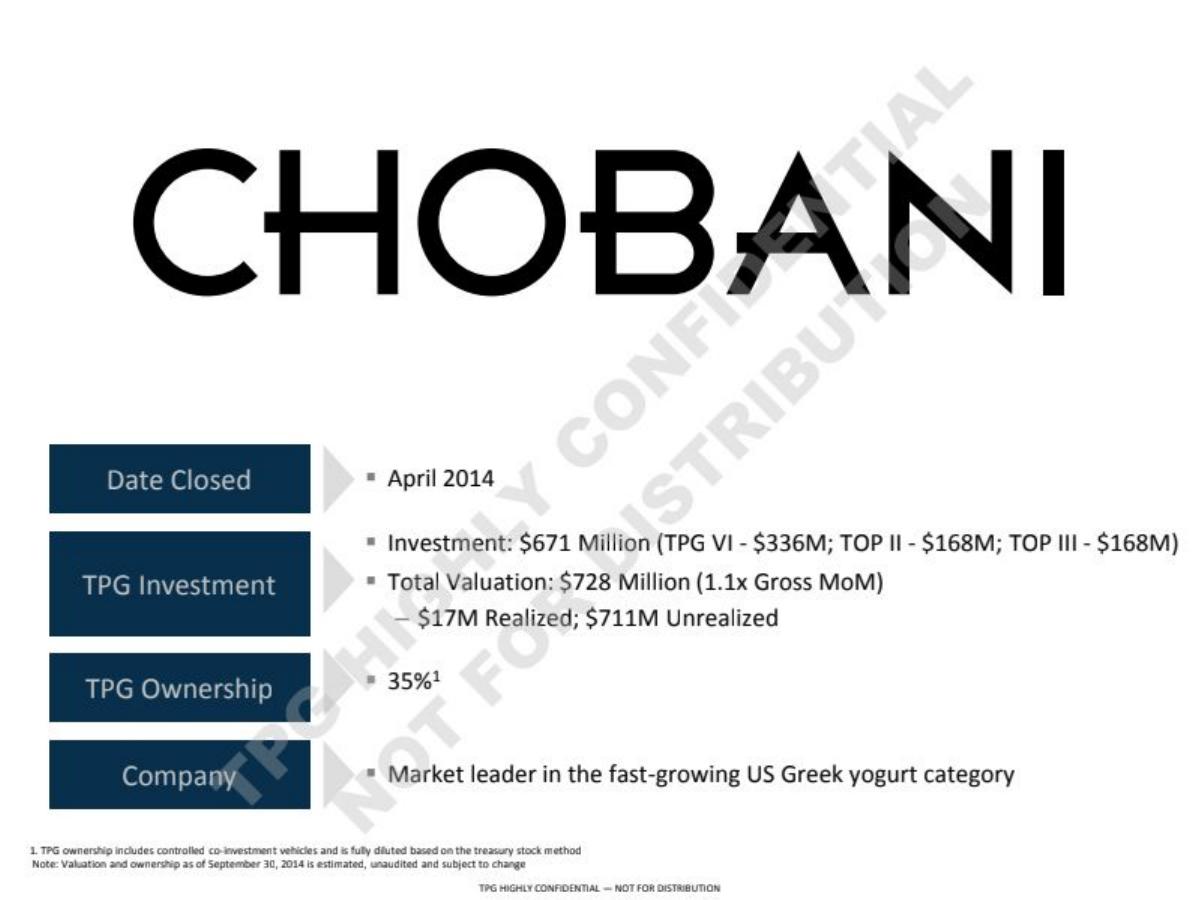
The cover slide establishes the stakes. It notes a Date Closed of April 2014 with a total investment of $671 Million across multiple TPG funds (TPG VI, TOP II, and TOP III). Interestingly, it lists a Total Valuation of $728 Million , which reflects a 1.1x Gross MoM (Money on Money) at that specific snapshot. TPG's ownership is cited at 35% . The company is simply described as the "Market leader in the fast-growing US Greek yogurt category."
Slide 3: The Greek Yogurt Revolution
This slide provides the macro context for Chobani's rise. It divides the market into the "Traditional Yogurt Era" (pre-2007) and the "Greek Yogurt Era." In 2001, the total US yogurt spend was $2.3 billion, with Greek yogurt representing a negligible fraction. By 2013, the market had grown to $6.5 billion , with Greek yogurt capturing 48% of the spend . The chart shows Chobani's introduction in 2007 as the catalyst for a 77% CAGR in the Greek segment, while traditional yogurt spend actually declined by 2% in the later years.
Slide 5: Growth Through Leverage
Slide 5 highlights the founder's philosophy: a "Refusal to Take Outside Investment." It features a Harvard Business Review cover and a New York Times headline about the $450M Idaho facility . The takeaway here is that Chobani "largely financed its growth through debt." While this allowed the founder to maintain control, it created the financial pressure that necessitated the TPG deal.
Slide 7: The Liquidity Crisis
This is the most critical financial slide in the deck. It shows 2013 Quarterly EBITDA plummeting from $21 million in Q1 to a staggering loss of $87 million in Q4 . Simultaneously, 2013 Quarterly Net Debt rose from $534 million to $708 million . The bottom banner is blunt: "Earnings declines forced Chobani to restructure its balance sheet." This is the 'Why' behind the investment.
Slides 9-15: The Deal Evolution
These slides use a timeline to show the "iterations" of the deal. It began in February 2014 as a minority equity deal (Slide 9), but as "liquidity became tight" and the "clock was ticking" (Slide 11), the deal shifted to a structured security. Slide 13 notes a leak to the New York Times, and Slide 15 shows the final re-indication with "numerous added protections and rights" for TPG as the liquidity deadline loomed (20-30 days out).
Slide 17: The Napkin
In a rare moment of informal history, Slide 17 shows a photo of a hand-drawn napkin or scratchpad. It outlines the basic economics of the deal, including "Addl Liquidity," "Hamdi Share Sales," and mentions of "TPG 600 -> 650." It serves as a reminder that even billion-dollar restructurings often coalesce around a simple sketch of terms.
Slide 19: Downside Protection
This slide details the Chobani Capital Structure . TPG's $750 million sits as a Second Lien Term Loan , positioned between the Bank's $405 million First Lien Debt and the Founder's Equity. Key terms include:
$1 billion of capex in the ground (collateral) · 2nd lien with teeth · L + 400 cash, 800 PIK interest · 6 year maturity · Equal board representation with Founder
Slide 21: The Honest Assessment
The deck splits the company's status into "What We Loved" and "What We Needed to Fix." The 'Bad News' is extensive: little focus on cost, large amounts of waste, poor customer service, and an under-developed sales team. This slide sets the stage for the operational turnaround plan that occupies the rest of the deck.
Slide 23: Procurement Savings
Chobani's Spend Base is listed at $1.352 Billion . The largest buckets are Milk ($404M), SG&A ($255M), and Other Plant Operations ($179M). The deck claims $10 million saved to date with a target of $30 million . To achieve this, they added a Chief Procurement Officer and several directors focused on Milk, Dairy, and Fruit.
Slide 25: The Twin Falls Facility
The Idaho plant is described as the "Largest yogurt plant in the world." Despite a total capital spend of $530 million , the slide notes that Chobani "needs help to operate" it. Management volume projections showed a target of 943 million pounds of production by 2018, a 26% CAGR from 2014.
Slide 27: Measuring Waste
The operational inefficiency is quantified here. TPG identified $76 million of waste across the company. The breakdown includes:
$33M: Finished Goods · $18M: Raw Material · $12M: Milk Yield · $13M: Product Donations
The photos on the left show overflowing bins of discarded product, illustrating the "complicated" nature of yogurt making when poorly managed.
Slide 31: Fixing Customer Service
Slide 31 tracks "Cuts" (unfulfilled orders). In early 2014, the company was failing to deliver massive amounts of product, with Week 6 seeing 196,544 cases unfulfilled . The bar chart shows a successful downward trend, moving from an average of 80,000 cases in 1H 2014 to just 2,000 cases in the "Last Week" of the report.
Slide 33: Sales Team Upgrade
To fix the "under-developed sales team," Chobani increased its Sales FTEs from 41 in July to a projected 68 by end of year . More importantly, they increased account coverage for major retailers. For example, Kroger went from 0 dedicated sales staff to 4 , and Costco went from 0 to 3.
Slide 37: Market Share Recovery
This slide shows a volatile market share trend. Chobani's share of yogurt sales in dollars hovered around 18% in 2013 but dipped to 16.3% in September 2014 . The October 2014 data shows a slight recovery to 16.8% , which the deck frames as the beginning of a recovery against incumbents Dannon and Yoplait.
Slide 41: Velocity and Distribution
This is the strongest argument for Chobani's brand power. Chobani had a 14% higher velocity than its closest competitor (5,500 vs 4,828 for Fage). However, its Total Distribution Points (3,150) were roughly half those of Dannon (6,309) and Yoplait (5,865). The "distribution upside" is the primary growth lever identified for investors.
Slide 43: Pumpkin Spice Mania
The deck concludes with a success story. The Pumpkin Spice limited batch was the "fastest-selling product launch in company history," growing from 1,000 cases in the launch week to 51,000 cases by Week 6 . This serves as proof that the brand's innovation pipeline remained potent despite the operational struggles.
What Works in This Deck
Brutal Honesty: Unlike seed-stage decks that hide flaws, this PE deck puts the "Bad News" front and center. By quantifying the $76 million in waste and the 200,000 cases of unfulfilled orders, the deck makes the turnaround plan feel concrete and achievable. Investors love a problem that can be solved with better management rather than just hope.
Structural Clarity: The explanation of the capital structure (Slide 19) is a masterclass in communicating complex financial instruments. It clearly shows where TPG sits in the stack and what protections they have, which is vital for a deal of this size.
Velocity vs. Distribution: Slide 41 is the most compelling "Growth" slide. It uses industry-standard metrics (Nielsen data) to show that the product is a winner (high velocity) and that the failure is purely operational/logistical (low distribution). This is the perfect setup for a Private Equity play.
What is Missing
Unit Economics: While the deck discusses procurement savings and total spend, it lacks a slide showing the contribution margin per cup of yogurt. We see the aggregate losses, but not the fundamental profitability of the product itself at the shelf level.
Competitor Response: The deck mentions Dannon and Yoplait as incumbents but does not detail how they were responding to the Greek yogurt surge. Given that Chobani's market share was dipping (Slide 37), more detail on the competitive landscape would have been useful.
Detailed Team Slide: While it mentions "Additions to the Team" (Slide 23), there is no comprehensive team slide showing the backgrounds of the new executives brought in to lead the turnaround. In a management-heavy play like this, the 'Who' is as important as the 'What.'
What a Founder Should Copy
The "Five Priorities" Framework: Slides 29 and 35 use a simple, numbered list to focus the entire presentation. Every subsequent slide maps back to one of these five goals. This prevents the deck from feeling like a random collection of data points.
Visualizing Operational Metrics: Most founders focus on 'vanity metrics' like total users. Chobani's focus on "Cuts" (Slide 31) and "Waste" (Slide 27) shows a deep understanding of the business's health. Founders in physical product spaces should adopt this level of operational transparency.
The Timeline of the Deal: Showing the evolution of the deal (Slides 9-15) is a great way to build a narrative of momentum and necessity. It explains why the deal is structured the way it is, preventing questions about why they didn't just do a simple equity round.
Conclusion
The Chobani 2014 deck is a sobering look at what happens when a company outgrows its operational capabilities. It is a story of a brilliant product and a powerful brand nearly undone by debt and inefficiency. For founders, it serves as a warning against over-leverage; for investors, it is a blueprint for how to use data and structured terms to rescue a category leader.
Frequently asked questions
- Why did Chobani need a $750 million investment if they were the market leader?
- As shown on Slide 5 and Slide 7, Chobani chose to fund its massive growth—including a $450 million Idaho facility—through debt rather than equity. By Q4 2013, the company hit a wall: EBITDA turned sharply negative (-$87M) while net debt climbed to $708M. They were essentially a victim of their own rapid scaling, lacking the operational maturity to manage the costs of their massive infrastructure.
- What was the structure of the TPG deal?
- This was not a standard venture equity round. Slide 19 details a 'Downside Protected' structure. TPG provided a $750 million Second Lien Term Loan. The terms included L + 400 cash interest, 800 PIK (Payment-in-Kind) interest, a 6-year maturity, and equal board representation with the founder. This allowed the founder to retain significant equity while giving TPG senior security and high yield.
- How did Chobani plan to improve its margins?
- The deck focuses heavily on 'Procurement Savings' and 'Stopping the Waste.' Slide 23 targets $30 million in savings by hiring a new procurement team to tackle costs in milk, fruit, and packaging. Slide 27 identifies $76 million in waste, specifically targeting $33 million in finished goods loss and $18 million in raw material waste at the Twin Falls facility.
- What was the 'Bad News' mentioned in the deck?
- Slide 21 is unusually honest for a pitch deck. It lists 'What We Needed to Fix,' including a lack of focus on cost, large amounts of waste in plants, poor customer service, an under-developed sales team, and a poor market share trend. This transparency is typical of PE-backed turnaround plans where the investor has already performed deep due diligence.
- How did Chobani's sales performance compare to incumbents like Yoplait?
- Slide 41 shows that Chobani had the highest 'velocity' (sales per point of distribution) in the category—14% higher than the closest competitor. However, its 'Total Distribution Points' were significantly lower than Dannon or Yoplait. This represented a massive growth opportunity: if Chobani could match the distribution footprint of the incumbents, its superior velocity would drive dominant market share.