China Wind International Corp.’s 2010 deck is a classic example of an infrastructure-heavy project finance pitch. Rather than focusing on proprietary technology, the company leans heavily on its regulatory moat—specifically the National Renewable Energy Law of 2006, which obligates the grid to purchase all output. The presentation details a five-phase development plan totaling 546 MW, with a longer-term potential of 1,150 MW. Financially, the company targets a 12-14% levered equity IRR, supported by a 70/30 debt-to-equity ratio. The deck is notable for its transparency regarding project econo…
Key takeaways
- The company relies on the National Renewable Energy Law of 2006 to guarantee that the grid must purchase all power output (Slide 7).
- Development is structured across five phases, targeting an initial 546 MW with long-term potential for 1,150 MW (Slide 10).
- Phase 2 was actively under construction in January 2010, with 2 turbines installed and 24 on order (Slide 13).
- Project financing is consistently modeled at 70% bank debt and 30% equity (Slide 13, 16).
- Targeted project economics for a 49 MW project include an EBITDA of US $8.3M on US $10.4M total revenue (Slide 19).
- Carbon credits represent a significant secondary revenue stream, estimated at US $1.8M annually for a standard 49 MW project (Slide 19).
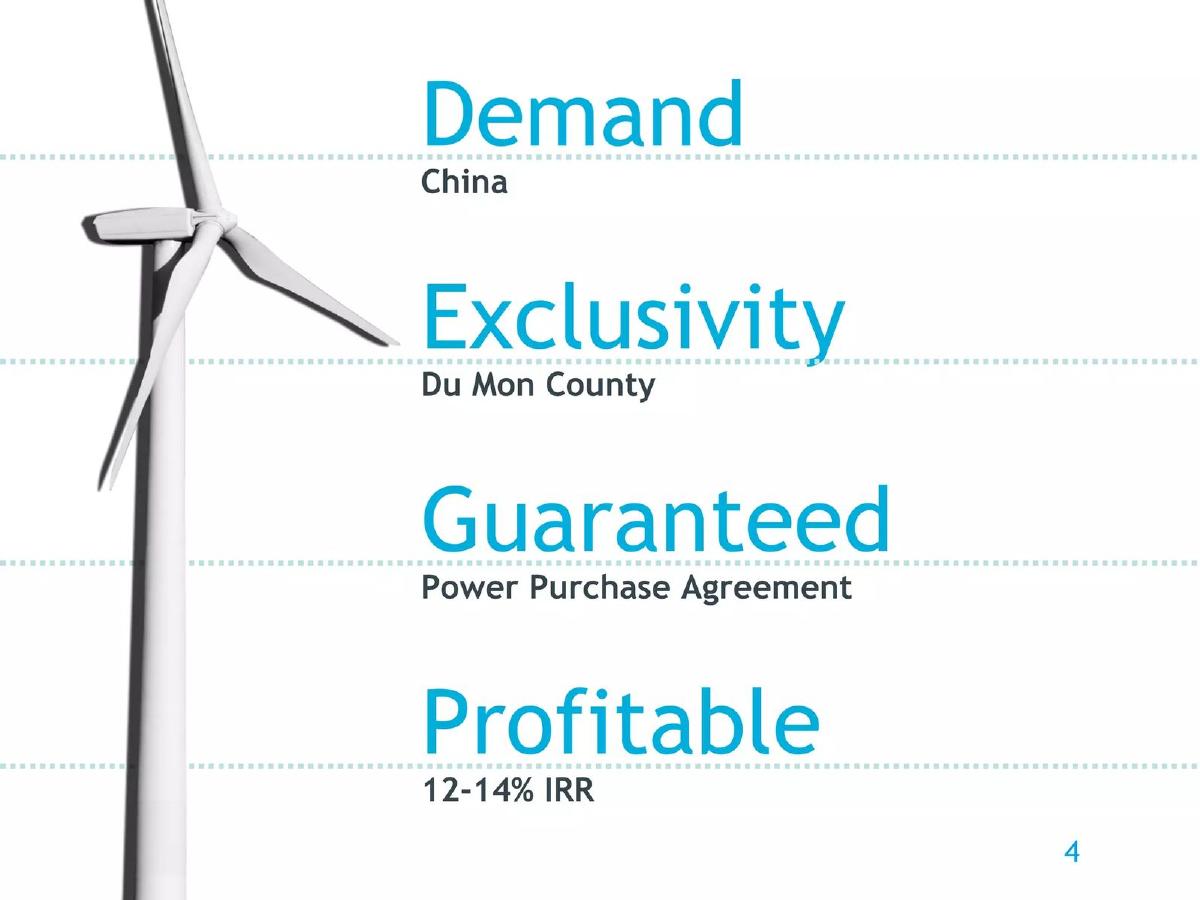
- The company claims exclusivity in Du Mon County, providing a geographic competitive advantage (Slide 4).
- Capital costs are explicitly stated at US $1.5 million per MW (Slide 19).
Executive Summary: The Infrastructure Playbook
The China Wind Investor Presentation from January 2010 serves as a historical blueprint for renewable energy infrastructure development. At a time when China was rapidly expanding its green energy footprint, China Wind International Corp. positioned itself not as a tech innovator, but as a disciplined executor of large-scale utility projects. The deck is characterized by its focus on regulatory tailwinds, geographic exclusivity, and transparent project-level unit economics. By removing the uncertainty of demand through government mandates, the company presents a lower-risk, steady-return profile typical of the utility sector.
Slide 1: Title and Branding
The cover slide is functional and dated, featuring the company name 'China Wind Power International Corp.' and a clear timestamp of January 2010. The logo incorporates a stylized wind turbine, immediately signaling the sector. The use of a blue sky background with clouds is a standard aesthetic choice for renewable energy firms, emphasizing 'clean' operations.
Slide 4: The Four Pillars of the Investment Thesis
Slide 4 serves as the high-level summary of why an investor should care. It breaks the opportunity down into four distinct categories: Demand (China's growing energy needs), Exclusivity (specifically mentioning Du Mon County), Guaranteed (referencing Power Purchase Agreements), and Profitable (citing a 12-14% IRR). This slide is effective because it addresses the four biggest risks in infrastructure: market risk, competition risk, off-take risk, and financial return.
Slide 7: Regulatory Moat and Guaranteed Demand
This is perhaps the most critical slide in the deck. Titled 'We make it, they take it,' it cites the National Renewable Energy Law, effective January 2006. The slide explicitly states that the 'Grid is obligated to purchase all output!' and identifies the Heilongjiang Provincial Power Grid as the specific buyer. For an investor, this slide mitigates the primary concern of any commodity business: finding a customer. The legal requirement for the grid to buy the power turns the project into a quasi-bond, where the main risk is operational uptime rather than market price volatility.
Slide 10: Portfolio and Geographic Strategy
Slide 10 provides a map of China, highlighting the company's focus area north of Beijing and Shanghai. It quantifies the portfolio at 546 MW over five development phases. Crucially, it mentions that these projects are 'Included in power grid master plan,' which further reinforces the regulatory alignment mentioned on Slide 7. The mention of a 'Longer-term potential for building out 1,150 MW' provides the 'blue sky' potential necessary to justify a long-term investment, showing that the company has room to grow beyond its current pipeline.
Slide 13: Phase 2 Execution Status
This slide moves from theory to execution. It uses a tabbed interface to show the status of Phase 2 (49.5 MW). The metrics are granular: 24 turbines on order, 9 delivered, and 2 installed. This level of detail builds credibility, showing that the company is actively managing supply chains and construction. The financing breakdown (70% bank, 30% equity) is standard for the industry, though the footnote 'awaiting final approval from Bank headquarters' flags a pending milestone that investors would need to track.
Slide 16: Future Pipeline (Phases 3 to 5)
Continuing the tabbed format, Slide 16 looks at the 448.5 MW pipeline. It shows that Phase 3 feasibility studies are complete, while Phases 4 and 5 are underway. By planning for 299 turbines, the company demonstrates the scale of its ambitions. The financing remains consistent at the 70/30 split, suggesting a repeatable financial model that can be applied to each subsequent phase as the previous one reaches completion and de-risks.
Slide 19: Targeted Project Economics
The final slide in this set provides a 20-year average for a standard 49 MW project. It is a masterclass in transparency for project finance. It lists Revenue from wind power (US $8.5M) and Revenue from carbon credits (US $1.8M). The inclusion of carbon credits is a vital detail, as it represented a significant portion of the 'green' subsidy regime in 2010. The slide also lists a capital cost of US $1.5 million per MW, a key benchmark for investors to compare China Wind against global peers. With an EBITDA of US $8.3M on US $10.4M in revenue, the margins are exceptionally high, though these are likely 'project-level' rather than 'corporate-level' figures.
What Works in This Deck
The deck excels at de-risking the investment through third-party validation. By citing national laws and provincial grid obligations, the founders move the burden of proof from their own projections to the Chinese government's policy framework. The use of specific, granular numbers—such as the exact number of turbines delivered versus installed—creates a sense of operational control. Furthermore, the standardized project model (49 MW units) suggests that the company has found a 'cookie-cutter' approach to scaling, which is highly attractive to institutional investors who prefer predictable, repeatable execution over bespoke, complex projects.
What Is Missing
The provided slides omit several key components required for a full due diligence process. First, there is no team slide . In infrastructure, the track record of the engineers and the political connections of the executives are paramount. Second, there is no mention of the 'Ask.' While the financing split is shown, the deck doesn't specify how much equity capital is being raised in this specific round or what the valuation is. Third, there is no competitor analysis . While they claim exclusivity in one county, they do not address other major state-owned or private wind developers who might be competing for grid capacity or turbine supply. Finally, there is no discussion of technical risks , such as wind intermittency or grid curtailment, which are common issues in the Heilongjiang region.
Founder's Takeaway: Copy the Clarity
Founders in the climate-tech or infrastructure space should copy the economic transparency of Slide 19. Many decks hide behind vague 'market size' numbers, but China Wind breaks down exactly how a single unit of their business makes money, including secondary revenue streams like carbon credits. Additionally, the regulatory alignment shown on Slide 7 is a powerful tool. If your business benefits from a specific law or mandate, that should be the centerpiece of your pitch. It transforms your company from a 'hopeful startup' into an 'inevitable participant' in a government-mandated transition.
Frequently asked questions
- What is the primary value proposition of China Wind?
- The value proposition is built on regulatory certainty and guaranteed off-take. By citing the National Renewable Energy Law, the company removes the 'market risk' of finding buyers for its power. It positions itself as an infrastructure developer that 'makes it' while the Heilongjiang Provincial Power Grid is legally obligated to 'take it,' ensuring steady cash flows.
- How does the company plan to finance its massive wind farms?
- China Wind utilizes a standard project finance structure consisting of 70% bank debt and 30% equity. Slide 13 notes that for Phase 2, the bank portion was 'awaiting final approval from Bank headquarters,' indicating that the company acts as the developer/sponsor while seeking external institutional capital to leverage its equity.
- What are the projected returns for investors?
- The deck targets a levered equity Internal Rate of Return (IRR) of 12-14%. This is based on a 20-year average for a 49 MW project. The economics are supported by a high EBITDA margin, where US $8.3M of the US $10.4M in revenue is retained before interest, taxes, depreciation, and amortization.
- What is the current status of their development pipeline in the deck?
- As of the January 2010 presentation, Phase 1 (49 MW) appears complete or operational, Phase 2 (49.5 MW) is under construction with turbines being delivered, and Phases 3 through 5 (448.5 MW) are in various stages of feasibility studies. This shows a clear progression from proven execution to future scale.
- Does the deck mention any technological advantages?
- No. The provided slides focus entirely on project management, location exclusivity, regulatory compliance, and financial modeling. There is no mention of proprietary turbine design or intellectual property; the company operates as a developer and power producer rather than a hardware manufacturer.