Chiper's 2021 Series B deck is a masterclass in demonstrating market dominance and operational efficiency in a fragmented industry. By focusing on the 'tienditas' or corner stores of Latin America, Chiper addressed a $500B TAM where less than 1% of transactions were online. The deck highlights a 7x revenue run rate growth and a 9x increase in monthly active stores within a single year. With a clear contribution profit of $1.00 per order and a roadmap to triple that, Chiper successfully argued for the scalability of their B2B ecosystem. The inclusion of heavy-hitting investors like Tiger Globa…
Key takeaways
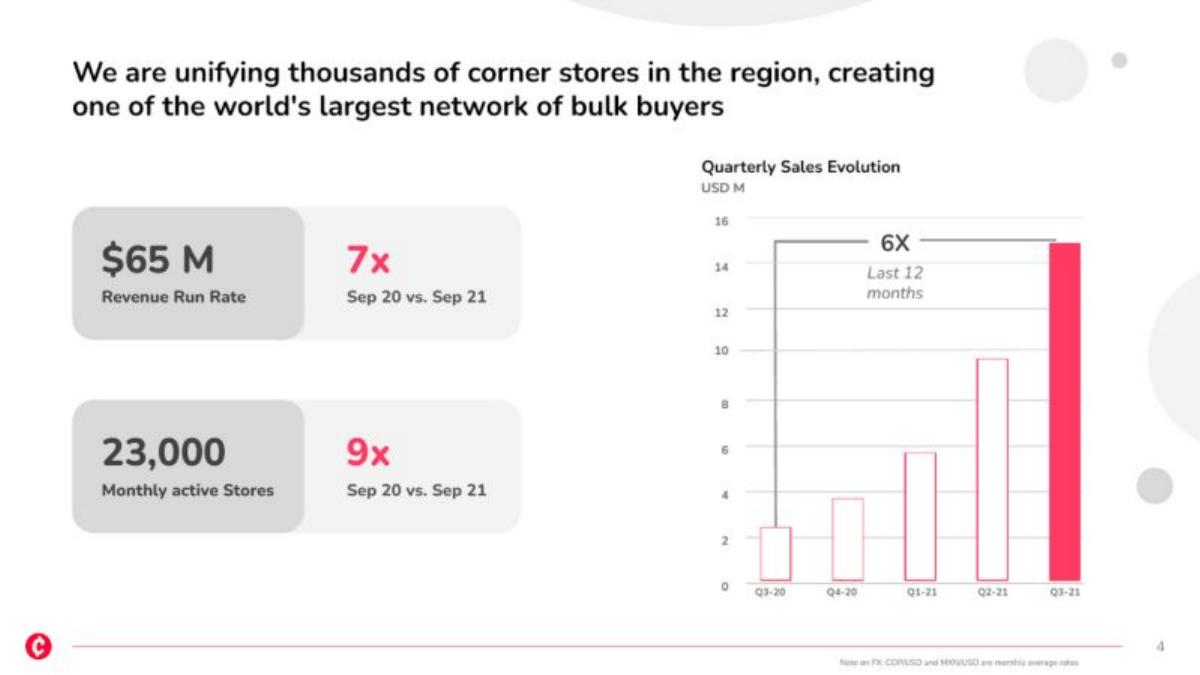
- The company achieved a $65M revenue run rate by September 2021, representing 7x year-over-year growth (Slide 4).
- Monthly active stores grew 9x between September 2020 and September 2021, reaching 23,000 (Slide 4).
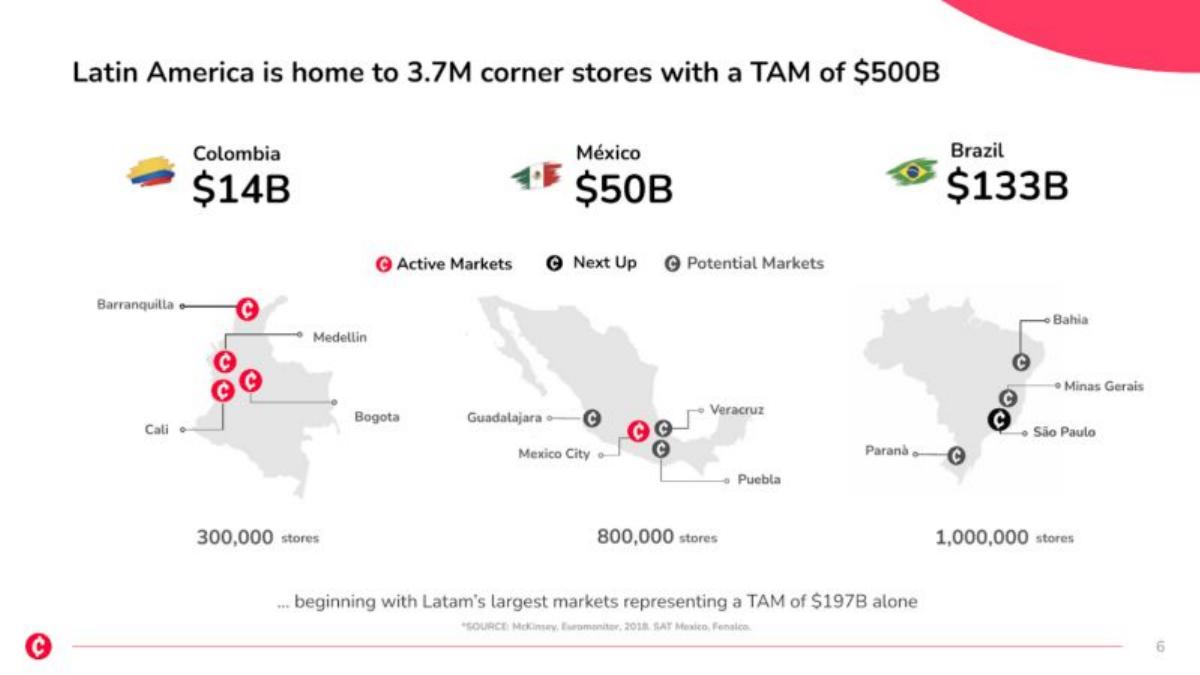
- Latin America represents a $500B TAM with 3.7M corner stores, yet less than 1% of B2B transactions are currently online (Slides 3, 6).
- Chiper reports a current contribution profit of $1.00 per order, with a target to reach $3.00 through margin improvements and fulfillment cost reductions (Slide 11).
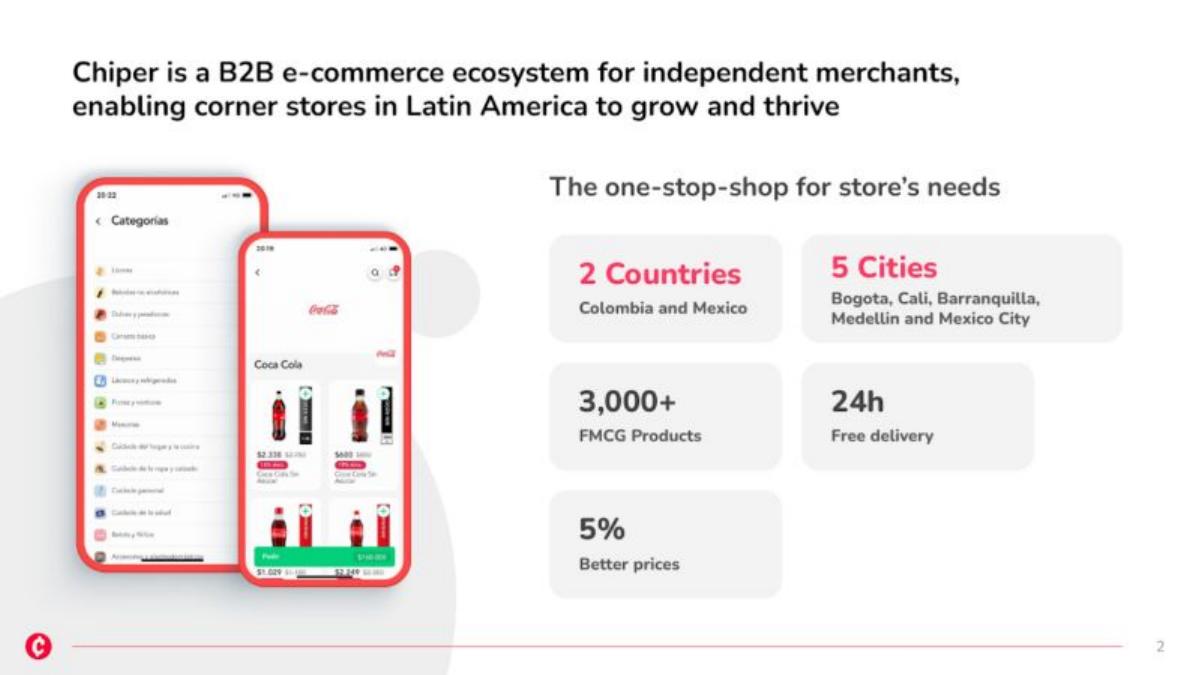
- The platform offers 24h free delivery and prices that are 5% better than traditional wholesalers (Slide 2).
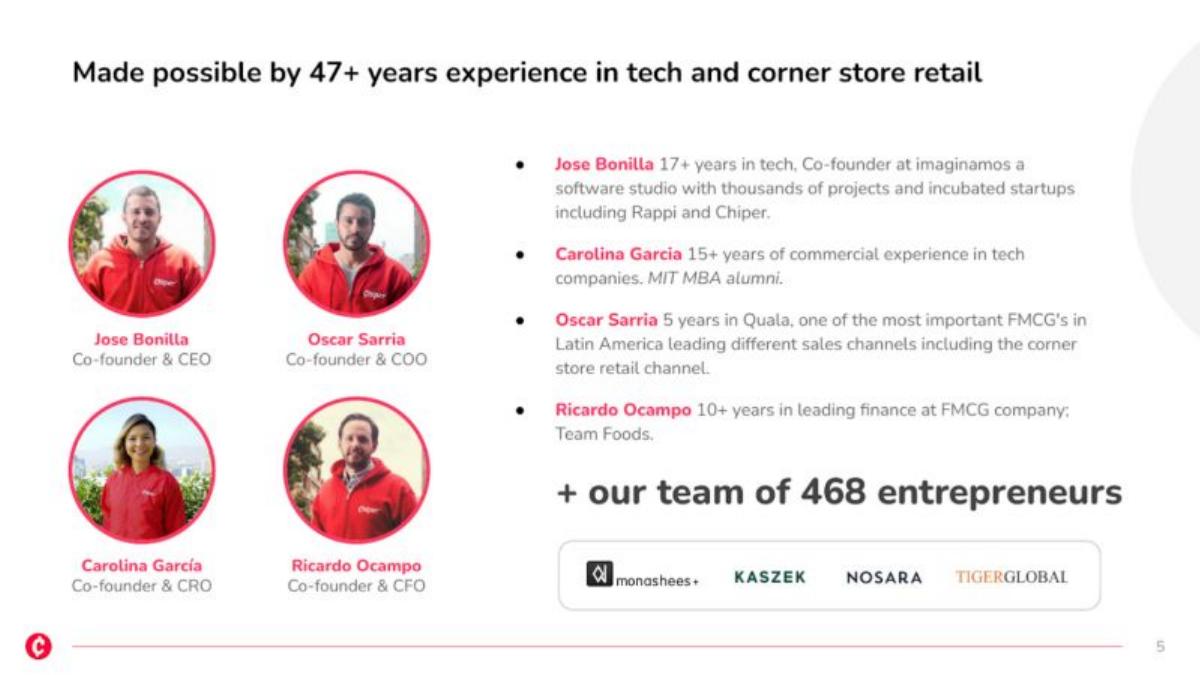
- The leadership team brings over 47 years of combined experience, including co-founding Rappi and leading sales at major FMCG companies (Slide 5).
- Future growth is predicated on expanding into Brazil and launching financial services like credit scoring and insurance (Slides 12, 13).
- The deck omits a specific 'Ask' slide detailing the exact breakdown of how the $53M will be spent.
Chiper Series B Pitch Deck Analysis
Chiper's 2021 investor deck is a concise 15-slide presentation that successfully secured $53M in Series B funding. The deck focuses heavily on the massive untapped potential of the Latin American retail market and Chiper's rapid execution within that space. By positioning themselves as the digital backbone for millions of 'mom-and-pop' stores, Chiper presents a compelling case for a high-frequency, high-stickiness B2B platform.
Slide 1-2: The Hook and Value Proposition
The deck opens with a clear mission statement: "Digitizing the corner store retail market." Slide 2 immediately backs this up with hard numbers and a product preview. It defines Chiper as a "B2B e-commerce ecosystem" and lists their current footprint: 2 countries (Colombia and Mexico), 5 cities, and over 3,000 FMCG products. The value proposition for the merchant is summarized in three points: 24h free delivery, 5% better prices, and a one-stop-shop experience. This immediately establishes the company's scale and the tangible benefits they provide to their customers.
Slide 3-4: Market Opportunity and Traction
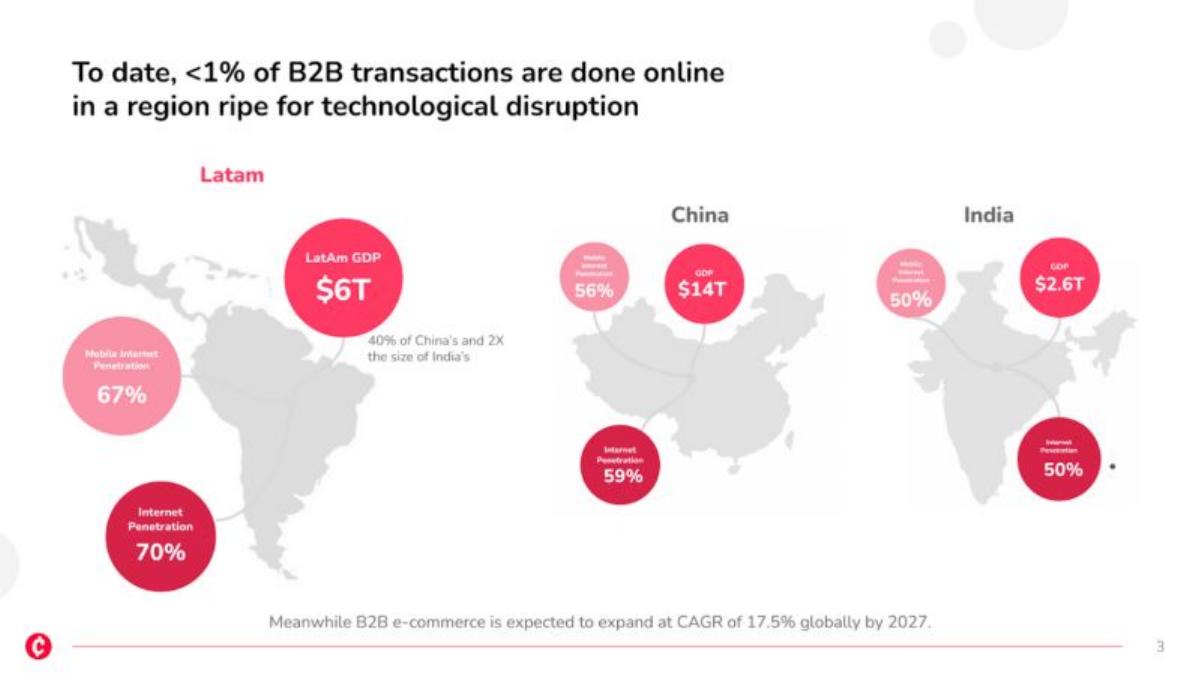
Slide 3 uses a global comparison to highlight the LatAm opportunity. With a $6T GDP and 70% internet penetration, LatAm's B2B e-commerce is still under 1%, compared to more mature markets like China and India. This suggests a massive headroom for growth. Slide 4 is the "Traction" slide, and it is exceptionally strong. It shows a $65M revenue run rate and 23,000 monthly active stores. The most impressive figures are the growth rates: 7x revenue growth and 9x store growth year-over-year. The bar chart showing "Quarterly Sales Evolution" demonstrates a consistent upward trajectory, which is exactly what Series B investors look for.
Slide 5: The Team and Backers
The leadership team is presented with a focus on relevant experience. Jose Bonilla (CEO) is noted as a co-founder of Imaginamos, the studio that incubated Rappi, which is a massive signal in the LatAm tech ecosystem. The team claims over 47 years of combined experience in tech and retail. The slide also prominently features logos for Monashees, Kaszek, Nosara, and Tiger Global, signaling that Chiper has already passed the due diligence of some of the world's most respected investors.
Slide 6-8: The Problem and The Backbone
Slide 6 breaks down the TAM (Total Addressable Market) by country, highlighting Brazil as the largest future opportunity at $133B. Slide 7 explains why corner stores are the "backbone" of LatAm grocery supply, serving 300M consumers who visit these stores at least 10x per day. Slide 8 identifies the pain points: store owners manage 20+ daily supplier visits and pay 10% higher prices due to fragmentation. This section effectively builds empathy for the customer while quantifying the inefficiency Chiper aims to solve.
Slide 9-10: The Solution and Growth Velocity
Slide 9 outlines the digital experience Chiper provides, focusing on service levels, modernized purchasing, and reduced costs. Slide 10 reinforces the growth narrative with two charts: a 10x growth in monthly active stores over 21 months and a 91% Compound Quarterly Growth Rate (CQGR) in orders delivered, reaching 278,000 orders in Q3-21. These metrics prove that the solution is not just theoretical but is being rapidly adopted by the market.
Slide 11: Unit Economics and Profitability
This is perhaps the most critical slide for a Series B deck. Chiper shows a current Average Order Value (AOV) of $50.10 and a contribution profit of $1.00 per order. They then provide a bridge to a "Long term UE" (Unit Economics) of $3.00. This is broken down into a $1.50 gain from increasing gross margins by 3% and a $0.50 gain from reducing fulfillment costs by 1%. By showing that they are already contribution-margin positive, Chiper de-risks the investment and shows a clear path to overall profitability.
Slide 12-13: Future Growth and Targets
Slide 12 introduces the concept of "infinite growth opportunities" by moving into private labels, new categories (electronics, home appliances), and financial services (credit scoring, insurance, remittances). This suggests that the current B2B e-commerce platform is just the entry point into a much larger ecosystem. Slide 13 sets ambitious targets for 2022 and 2023, including a $430M revenue run rate and 100,000 monthly active stores. These milestones give investors a clear picture of what success looks like in the coming years.
Slide 14-15: Product Showcase and Closing
Slide 14 provides a high-fidelity look at the mobile app interface, showing a clean, modern UI that contrasts with the "20th-century" methods described earlier. The deck concludes with a simple contact slide. Notably, there is no specific slide detailing the use of proceeds or the exact terms of the "Ask," which is common in decks that are used as part of an active, competitive bidding process where the round size might be fluid.
What Chiper Does Well
Growth Benchmarking: The deck uses 7x and 9x year-over-year growth figures to create a sense of urgency and momentum. · Unit Economics Clarity: Explicitly stating a $1.00 contribution profit per order is a bold and effective way to prove the business model works at scale. · Market Context: Comparing LatAm to China and India helps global investors (like Tiger Global) understand the stage of the market and the potential for a massive breakout. · Social Proof: Leveraging the Rappi connection and existing top-tier investors provides instant credibility.
What is Missing from the Chiper Deck
The Ask: There is no slide stating how much money they are raising or how they plan to allocate the capital. While this is often handled in a separate term sheet, its absence in the deck leaves a gap in the narrative. · Competitive Landscape: The deck mentions a "fragmented purchasing system" but does not name specific competitors or explain how Chiper defends against other well-funded players in the region. · Logistics Infrastructure: For a company promising 24h delivery, there is very little detail on their physical infrastructure (warehouses, fleet) or how they manage the last-mile complexity of dense LatAm cities.
Founder Takeaways: What to Copy
The "Bridge to Profitability" Slide: Founders should copy Slide 11's format. Showing exactly how you get from current unit economics to long-term targets using specific percentage improvements is highly persuasive. · Visualizing the TAM: Slide 6 does an excellent job of breaking down a large TAM into actionable geographic segments (Active, Next Up, Potential). This shows a logical expansion strategy. · High-Frequency Metrics: If your business has a high-frequency use case (like 10x daily visits), highlight it. It proves the "stickiness" of the ecosystem you are building.
Frequently asked questions
- What is Chiper's core business model?
- Chiper operates as a B2B e-commerce ecosystem specifically designed for independent corner stores in Latin America. They act as a one-stop-shop, providing store owners with a digital platform to order over 3,000 FMCG products with 24-hour free delivery and competitive pricing, effectively replacing the fragmented traditional wholesale system.
- How does Chiper plan to reach profitability?
- Slide 11 outlines a clear path: starting from a $1.00 contribution profit per order, they aim to reach $3.00. This is achieved by increasing gross margins by 3% (adding $1.50) and reducing fulfillment costs by 1% (adding $0.50). This transition relies on leveraging machine learning and automation to increase operational efficiency.
- What market gap is Chiper filling in Latin America?
- Corner stores supply 50% of groceries in LatAm but are stuck with 20th-century replenishment methods. Owners typically manage 20+ daily supplier visits, pay 10% higher prices due to fragmentation, and lose 12-15% in sales from stock-outs. Chiper digitizes this process to save time and capital for the merchants.
- Who are the key investors backing Chiper?
- As shown on Slide 5, Chiper is backed by prominent venture capital firms including Tiger Global, Kaszek, Monashees, and Nosara. These investors are well-known for their bets on high-growth Latin American startups, providing significant validation for Chiper's Series B round.
- What are Chiper's expansion plans beyond their current markets?
- According to Slides 6 and 13, Chiper plans to expand from its active markets in Colombia and Mexico into Brazil, which represents a $133B TAM with 1 million stores. They also intend to move beyond logistics into financial services, including credit, insurance, and wealth management for store owners.