Fintern's 12-slide Series A deck is a masterclass in data-driven storytelling for the fintech sector. The company identifies a specific market inefficiency—the 'near-prime' segment where traditional credit scoring fails—and presents a technology-led solution using Open Banking data. The deck successfully balances a dual-track growth strategy: building a £1bn B2C loan book while simultaneously launching a B2B lending-as-a-service platform. With a team boasting deep institutional experience from McKinsey, EY, and HSBC, the presentation relies on early performance data showing a 50% reduction in…
Key takeaways
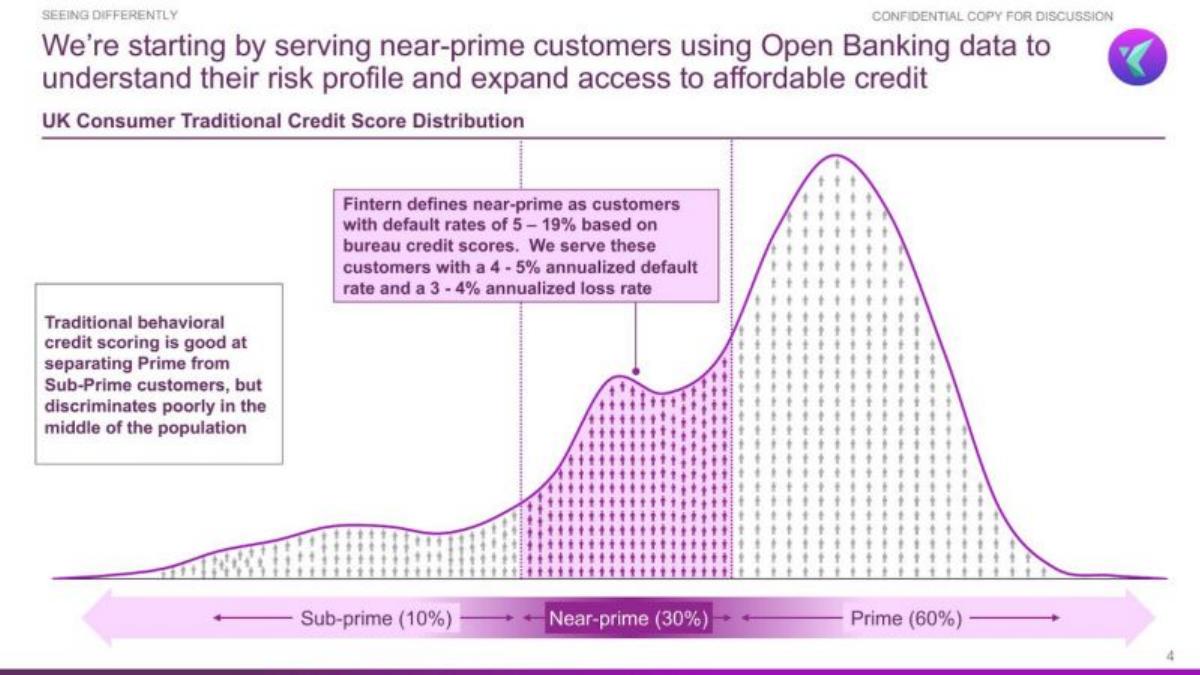
- Fintern targets the 'near-prime' segment, which they define as 30% of the UK population with default rates of 5-19% based on traditional scores (Slide 4).
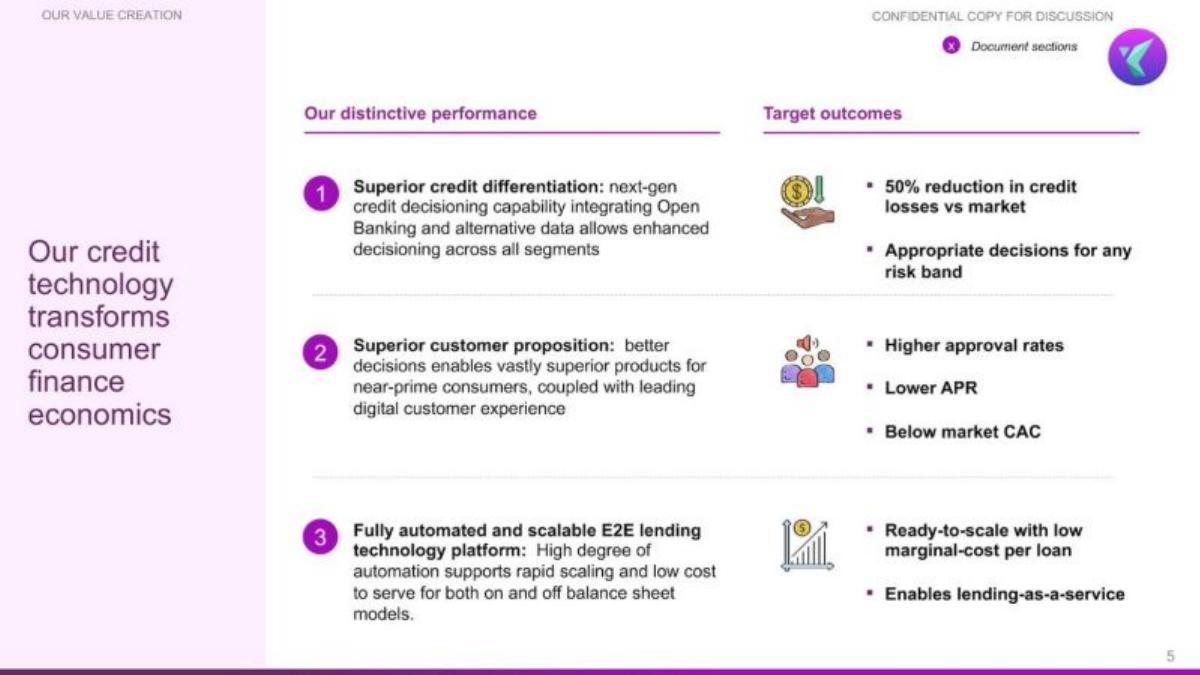
- The company claims their technology achieves a 50% reduction in credit losses compared to the market by using Open Banking and alternative data (Slide 5).
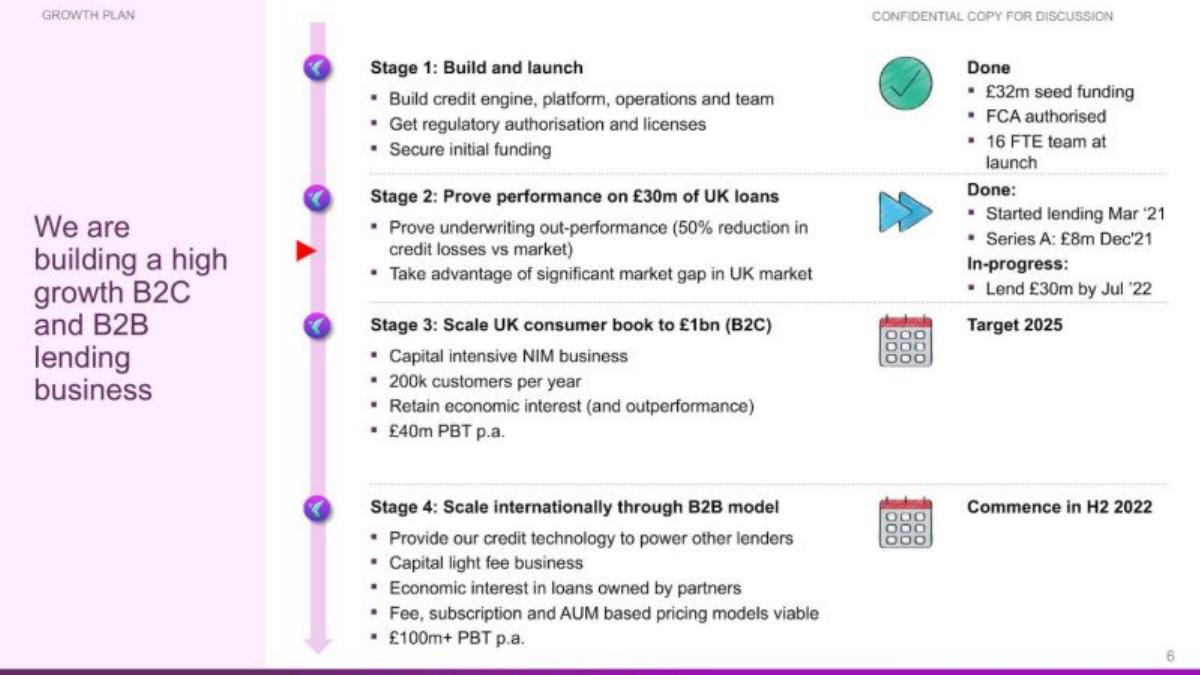
- A clear four-stage growth plan outlines the transition from a capital-intensive B2C model to a capital-light B2B fee business (Slide 6).
- Fintern offers a highly competitive 18.8% APR for unsecured personal loans between £1,000 and £7,500, positioning them against mainstream banks (Slide 9).
- The deck highlights significant early traction, including £40m in debt and equity funding raised prior to this round and 50% month-on-month growth (Slide 10).
- The team slide emphasizes institutional credibility, featuring founders with backgrounds at McKinsey, EY, and the Bank of England (Slide 11).
- The business model projects a £100m+ PBT per annum once the B2B model scales internationally (Slide 6).
- Operational efficiency is a core pillar, with 66% of loan reviews fully automated at the time of the deck (Slide 10).
Fintern Pitch Deck Teardown: The Data-Driven Path to $11M
Fintern’s 2022 pitch deck is a clinical example of how to present a complex fintech solution to sophisticated investors. At its core, the deck argues that traditional credit scoring is broken for a third of the population, and that Fintern has the proprietary 'eyes' (via Open Banking) to see what others cannot. This teardown explores how they used data visualization and a dual-track business model to raise $11 million.
Slide 1: Title Slide
The cover slide is functional and professional. It identifies the company as 'Fintern: Business Insider' (likely a version of the deck prepared for a specific feature or audience) and uses the tagline 'Next generation consumer credit.' It includes the date (Feb 2022), website, and contact information. The background image of diverse people using smartphones subtly reinforces the consumer-facing nature of the product.
Slide 2: The Hook
Slide 2 is a minimalist 'mission' slide. It states: 'Some loans are only about your credit score. Ours are about you.' This sets up the primary conflict of the deck: the inadequacy of the status quo (credit scores) versus the personalized approach of Fintern.
Slide 3: Who We Are
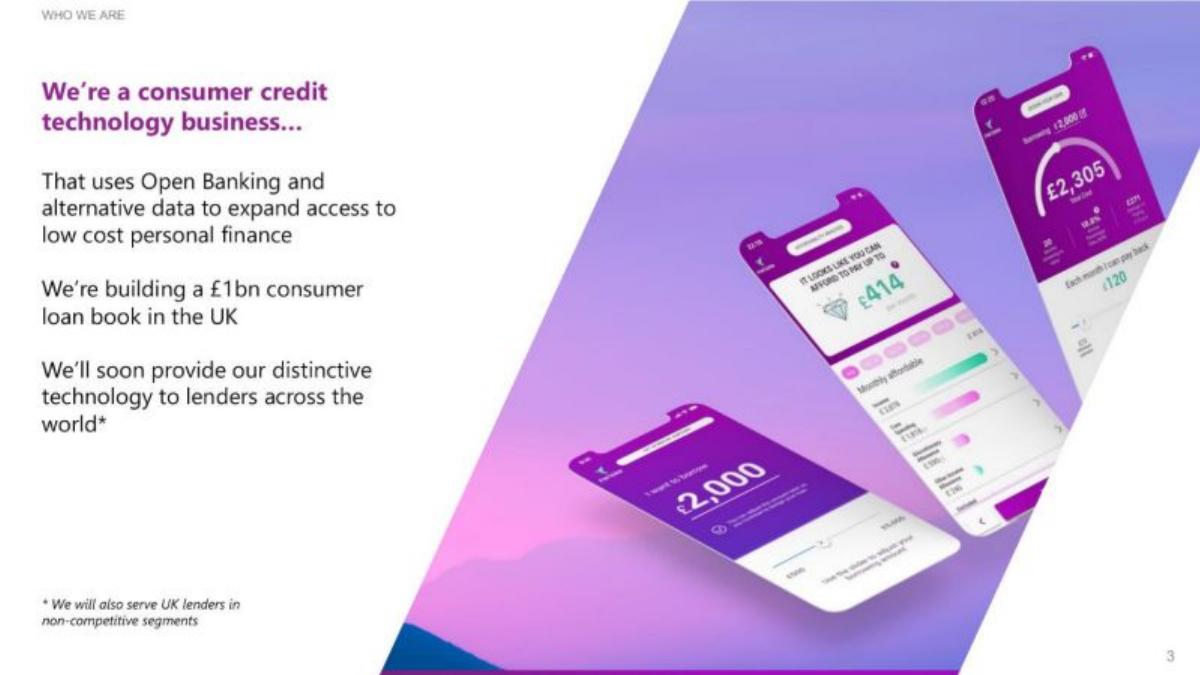
This slide defines the business as a 'consumer credit technology business.' It immediately outlines three key pillars: the use of Open Banking/alternative data, the goal of building a £1bn UK loan book, and the future plan to provide technology to global lenders. The inclusion of mobile app mockups on the right side provides a tangible look at the user interface, showing loan amounts like £2,000 and monthly affordability breakdowns.
Slide 4: Seeing Differently (The Problem)
This is one of the most important slides in the deck. It uses a bell curve to visualize the 'UK Consumer Traditional Credit Score Distribution.' It segments the market into Sub-prime (10%), Near-prime (30%), and Prime (60%). Fintern identifies the 'Near-prime' segment as their target, noting that traditional scoring 'discriminates poorly in the middle of the population.' They define their target sub-segment as having a 3-4% annualized loss rate, despite bureau scores suggesting much higher default risks. This slide clearly identifies the 'arbitrage' opportunity the company is pursuing.
Slide 5: Our Value Creation
Slide 5 breaks down the value proposition into three categories: Superior credit differentiation, Superior customer proposition, and a Fully automated E2E platform. Key metrics are introduced here, specifically a '50% reduction in credit losses vs market' and 'Below market CAC.' It also introduces the 'lending-as-a-service' concept, signaling that this isn't just a bank, but a software play.
Slide 6: Growth Plan
The growth plan is presented as a four-stage timeline. Stage 1 (Build and launch) and Stage 2 (Prove performance) are marked as 'Done.' Notable achievements listed include £32m in seed funding and FCA authorization. Stage 3 targets a £1bn B2C book by 2025 with £40m PBT. Stage 4 focuses on international B2B scaling with a target of £100m+ PBT. This slide is excellent because it shows both historical execution and a massive future upside.
Slide 7: Expanding Access to Low Cost Credit
This slide provides a deep dive into the 'Near-prime' segment. It uses a 'Single Risk Band Example' (Delphi 800-870) to show how banks see a 'mostly homogenous risk block' with a 10% default rate. In contrast, Fintern uses transactional analytics to split that same block into sub-segments, identifying groups with as low as a 2% default rate. This is the 'secret sauce' slide that explains exactly how they outperform traditional lenders.
Slide 8: Performance Validation
To back up the claims in Slide 7, Slide 8 shows a graph of 'Arrears performance vs. market PD and plan.' The purple line (Fintern's actual performance) is significantly lower than the red line (market) and the black line (50% of market). The text claims their analytics identify customers who are 'intrinsically prime' but misclassified. This is the 'proof' slide required for a Series A.
Slide 9: Competitive Landscape (APR)
Slide 9 compares Fintern’s 18.8% APR against a wide range of UK lenders. It categorizes competitors into 'Specialist Lenders' (with APRs ranging from 42.5% to over 1000%) and 'Mainstream and Digital Lenders.' Fintern positions itself at the lower end of the mainstream spectrum, just above Zopa and Tesco Bank. The side notes explain that mainstream bank rates (3-4%) are often 'teaser' rates not available for smaller loans or near-prime customers.
Slide 10: Fintern Highlights
This is a 'traction' slide packed with data. Key figures include: 50% month-on-month growth, £80m loan origination target by Feb '23, and a 66% automated loan review rate. It also includes social proof: a 4.5/5 customer rating across App stores and Trustpilot. The 'Lending Technology as a Service' section projects 50 global clients and £32m ARR by 2025.
Slide 11: The Team
The team slide is exceptionally strong, emphasizing institutional 'pedigree.' CEO Gerald Chappell is a former Partner at McKinsey & EY. COO Dr. Michelle He was a Director at EY. CCO Dr. Alan Cathcart has 30+ years at HSBC and the Bank of England. The slide also highlights a Board Director, Andrew Bloom, who founded Masthaven Bank. This level of experience is a major de-risking factor for investors in the highly regulated lending space.
Slide 12: Final Slide
The final slide is a standard closing slide with the company logo and a prompt to browse more examples on bestpitchdeck.com.
What Fintern Does Well
Fintern’s deck excels at segmentation and targeting . Instead of claiming they can serve everyone, they focus on a specific 30% of the population where they have a clear data advantage. Their use of the 'bell curve' and 'risk band' visualizations (Slides 4 and 7) makes a complex financial concept immediately understandable to a generalist investor.
The dual-track business model is also a highlight. By starting with a B2C loan book, they prove the efficacy of their algorithm with their own capital (or debt). Once proven, they pivot to a B2B 'lending-as-a-service' model, which carries higher margins and lower risk. This 'prove then license' strategy is a classic way to achieve a high valuation in fintech.
What is Missing from the Deck
While the deck is strong on risk and team, it is light on unit economics . There is no mention of Customer Acquisition Cost (CAC) in absolute terms, nor is there a breakdown of Lifetime Value (LTV). While they mention 'Below market CAC' on Slide 5, investors would typically want to see the actual cost to acquire a borrower versus the expected interest income over the life of the loan.
Additionally, the 'The Ask' is missing from this version of the deck. While the catalogue facts state they raised $11M, the slides themselves do not specify how much they were seeking or how they planned to allocate the capital (e.g., % to marketing, % to hiring, % to loan loss reserves).
What a Founder Should Copy
The 'Seeing Differently' Slide: If your startup relies on a proprietary data advantage, use a visualization like Slide 7 to show exactly how your 'vision' differs from the incumbent's 'vision.' · The Performance vs. Market Graph: Slide 8 is a perfect example of how to use early-stage data to validate a core hypothesis. Comparing your actual results against a 'market average' line is a powerful way to demonstrate outperformance. · The APR Comparison: Slide 9 is a masterclass in competitive positioning. By grouping competitors into 'Specialists' and 'Mainstream,' Fintern makes their 18.8% rate look like a bargain for the target audience. · The Growth Stages: Clearly delineating between 'capital intensive' and 'capital light' phases of a business (Slide 6) helps investors understand the long-term scalability of the company.
Frequently asked questions
- What is Fintern's core value proposition?
- Fintern's value proposition is centered on 'superior credit differentiation.' By integrating Open Banking and alternative data, they claim to identify 'intrinsically prime' customers within the near-prime pool who are misclassified by traditional credit bureaus. This allows them to offer lower APRs (18.8%) and achieve higher approval rates while maintaining credit losses that are 50% lower than the market average.
- How does Fintern plan to scale its business?
- The company follows a four-stage growth plan. Stage 1 and 2 involved building the engine and proving performance on a £30m loan book. Stage 3 focuses on scaling the UK B2C consumer book to £1bn by 2025. Stage 4 involves international expansion through a B2B 'lending-as-a-service' model, which is described as a capital-light fee business targeting over £100m in annual profit.
- Who is the target customer for Fintern?
- Fintern specifically targets the 'near-prime' segment of the UK consumer market. They define this as the 30% of the population that traditional behavioral credit scoring discriminates against. These are individuals who may have a higher default risk according to bureaus (5-19%) but whom Fintern can serve at a 3-4% annualized loss rate through better data analytics.
- What competitive advantage does Fintern claim over mainstream banks?
- According to the deck, mainstream banks advertise low rates (3-4%) that are only available to prime customers for large loans (over £7,500). For smaller ticket sizes (£1,000 - £7,500), banks penalize customers with higher rates or rejection. Fintern fills this gap with an 18.8% APR, which is significantly lower than 'specialist' lenders whose rates can exceed 100% APR.
- What are the key financial projections mentioned in the deck?
- Fintern projects reaching a £1bn consumer loan book by 2025, generating £40m in Profit Before Tax (PBT) per year from the B2C side. For their B2B technology-as-a-service arm, they project 50 global clients and £32m in ARR by 2025, with the total international B2B model eventually contributing over £100m in PBT per year.