Finix Payments raised $126 million following the use of this deck, which focuses heavily on market education rather than raw internal metrics. The deck is notable for its 'Payments Layer Cake' sequence (Slides 3-11), which methodically builds the case for why current payment facilitators like Stripe and Square leave a margin gap that Finix can help software companies reclaim. By framing the problem as an expensive, multi-year engineering hurdle ($3-5M upfront investment, Slide 12) and the solution as a way to capture an additional $3M in revenue per $100M processed (Slide 13), Finix successfu…
Key takeaways
- The deck uses a progressive disclosure technique for its 'Payments Layer Cake' across nine slides to explain complex industry economics (Slides 3-11).
- Finix identifies a specific fee gap, noting that Payment Facilitators charge 50-100 BPS while underlying processors cost less than $0.10 (Slide 10).
- The 'Problem' is quantified as a $3-5M upfront investment and a 2-3 year time-to-market for companies building in-house (Slide 12).
- The value proposition is framed as a 3-4x increase in TAM compared to a SaaS-only market (Slide 13).
- Market growth is projected at a 30% CAGR, reaching $154B in revenue by 2027 (Slide 14).
- The deck maps the evolution of payment distribution from Banks to ISOs, Direct, Integrated, and finally Software (Slide 15).
- Finix targets companies with $50M+ in Annual GMV or 100+ merchants (Slide 20).
- The deck completely omits a team slide, specific company financials, and a formal 'Ask' slide.
The Infrastructure Thesis: Finix Payments Teardown
Finix Payments occupies a unique space in the fintech stack. Founded in 2015, the company reached a Series B stage by 2020, eventually raising a total of $126,000,000. This deck is a masterclass in market education. Instead of leading with vanity metrics or a high-energy team slide, Finix spends the first half of the presentation explaining how the payments industry actually works. For a Series B pitch, this is a bold move that assumes the investor needs to be convinced of the market shift before they can appreciate the product.
Slides 1-2: The Hook and the Thesis
Slide 1 introduces the brand with a simple subtitle: Payments Infrastructure-as-a-Service . The tagline, "The next generation of payments companies will be built on Finix," sets a high bar for the slides to follow. Slide 2 delivers the core thesis of the entire business: Software Companies are Becoming Payments Companies . This is the 'why now' of the deck, tapping into the broader trend of vertical SaaS companies looking for ways to increase their Average Revenue Per User (ARPU) by embedding financial services.
Slides 3-11: The Payments Layer Cake
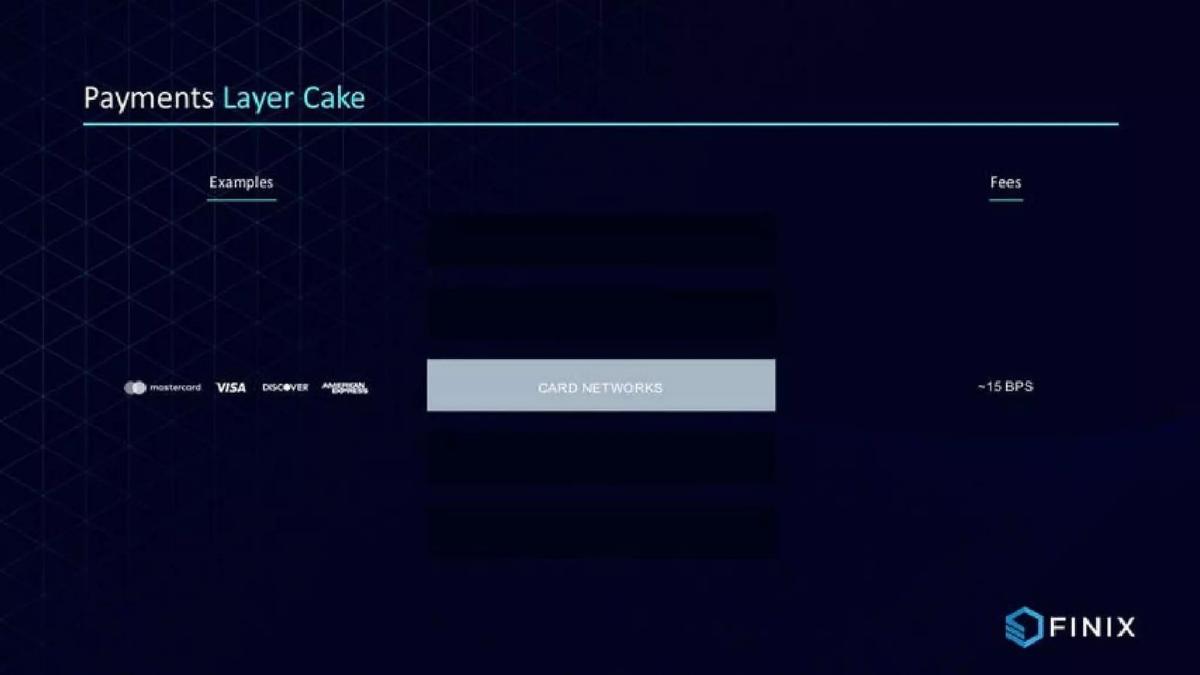
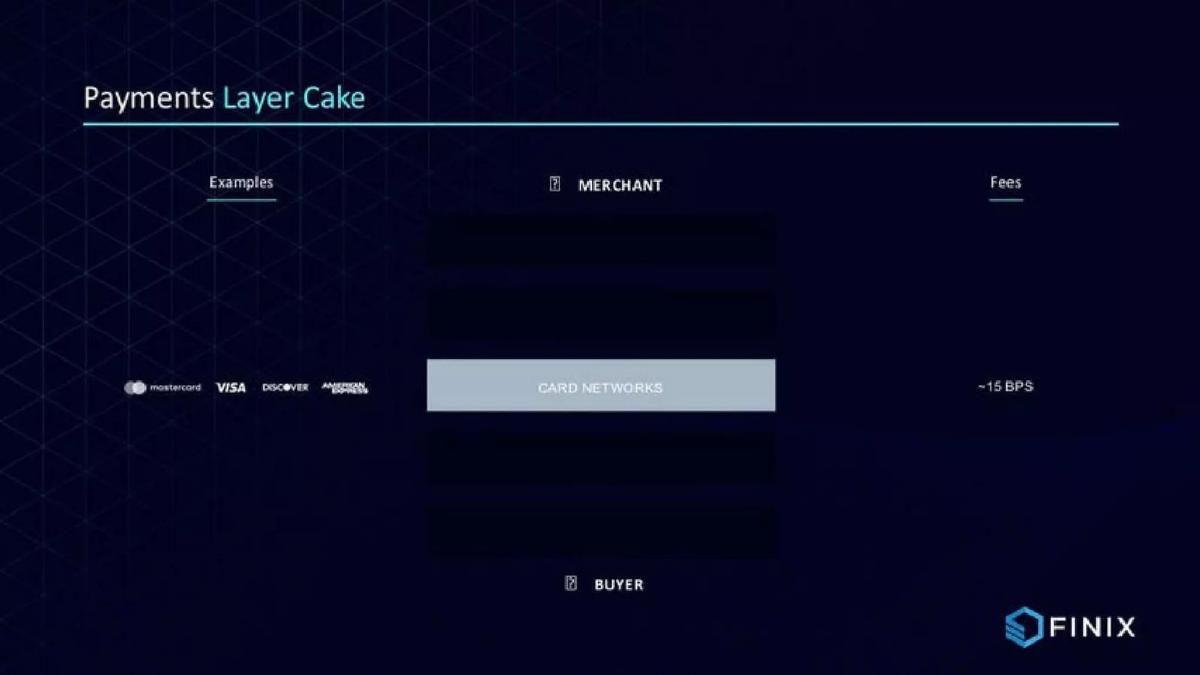
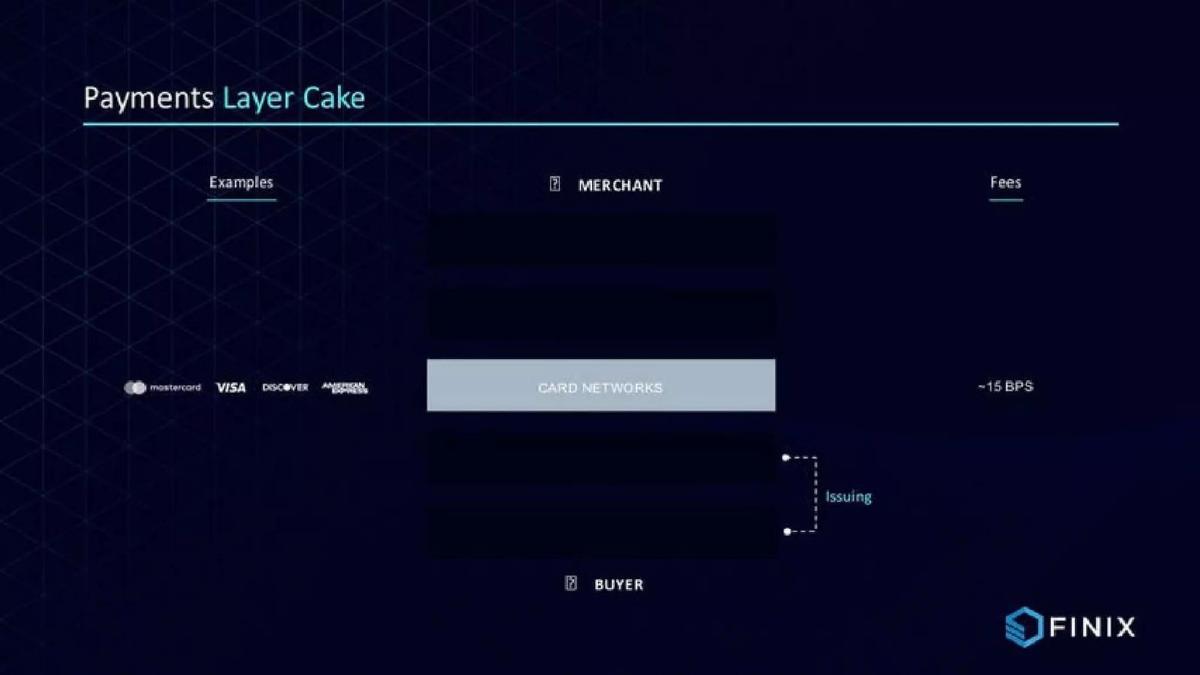
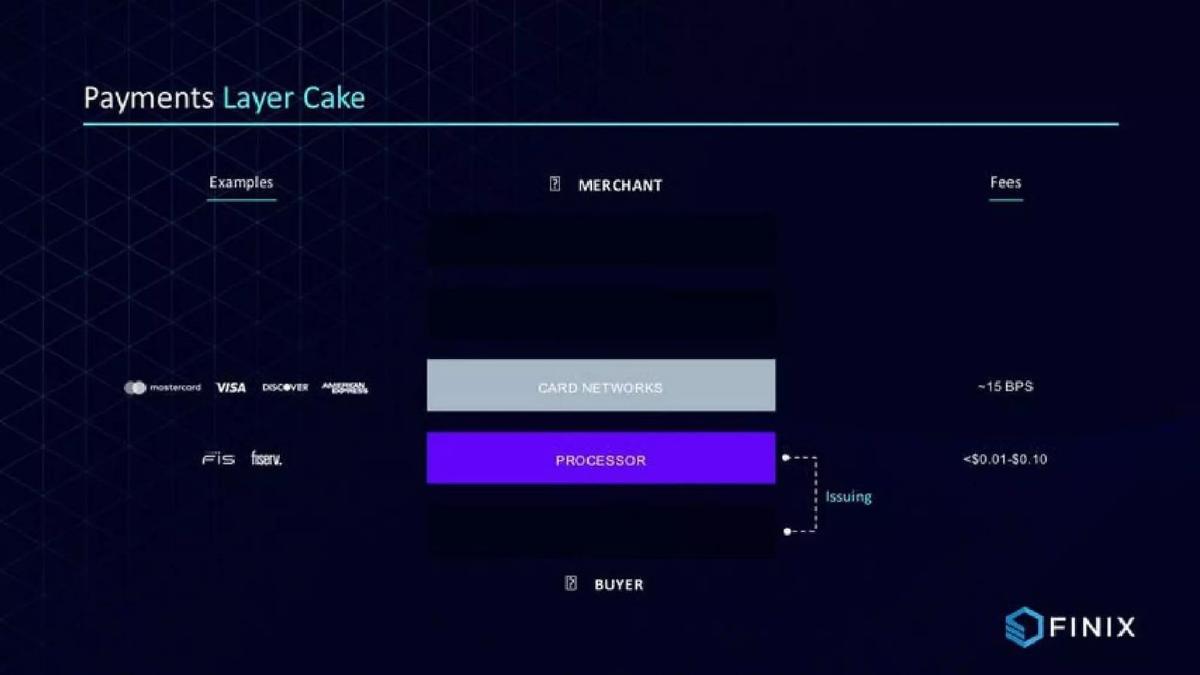
This nine-slide sequence is the heart of the deck. It uses a progressive disclosure animation style to build a vertical map of the payments industry. Slide 3 starts with Card Networks (Mastercard, Visa) at ~15 BPS. Slide 6 adds the Processor layer (FIS, Fiserv) at less than $0.10. Slide 7 adds the Bank layer (BofA, Citibank) at 175 BPS. Slide 10 finally reveals the 'Payment Facilitators' like Stripe and Square, who charge between 50-100 BPS.
The climax of this sequence is Slide 11 , which shows Finix wrapping around the top layers. The headline states: Finix enables companies to cut out the middleman and start monetizing payments . By visualizing the 'middleman' as a specific block in the cake, Finix makes the value proposition tangible. They aren't just a tool; they are a margin-recovery engine for companies like Lightspeed or Clubessential (listed as examples on Slide 11).
Slides 12-13: The Build vs. Buy ROI
After establishing where the money is, Finix explains why companies don't just build this themselves. Slide 12 quantifies the pain: $3-5M Upfront Investment , 2-3 Years Time-to-Market , and > $2M / yr. Ongoing Maintenance . This slide is crucial because it addresses the 'Internal Engineering' competitor. If a founder can prove that their software saves $5M and two years of time, the sale is halfway done.
Slide 13 flips the script to the upside. It claims that by using Finix, companies see +$3M additional revenue per $100M processed and a 3-4x increase in TAM compared to a SaaS-only market. It cites a J.P. Morgan report to back up these claims, lending institutional credibility to the numbers.
Slides 14-15: Market Dynamics and Evolution
Slide 14 focuses on the 'Explosive Growth' of payments via software. It shows a bar chart where 'Software Vendors' are growing at 4x the rate of traditional providers, projecting $154B in revenue by 2027 with a 30% CAGR . This slide is designed to show the size of the prize.
Slide 15 provides a historical context, mapping the Evolution of Payment Distribution . It moves from Banks (Chase) to ISOs (iPayment) to Direct (Worldpay) to Integrated (Clover) and finally to Software (Square, Stripe, Lightspeed). This positioning places Finix at the inevitable end-state of a decades-long industry evolution.
Slides 16-19: The Product Deep Dive
Slide 17 and Slide 18 contrast the 'Then' and 'Now' of responsibilities. In the old model, Traditional Payment Processors handled everything from compliance to risk management. In the new model, Software Providers take on these roles to capture more margin. Slide 19 introduces the Finix Payments Platform as the modular solution that makes this shift possible. It lists specific modules like Merchant Underwriting , Tokenization & Vaulting , and Dispute/Exception Mgmt . This slide proves that Finix has built the complex 'boring' stuff that software companies don't want to build themselves.
Slides 20-21: The Target Customer
Slide 20 defines the Ideal Customer Profile (ICP). Finix is looking for companies with $50M+ in Annual GMV and 100+ Merchants . It lists a variety of categories including Ecommerce, Billing, Fundraising, Booking, and On-demand. By naming companies like Shopify, GoFundMe, and Uber as examples of these categories, Finix signals the caliber of enterprise they are targeting. The deck ends on Slide 21 with a simple logo, maintaining the clean, minimalist aesthetic found throughout.
What Works in the Finix Deck
The standout feature of this deck is its educational clarity . Payments is a 'black box' for many investors. By spending nine slides on the 'Layer Cake,' Finix ensures that by the time they ask for money, the investor understands the unit economics of the industry better than they did ten minutes prior. This builds trust and positions the founders as experts.
The quantification of the problem on Slide 12 is also excellent. Many decks describe a 'pain point' in vague terms like 'inefficient' or 'slow.' Finix puts a dollar amount ($3-5M) and a time frame (2-3 years) on the problem. This makes the ROI calculation for a potential customer—and therefore the potential for Finix—very easy to grasp.
What is Missing from the Finix Deck
For a Series B deck, there are several glaring omissions. First, there is no Team slide . While the founders may be well-known in the industry, investors at this stage typically want to see the bench strength of the executive team. Second, there is no Traction slide . We see examples of companies that could use Finix, but we don't see a chart showing Finix's actual GMV growth or revenue over the previous 12-24 months. Finally, there is no Ask . The deck doesn't specify how much they are raising or what the use of funds will be, suggesting this version of the deck was likely used as a high-level teaser or a 'leave-behind' rather than the final pitch presentation.
What Founders Should Copy
Founders building in complex, multi-layered industries should copy the progressive disclosure method used in the 'Layer Cake' sequence. If your business relies on capturing margin from a specific part of a value chain, don't just show your part—show the whole chain and highlight the inefficiency you are removing.
Additionally, the Build vs. Buy comparison on Slide 12 is a gold standard for B2B infrastructure companies. If you are selling a tool that replaces internal engineering work, you must be able to tell the investor exactly how much that internal work costs in both dollars and opportunity cost (time-to-market). Finix does this perfectly, making their platform seem like a bargain compared to the alternative.
Final Verdict: This deck is a masterclass in narrative-driven fundraising. It sells a vision of a changing world and positions the company as the only logical infrastructure for that new reality. While it lacks the 'hard' data typical of a Series B, its structural logic is so sound that it clearly resonated with top-tier investors.
Frequently asked questions
- Why does the deck spend so many slides on the 'Layer Cake'?
- Payment infrastructure is notoriously opaque. By using Slides 3 through 11 to build the industry map piece-by-piece, Finix ensures the investor understands exactly where the 'middleman' margin exists. This educational approach justifies Finix’s existence by showing that software companies are currently overpaying for payment processing, creating a clear opening for an infrastructure-as-a-service provider.
- What is the primary financial argument for using Finix?
- The deck argues that software companies can capture an additional $3M in revenue for every $100M processed (Slide 13). It contrasts this against the 'build' alternative, which requires a $3-5M upfront investment and over $2M in annual maintenance (Slide 12). Essentially, Finix positions itself as a way to turn a cost center into a high-margin profit center.
- Who is the target customer according to this deck?
- Slide 20 specifies that Finix is for companies with $50M+ in Annual GMV and 100+ merchants. It lists specific verticals including Ecommerce (Shopify), Billing (Freshbooks), Fundraising (GoFundMe), and On-demand (Uber). This shows that Finix isn't for small startups, but for scaled platforms that have enough volume to justify owning their payment stack.
- Is there any mention of competition like Stripe or Adyen?
- Yes, but they are framed as part of the legacy 'Payment Facilitator' layer rather than direct competitors. Slide 10 explicitly lists Stripe and Square as examples of companies charging 50-100 BPS. Finix positions itself as the layer underneath these facilitators, allowing companies to 'cut out the middleman' (Slide 11).
- What are the most significant omissions in this Series B deck?
- The deck is surprisingly light on internal data. There is no team slide, no slide showing Finix’s own revenue growth, no churn metrics, and no specific 'Ask' regarding the amount of capital being raised. It relies almost entirely on the strength of the market thesis and the product's theoretical ROI for the customer.