Finix's Series B deck is a highly disciplined example of educational selling. Instead of leading with dense product features, the first half of the deck (Slides 3-11) uses a build-up animation of the 'Payments Layer Cake' to explain exactly where money is lost to middlemen. By the time the product is introduced on Slide 19, the investor already understands the $154B market opportunity and the $3-5M upfront cost barrier that Finix removes. While the deck completely omits a team slide, financial projections, and a specific 'ask' or use of funds, its strength lies in its ability to frame payment…
Key takeaways
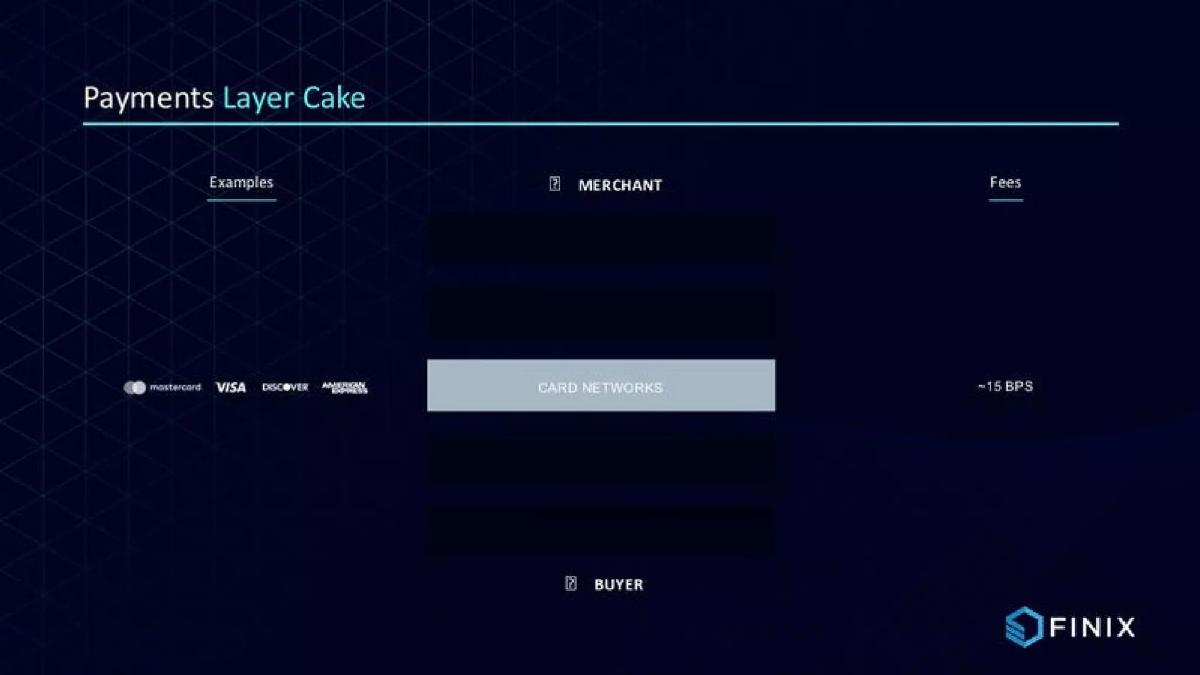
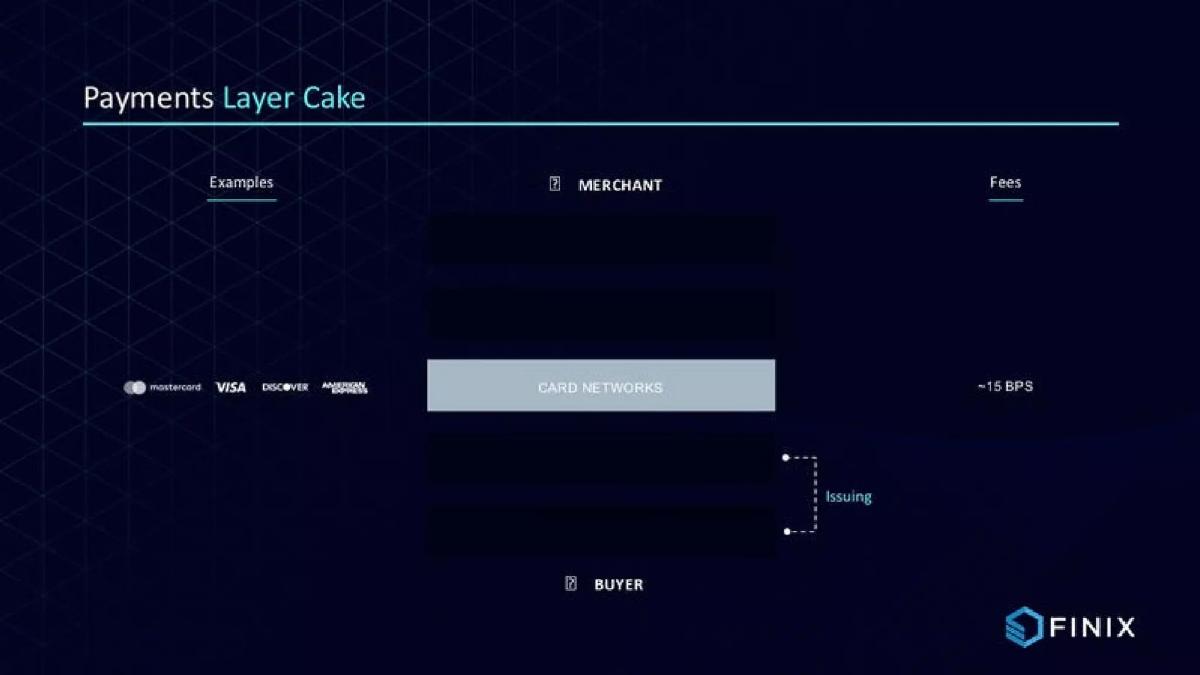
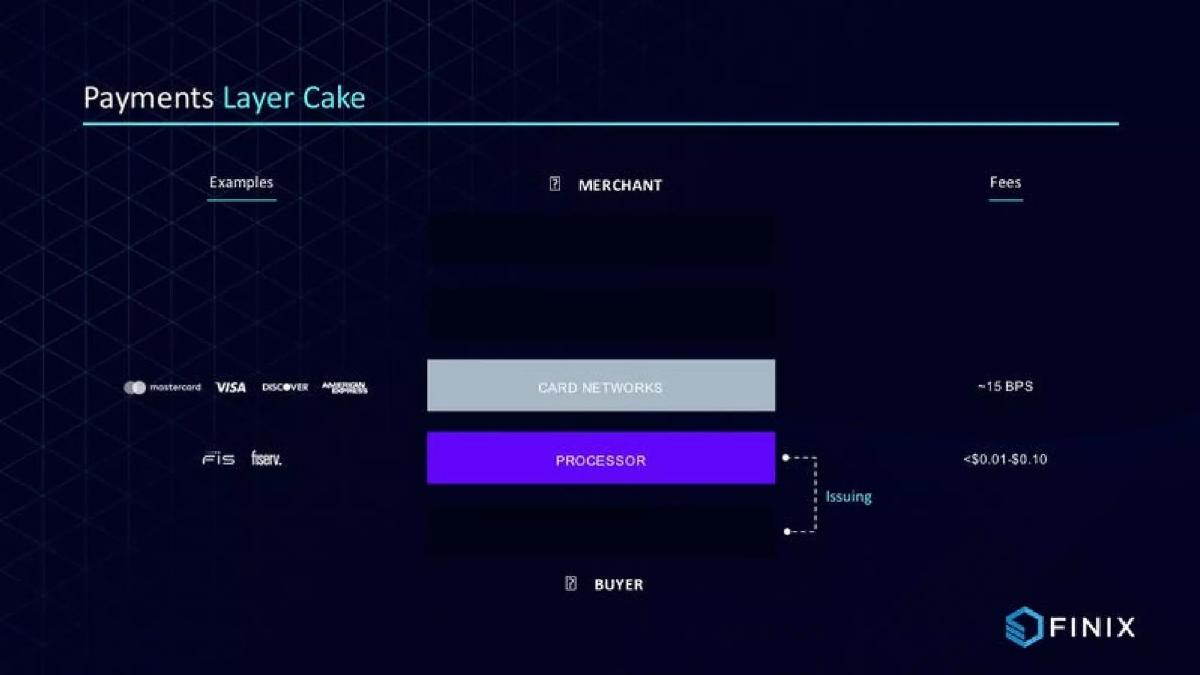
- The deck uses an 8-slide progressive build (Slides 3-10) to explain the 'Payments Layer Cake,' visually isolating each fee-taking middleman.
- Finix identifies a specific pain point for enterprises: a $3-5M upfront investment and 2-3 years of time-to-market to build in-house payments (Slide 12).
- The presentation frames payments as a profit center, citing a +$3M additional revenue potential per $100M processed (Slide 13).
- Market growth is quantified using third-party data, projecting $154B in revenue for software-led payments by 2027 (Slide 14).
- The deck maps the evolution of payment distribution from banks to software, positioning Finix at the end of a historical shift (Slide 15).
- Product functionality is summarized through 12 specific modules, ranging from 'Merchant Underwriting' to 'Dispute Management' (Slide 19).
- Target customer profiles are clearly defined as companies with $50M+ in Annual GMV and 100+ merchants (Slide 20).
- The deck entirely omits a team slide, which is unusual for a Series B, though common in decks released publicly after a round.
The Infrastructure Narrative: Finix's $30M Series B Strategy
Finix provides payments infrastructure that allows software companies to become their own payment processors. In their 2020 Series B deck, they avoid the common mistake of leading with technical specifications. Instead, they spend the first half of the deck building a case for why the current payments ecosystem is broken for large-scale software platforms. This teardown examines how they used a 21-slide sequence to turn a complex back-end service into a compelling margin-expansion story.
Slides 1-2: The Thesis
Slide 1 introduces the company as Payments Infrastructure-as-a-Service . The subtitle, "The next generation of payments companies will be built on Finix," sets a high-level vision. Slide 2 delivers the core thesis of the entire pitch: "Software Companies are Becoming Payments Companies." This is a classic 'Change in the World' opening that frames the rest of the presentation as a response to an inevitable market shift.
Slides 3-11: The Payments Layer Cake
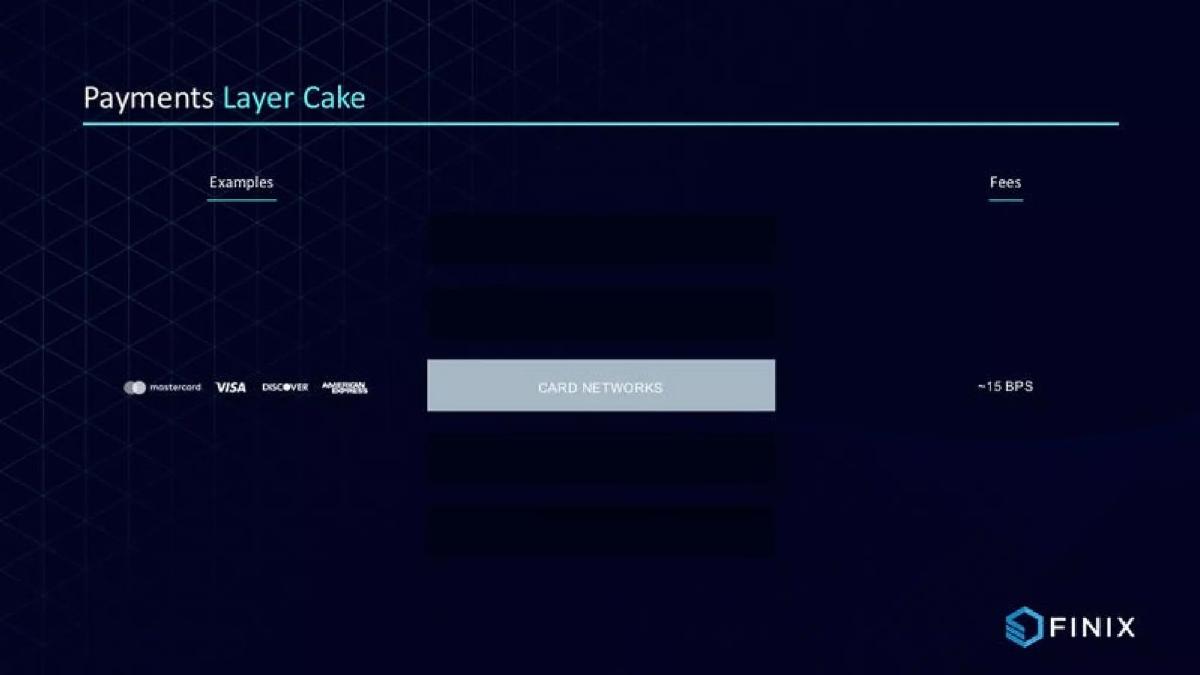
This is the most distinctive section of the deck. Finix uses a progressive build to educate the investor on the complexity of the payments value chain. Slide 3 starts with Card Networks (Mastercard, Visa) taking ~15 BPS. Slide 6 adds the Processor (FIS, Fiserv) taking Slide 7 adds the Bank (Bank of America, Citibank) taking 175 BPS. Slide 9 introduces the 'Processor + Bank' layer (First Data, Worldpay). Finally, Slide 10 adds the 'Payment Facilitators' (Stripe, Square) who take a massive 50-100 BPS.
By Slide 11 , the punchline is delivered: Finix enables companies to "cut out the middleman." The visual shows the Finix logo wrapping around the top layers of the cake, allowing the merchant to capture that 50-100 BPS fee for themselves. This 8-slide journey is a masterclass in building tension and then providing the resolution.
Slides 12-15: The Economic Opportunity
Having established the 'how,' Finix moves to the 'why.' Slide 12 quantifies the pain of the status quo: building this in-house requires a $3-5M upfront investment and 2-3 years of time-to-market. This slide effectively sets the 'price' of the problem Finix solves.
Slide 13 switches to the upside, stating that payments can provide +$3M in additional revenue per $100M processed and a 3-4x increase in TAM compared to a SaaS-only model. They use recognizable logos like Lightspeed and Kabbage to ground these claims in reality. Slide 14 provides the macro validation, citing a 30% CAGR for software-led payments and a $154B revenue projection by 2027 . Slide 15 provides a historical context, showing the 'Evolution of Payment Distribution' moving from Banks to ISOs to Direct to Integrated and finally to Software.
Slides 16-19: The Solution and Product
Slide 16 is a simple transition slide asking "Why?" which leads into a comparison of responsibilities. Slides 17 and 18 show a 'Then / Now' view of the payments stack. In the 'Then' view, traditional processors handle everything from compliance to merchant underwriting. In the 'Now' view, these responsibilities shift to the software provider. This justifies why a platform like Finix is necessary to manage that new complexity.
Slide 19 introduces the Finix Payments Platform . It uses a 3D stack visualization (Compliance, Finix Platform, Orchestration Layer, 3rd Party Networks) and lists 12 specific modules. This is the first time the deck gets truly technical, but because of the preceding 18 slides, the investor understands exactly what each module (like 'Tokenization & Vaulting' or 'Risk Management') is for.
Slides 20-21: Market Fit and Closing
Slide 20 defines the Ideal Customer Profile (ICP). They target companies with $50M+ in Annual GMV and 100+ Merchants . They categorize their market into seven verticals: Ecommerce, Billing, Fundraising, Booking, Travel/Ticketing, On-demand, and Marketplace. They list high-profile examples like Shopify, Uber, and Airbnb to show the caliber of companies that fit this profile. Slide 21 is a duplicate of Slide 20, likely a placeholder or error in the uploaded deck version.
What Works in the Finix Deck
The Progressive Reveal: The 'Layer Cake' sequence is highly effective. It prevents information overload and ensures the investor understands the fee structure of the industry before the product is shown. · Economic Framing: By framing payments as a 'Profit Center' rather than a 'Cost Center,' Finix elevates the conversation from a technical integration to a CFO-level strategic priority. · Quantified Pain: Stating the specific $3-5M cost and 2-year timeline to build in-house creates a clear ROI for the Finix solution. · Visual Consistency: The dark theme with neon blue and purple accents feels modern and 'infrastructure-grade,' matching the company's brand identity.
What is Missing from the Finix Deck
Team Slide: There is no mention of the founders or the engineering team. For a Series B, investors are betting heavily on the team's ability to scale. Its absence here is a significant omission. · Financial Performance: The deck lacks current revenue, growth rates, or burn. While it mentions '$50M+ GMV' as a target, it doesn't state Finix's own processed volume or ARR. · Competitive Landscape: While it mentions Stripe and Square as 'middlemen,' it doesn't address other infrastructure competitors like Marqeta or Adyen in a direct comparison. · The Ask: There is no slide detailing how much capital is being raised or how the funds will be allocated (e.g., hiring, international expansion, R&D).
What a Founder Should Copy
The 'Change in the World' Opening: Start with a macro shift (Slide 2) that makes your product's existence inevitable. · Educational Selling: If your product is complex, don't explain what it is first. Explain how the industry works and where the inefficiency lies (Slides 3-10). · Vertical Mapping: Clearly list the categories of customers you serve (Slide 20). This helps investors quickly map your solution to their existing portfolio or market knowledge. · Use Third-Party Data: Citing JP Morgan and Cowen Research (Slide 14) adds immediate credibility to your market size claims.
Frequently asked questions
- Why does the deck spend so many slides on the 'Layer Cake'?
- Finix is an infrastructure-as-a-service play, which can be abstract. By using Slides 3 through 10 to build the 'Payments Layer Cake' one piece at a time, they ensure the investor understands the 'middleman' problem before they present the solution. This builds a logical consensus that the current system is inefficient, making the Finix value proposition feel like an inevitable conclusion.
- Is it normal to omit the team slide in a Series B deck?
- In a live pitch, no. However, for decks shared in a catalogue or post-round, founders often redact the team slide to protect employee privacy or because their reputation is already well-known to the target VCs. For a $30M round, the team's pedigree was certainly a factor, even if it is not present in this specific version of the deck.
- How does Finix justify its market size?
- Finix uses Slide 14 to show that software-led payments are growing at 4x the rate of traditional providers. They cite a 30% CAGR and a projected $154B revenue pool by 2027. By anchoring their TAM (Total Addressable Market) in revenue rather than just GMV (Gross Merchandise Volume), they present a more realistic and attractive 'take rate' opportunity for investors.
- What is the primary 'hook' of this deck?
- The hook is 'Payments are Profit' (Slide 13). Most companies view payments as a cost of doing business. Finix flips this by showing that software companies can increase their TAM by 3-4x by becoming their own payment facilitator. This transforms the pitch from a technical tool discussion into a strategic business model transformation discussion.
- Who are the competitors mentioned in the deck?
- The deck mentions incumbents and partners rather than direct competitors. Slide 15 lists 'Software' peers like Square, Stripe, and Braintree. Slide 10 mentions Stripe and Square as 'Payment Facilitators' that take 50-100 BPS in fees. Finix positions itself as the infrastructure that allows companies to move *away* from those facilitators to keep more margin.