"Ahead of Plan" on a Pitch Deck: Show the Plan, the Actual
Founders often write that results are ahead of plan. Four real decks show what makes the claim checkable: the plan's figures, when it was set.
"Ahead of Plan" on a Pitch Deck: Show the Plan, the Actual and the Misses
"Ahead of plan" is one of the most common phrases in fundraising decks, and one of the least informative when it stands alone. It tells an investor that the founders believe they beat a target, but not what the target was, who set it, when, or by how much it was beaten. An investor has no way to tell a plan that was ambitious from one that was set low so it could be beaten. This guide looks at four real pages that make the claim, from a bare sentence to a full plan-versus-actual table, and sets out what makes the claim worth reading.
TL;DR
If you say you are ahead of plan, show the plan. Put the planned figure and the actual figure side by side for each metric, say when the plan was set and for whom (for example 'the plan shown to Series A investors in month one'), say how the plan was built, and show every metric in the plan, including any that fell short. WhiteHat Jr's summary page does most of this: a table of September actuals against the Series A plan for five metrics, an index for each, and a footnote dating the plan to the month the round closed. Its one weak row is NPS, where the printed actual (50) is below the printed plan (61) yet the cell reads '+11pp' in green. Fintern plots its loan arrears against a plan line and the market. Help Lightning and Uncapped state the claim in words with no figures, which a reader can only take on trust.
Four decks that claim to be ahead of plan
Each page is read at full size. Quotes are exact.
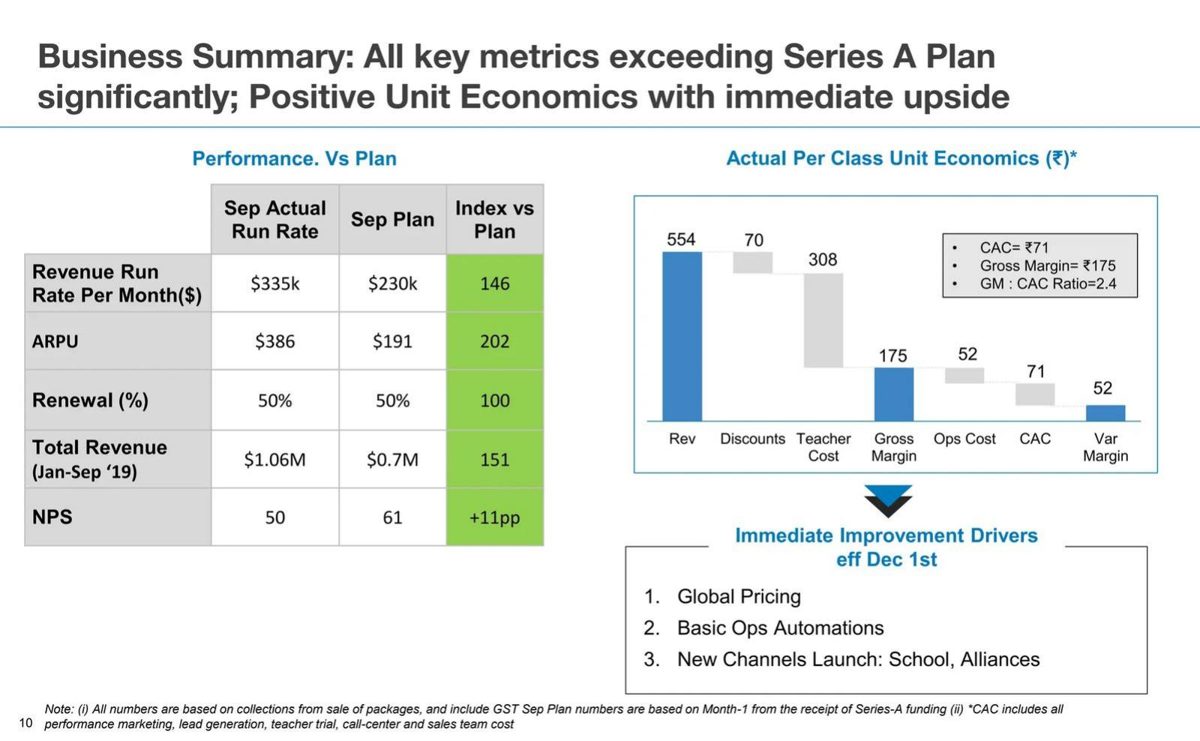
WhiteHat Jr traction slide — slide 10
Online coding classes. Business summary after a Series A.
WhiteHat Jr deck, slide 10. Exact stored slide matched to this analysis.
Our analysis: The most checkable claim of the four, weakened by one row.
Evidence and limitation: Plan and actual for five metrics, indexes that match, plan dated to the round; title overstates renewal and NPS cell contradicts its figures.
What a founder can adapt: Keep the table; make the title match every row and check each sign.
Supporting analysis
What the deck claims: "Performance. Vs Plan"; columns "Sep Actual Run Rate", "Sep Plan", "Index vs Plan"; NPS "50" vs "61", "+11pp"; "Sep Plan numbers are based on Month-1 from the receipt of Series-A funding".
Presentation choice: Shows a complete plan-versus-actual table with a dated plan.
When it does not fit: A green plus sign on a figure that is below plan.
Figures. Is the planned figure printed beside each actual?
Date. Does the slide say when the plan was set and who saw it?
Method. Does it say, in a phrase, how the plan was built?
Completeness. Are metrics that were met or missed shown too?
Consistency. Do every colour, sign and the title agree with the numbers?
Copyable framework: "[Metric], [period]: [actual] vs [round] plan of [plan] (set [month year]); +[x]%."
Illustrative example 1 — written by us
Before: "Revenue is ahead of plan."
After: "March 2020 revenue: [actual] vs plan of [plan] (plan set [month year])."
What improved: Our illustrative rewrite of Help Lightning's sentence. Bracketed figures are not stated on the slide.
Illustrative example 2 — written by us
Before: "All key metrics exceeding Series A Plan significantly"
After: "Revenue and ARPU well ahead of Series A plan; renewal on plan; NPS [above/below] plan"
What improved: Our illustrative rewrite of WhiteHat Jr's title, matched to the rows of its own table.
The question this guide answers
This guide answers one founder question: when I tell investors we are ahead of plan, what do I need to put on the slide so that they can check it?
Our progress-since-last-round draft covers the whole period between two rounds, and recommends comparing results with the earlier plan as one part of that story. Our actuals-vs-forecast draft covers how to mark where real numbers end and projections begin on a single chart. This guide is narrower than the first and different from the second: it is about the specific claim of outperformance against a plan, and what evidence turns that claim from a statement into something an investor can verify. A deck can make this claim anywhere, on a summary page, a traction page or an executive summary, so the advice applies wherever the phrase appears.
How we chose and read the examples
We searched extracted text across the library for phrases such as 'ahead of plan', 'exceeding plan', 'vs plan', 'versus budget' and 'beat forecast'. There were 14 matches. We set aside listed companies, resource and energy filings, and pages where 'plan' meant something other than a business target. We kept four private-company pages that make the claim at four different levels of evidence: a full table, a chart, a sentence, and a bullet.
Each page was rendered from the source document and read at full size. In the copy of Uncapped's deck we have, several bullets on the same page are replaced with the word '[CONFIDENTIAL]'; we describe only what is visible. Fintern's chart does not print its values, so any figures we give for it are our estimates from the chart. Figures we calculate use only numbers printed on the slides. We did not check any figure against outside sources, and we do not know whether any of these companies' plans were later revised.
Why the plan matters as much as the result
A plan is a number the founders chose. Beating it says as much about how the number was set as about how the business performed. An investor reading 'ahead of plan' will ask, often silently, whether the plan was demanding.
Previous investors can confirm it. If the plan was shown to existing investors, a new investor may ask them about it. A claim that the plan does not support is likely to come out in diligence, and will look worse then than if the slide had been precise.
Selection is easy to hide. A plan usually covers several metrics. Reporting only the ones that were beaten is a quiet form of cherry-picking, and experienced investors look for the missing rows.
Size matters. Being 2% ahead and 50% ahead are very different stories. The phrase alone treats them as the same.
A full plan-versus-actual table: WhiteHat Jr
WhiteHat Jr, an online coding-class company, titles its page 10 'Business Summary: All key metrics exceeding Series A Plan significantly; Positive Unit Economics with immediate upside'. The left half is a table headed 'Performance. Vs Plan' with three columns: 'Sep Actual Run Rate', 'Sep Plan' and 'Index vs Plan'.
The rows read: revenue run rate per month '$335k' against '$230k', index '146'; ARPU '$386' against '$191', index '202'; renewal '50%' against '50%', index '100'; total revenue for January to September 2019 '$1.06M' against '$0.7M', index '151'; and NPS '50' against '61', shown as '+11pp'. The indexes for the first four rows match the printed figures: 335 divided by 230 is about 1.46, 386 divided by 191 is about 2.02, and 1.06 divided by 0.7 is about 1.51.
A footnote does two useful things. It says what the revenue figures measure ('based on collections from sale of packages, and include GST'), and it dates the plan: 'Sep Plan numbers are based on Month-1 from the receipt of Series-A funding'. That tells a reader the plan was set when the last round closed, which is the version previous investors would have seen.
This is the most complete of the four pages. Every figure has its plan beside it; the size of the outperformance is visible; and one row, renewal, is shown as exactly on plan rather than dropped.
Two things weaken it. First, the title says 'All key metrics exceeding' plan, but renewal is level with plan, not above it. Second, the NPS row. As printed, the actual (50) is lower than the plan (61), which for NPS would be a shortfall, yet the index cell reads '+11pp' and is shaded green like the beats. Either the two figures are in the wrong columns, or a miss is presented as a beat. We cannot tell which from the page, and neither can an investor. On a slide whose purpose is to prove outperformance, one cell that contradicts its own numbers invites the reader to recheck all the others.
The right half of the page shows per-class unit economics as a waterfall in rupees, from revenue (554) through discounts (70) and teacher cost (308) to gross margin (175), then operating cost (52) and CAC (71) to a variable margin of 52. The steps reconcile to within one rupee of rounding. It supports the second half of the title rather than the plan claim, and the currency switch from dollars on the left to rupees on the right is worth a reader's attention.
A plan line on a chart: Fintern
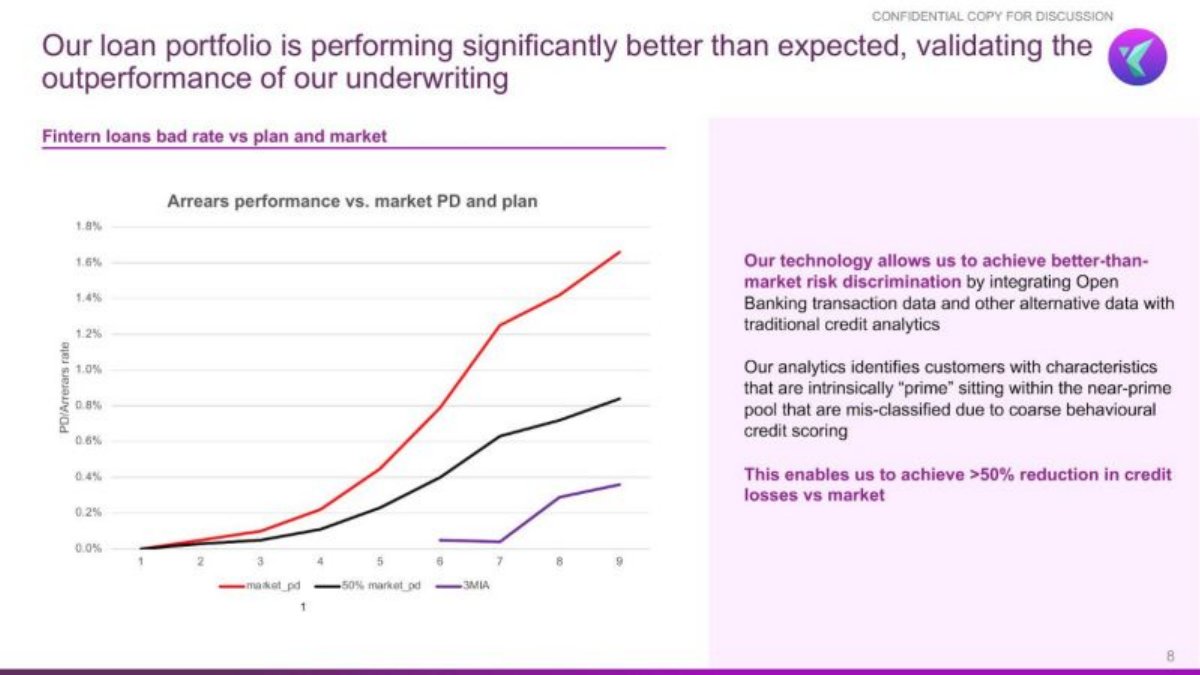
Fintern, a UK consumer lender, titles its page 8 'Our loan portfolio is performing significantly better than expected, validating the outperformance of our underwriting'. The chart is headed 'Fintern loans bad rate vs plan and market' and 'Arrears performance vs. market PD and plan'.
Three lines are plotted against an unlabelled horizontal axis numbered 1 to 9: 'market_pd' in red, '50% market_pd' in black, and '3MIA' in purple. By our reading of the chart, the market line rises to about 1.65% at point 9, the 50% line to about 0.84%, and Fintern's own line, which starts only at point 6, to about 0.36%.
The page lets a reader see the plan and the actual on the same scale, which is the main thing a plan claim needs. The legend also hints at how the plan was built: the black line appears to be half the market default rate, so the company seems to have planned for losses at half the market's level. That is useful, because it tells the reader the plan was already an ambitious one.
Much is left for the reader to infer. The legend never says which line is the plan; we infer it from the title. The horizontal axis has no label, so the reader has to guess that the numbers are months on book. '3MIA' is not explained on the page (in lending it usually means three months in arrears). The company's own line covers four points, which may reflect a young loan book, and the page does not say how many loans it represents. The side panel goes further than the chart, claiming a reduction in credit losses of more than 50% against the market; the chart shows arrears, not losses, over a short period.
A sentence with no figures: Help Lightning
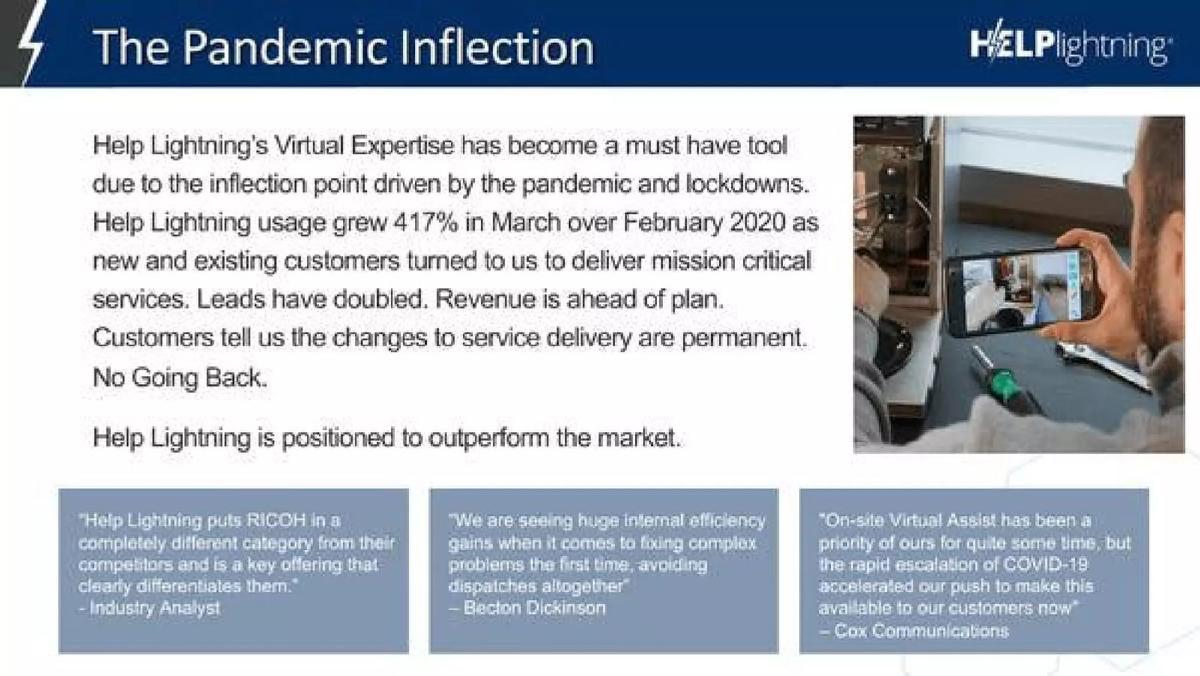
Help Lightning, a remote video-assistance company, headed its page 6 'The Pandemic Inflection'. The paragraph reads, in part: 'Help Lightning usage grew 417% in March over February 2020 as new and existing customers turned to us to deliver mission critical services. Leads have doubled. Revenue is ahead of plan.' Three customer and analyst quotes sit below.
Note the contrast within one paragraph. The usage claim has a percentage and the two months it compares. The leads claim has a multiple but no period or base. The revenue claim has nothing: no plan figure, no actual, no date, and no indication of whose plan. Given the timing, a reader may also wonder whether the plan predates the pandemic, in which case beating it is partly a statement about the plan.
The sentence is not wrong to include. It is weaker than the other two claims around it, and a reader will weight it accordingly. A single added line, such as 'revenue for March [figure] against plan of [figure]', would have put it on the same footing.
A bullet on a summary page: Uncapped
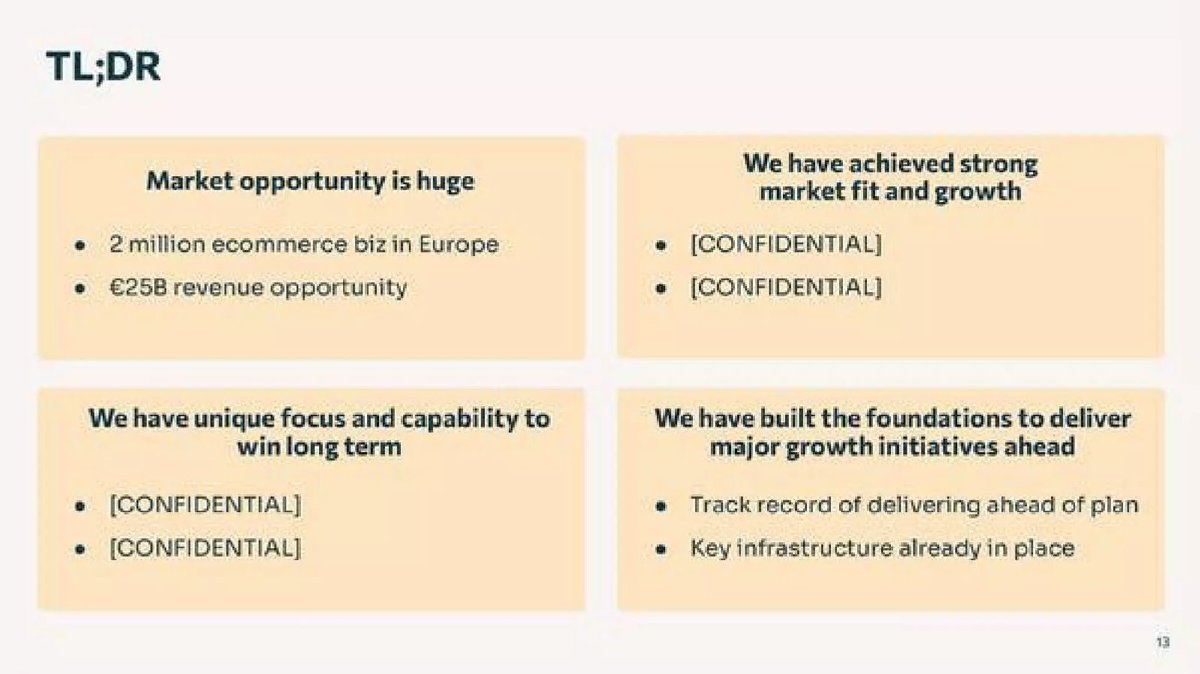
Uncapped, a revenue-based financing company for e-commerce businesses, uses page 13 as a 'TL;DR' with four boxes. One box is headed 'We have built the foundations to deliver major growth initiatives ahead', and its first bullet reads 'Track record of delivering ahead of plan'. In our copy, the bullets in two other boxes are replaced with '[CONFIDENTIAL]'.
On a summary page, short claims are normal; the detail is meant to sit elsewhere in the deck. The question for the founder is whether it does. If a later slide shows the plans and results that make up the track record, the bullet is a fair signpost. If no slide does, the bullet asks the investor to accept a pattern of outperformance without a single example. We can't tell which applies here from this page alone.
'Track record' also claims more than one result: it suggests the company has met plans repeatedly. That is a stronger claim than being ahead this quarter, and it needs more support, for example a short list of past plan targets and outcomes.
What to put on the slide
The plan figure and the actual figure, side by side, for each metric. An index or percentage is a convenience, not a substitute: show the underlying numbers so the reader can check the arithmetic, as WhiteHat Jr does.
When the plan was set and who saw it. 'Plan presented to seed investors, March 2023' or WhiteHat Jr's 'Month-1 from the receipt of Series-A funding'. If the plan has been revised since, say so and show which version you are comparing against.
How the plan was built, in a phrase. Fintern's '50% market_pd' implies a method; say it outright ('plan: half of market default rate').
Every metric in the plan. Include the ones that were met or missed. One missed row with a short reason is more credible than a slide of unbroken wins, and it protects the rest of the table.
Consistent signs and colours. A green cell or a plus sign must agree with the figures in its row. Check each one.
A title the table supports. If one metric only matched plan, 'all key metrics exceeding plan' is not accurate. 'Revenue and ARPU well ahead of plan; renewal on plan' is.
A period and a base. 'Ahead of plan' for one month, one quarter and a full year are different claims. State the period.
Templates
Table header: 'Performance vs [round] plan (plan set [month year]; actuals to [month year])'. Columns: Metric | Plan | Actual | Difference.
Chart legend: 'Actual', 'Plan ([how built], set [date])', and any benchmark labelled separately.
Sentence form, when there is no room for a table: '[Metric] for [period]: [actual] against plan of [plan] (+[x]%).'
Summary bullet that points to proof: 'Ahead of plan on [n] of [m] metrics since [round] (slide [x])'.
What these examples can and cannot show
These four pages show how founders present a plan claim, and what a reader can and cannot verify from the page. They cannot show whether the plans were demanding, whether the actuals were later confirmed, or whether showing the plan helped any of these rounds. We do not know how any investor reacted to them.
The set is small and chosen to show different levels of evidence. It is not a measure of how often decks make this claim or how often the claim is supported. For WhiteHat Jr's NPS row, we report what is printed and do not guess which figure is the actual.
Common mistakes
No plan figure. 'Ahead of plan' with nothing to compare against.
Undated plan. No date or audience for the plan, so it could have been set at any time.
Only the wins. Missed or matched metrics left off the table.
Contradictory cell. A colour or sign that disagrees with the row's figures.
Title overreach. 'All metrics ahead' when one is only level.
Unnamed plan line. A chart where the reader must guess which line is the plan.
Diagnostic checklist
Plan and actual printed side by side.
Plan date and audience stated.
Plan method stated in a phrase.
Matched and missed metrics included.
Signs, colours and title checked against the numbers.
Period stated for every comparison.
Frequently asked questions
Should I show the plan if we only just beat it?
Yes. A small, documented beat is still evidence that you forecast well. A large beat with no plan shown is harder to believe than a small one with the figures.
What if we revised the plan during the year?
Say which version you are comparing against and when it changed. Showing both the original and revised plan, as some decks do, is the most transparent option.
Is a benchmark the same as a plan?
No. A market or peer benchmark is an outside reference; a plan is your own target. Fintern shows both; label them separately so the reader doesn't confuse beating the market with beating your own forecast.
How we chose these examples
Corpus: published pitch deck teardowns on StartupFundraising.com. Founder-uploaded private decks are excluded.
Selection (2026-10-01): we searched extracted text for 'ahead of plan', 'exceeding plan', 'vs plan', 'versus budget' and similar phrases (14 matches), set aside listed companies, resource and energy filings and non-business uses of 'plan', and kept four private-company pages making the claim at different levels of evidence.
Review: the four pages were rendered from the source documents on 2026-10-01 and read in full at full size against company, document and page number (editorial model review, with AI assistance in drafting; not human-reviewed). Calculated figures use only numbers printed on the slides; Fintern's chart values are our estimates. No figure was checked against outside sources.