The WhiteHat Junior deck is a data-heavy presentation that prioritizes operational mechanics over aesthetic flair. It successfully demonstrates a 'first-mover advantage' by detailing a rigorous teacher selection process where only 1% of applicants reach the final audit stage. Financially, the deck is exceptionally transparent, showing a Gross Margin to CAC ratio of 2.4 and a clear path to profitability by Q11 of their 12-quarter plan. The deck also outlines a pivotal shift from a premium 1-to-1 model ($500/student/year) to a more scalable 1-to-4 model ($250/student/year) to capture a larger s…
Key takeaways
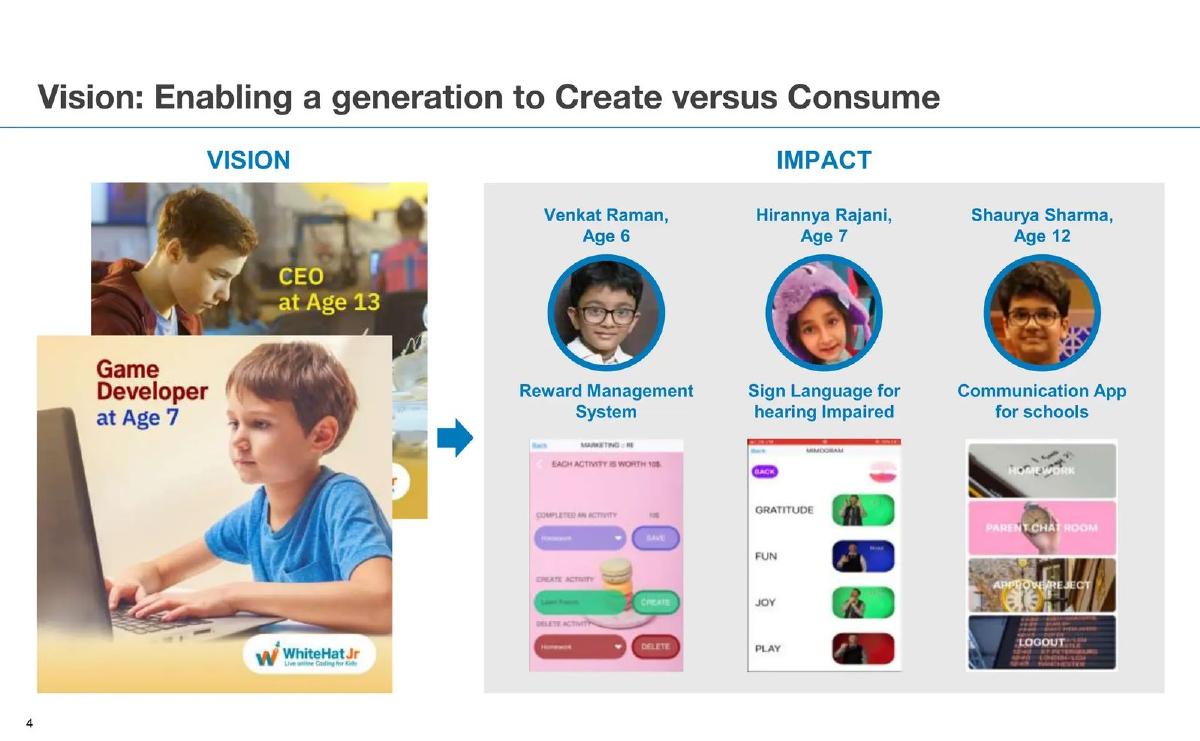
- The vision focuses on moving children from 'consuming' to 'creating,' illustrated by students as young as age 7 building apps (Slide 4).
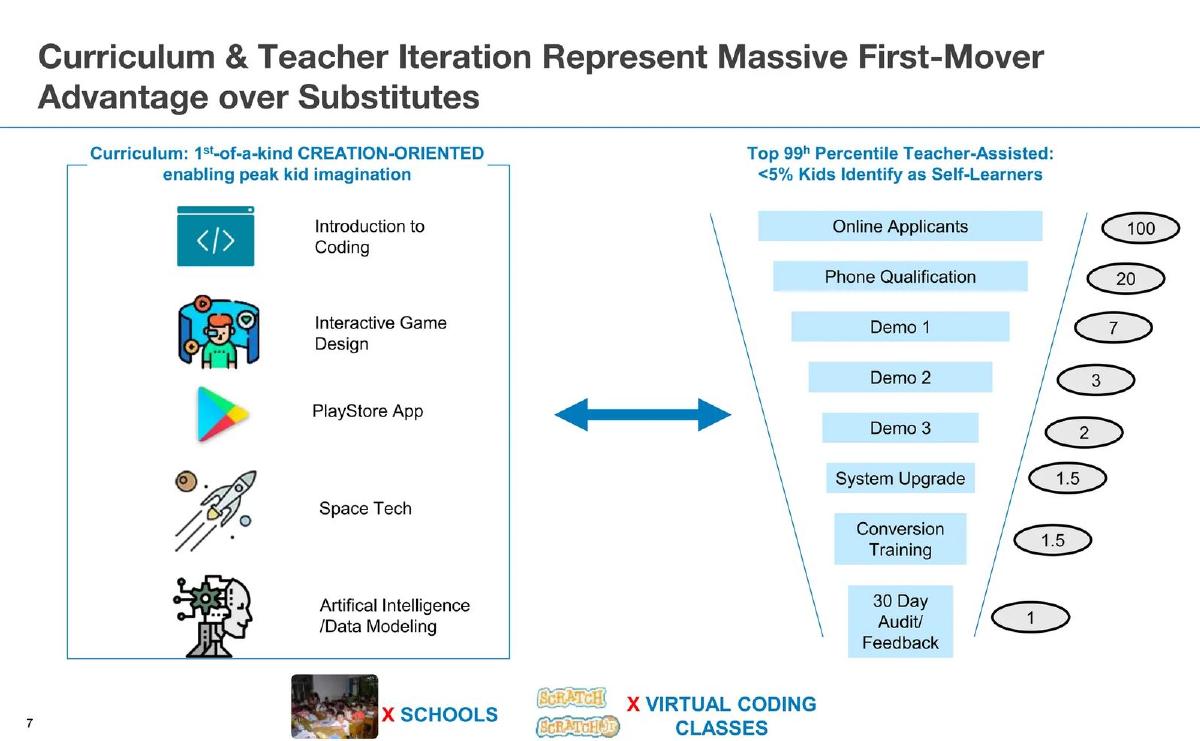
- A highly selective teacher funnel is a core competitive moat, with only 1 out of every 100 applicants passing the 30-day audit (Slide 7).
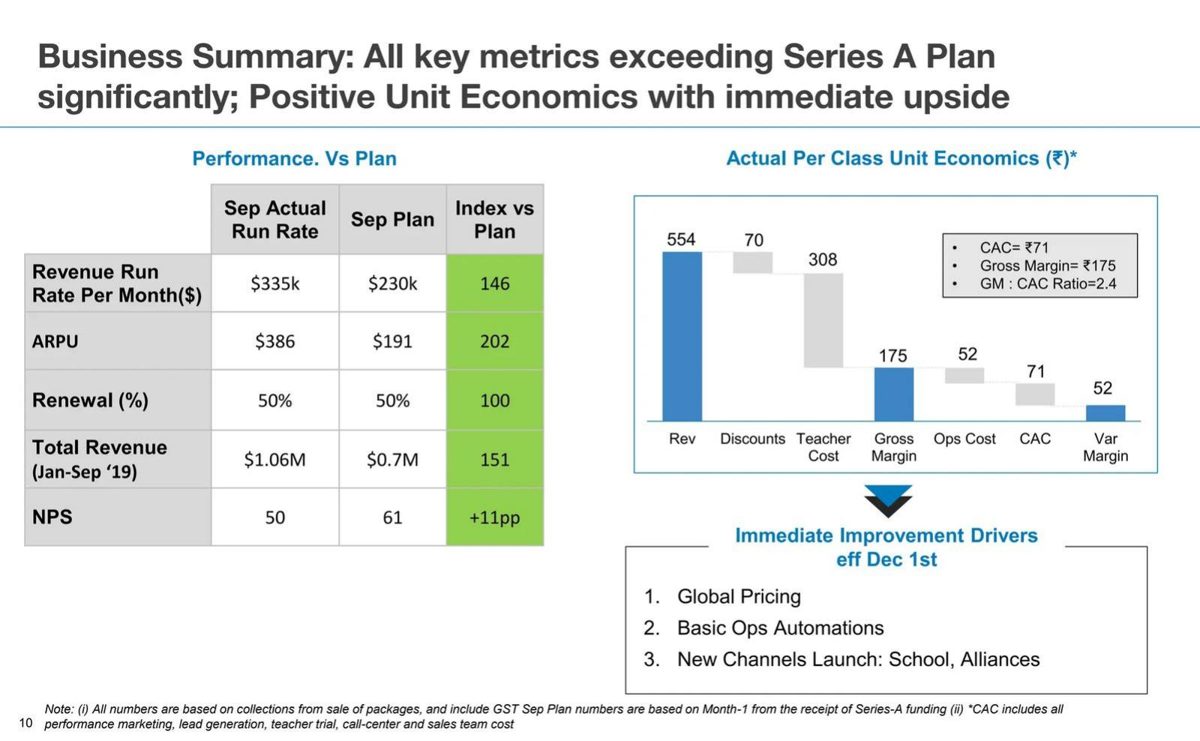
- Actual performance significantly exceeded the Series A plan, with a monthly revenue run rate of $335k against a $230k plan (Slide 10).
- Unit economics are detailed down to the rupee, showing a Gross Margin of ₹175 against a CAC of ₹71 per class (Slide 10).
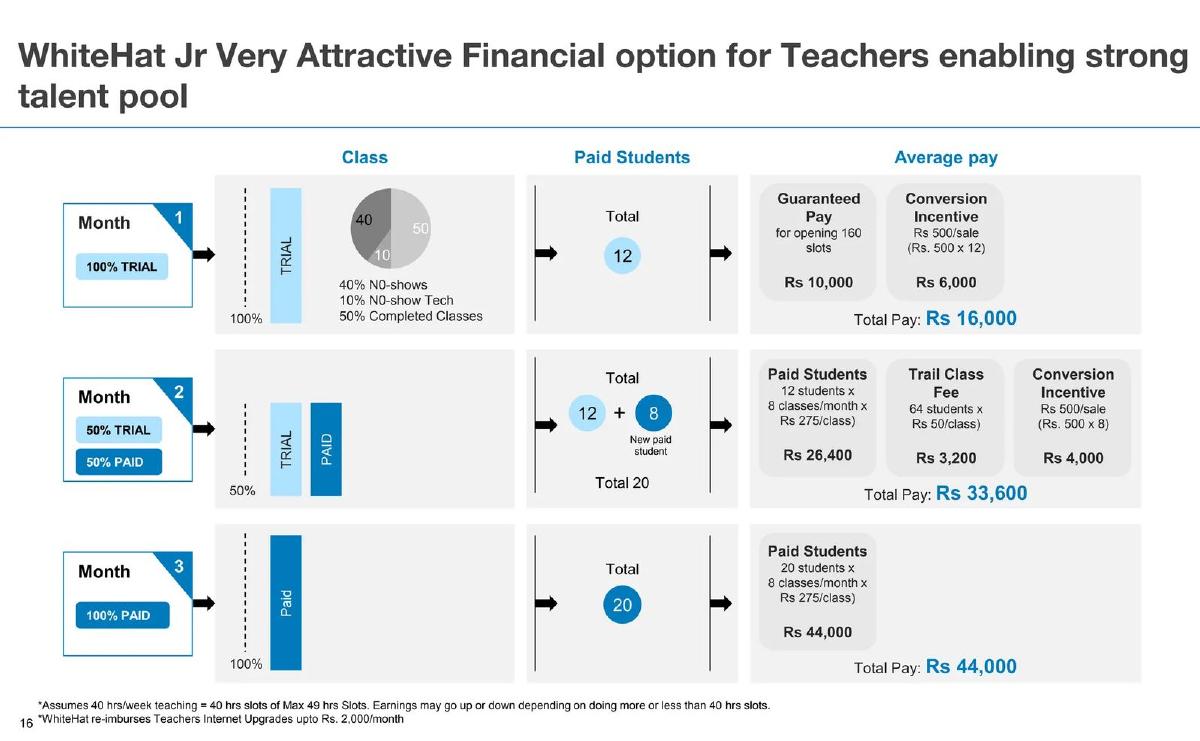
- Teacher compensation is structured to incentivize conversion, with total monthly pay potential reaching ₹44,000 by Month 3 (Slide 16).
- The company identified a massive market expansion opportunity by introducing a 1-to-4 student-teacher ratio, aiming for an $8.2Bn total market size (Slide 19).
- Financial projections anticipate reaching net profitability in Q11, with cumulative students projected to hit 436,764 by Q12 (Slide 22).
Introduction
The WhiteHat Junior pitch deck is a clinical, data-driven document that focuses heavily on the 'how' of scaling an EdTech business. Unlike many early-stage decks that rely on broad market platitudes, this presentation dives deep into the weeds of teacher acquisition funnels, per-class unit economics, and tiered pricing models. It is clearly designed for investors who prioritize operational efficiency and clear paths to profitability over pure growth-at-all-costs narratives.
Slide 1: Title Slide
The deck opens with a minimalist title slide: 'WhiteHatJr Intro Deck' with an update date of October 15th. The branding is consistent, featuring the logo and the tagline '{ Live Online Coding for Kids }'. There are no flashy graphics here, setting a professional, no-nonsense tone for the rest of the presentation.
Slide 4: Vision and Impact
Slide 4 establishes the emotional and practical core of the business. The vision is stated as 'Enabling a generation to Create versus Consume.' The slide uses three specific student case studies to prove the product's efficacy: Venkat Raman (Age 6) who built a Reward Management System, Hirannya Rajani (Age 7) who developed a Sign Language app, and Shaurya Sharma (Age 12) who created a Communication App for schools. By showing actual screenshots of student-built apps, the company moves the 'coding for kids' concept from a theoretical benefit to a tangible output.
Slide 7: The Teacher Supply Chain Moat
This is one of the most critical slides in the deck. It argues that 'Curriculum & Teacher Iteration Represent Massive First-Mover Advantage.' The slide presents a teacher recruitment funnel that is remarkably steep. Starting with 100 online applicants, the numbers dwindle through phone qualifications (20), three stages of demos (7, 3, and 2 respectively), and conversion training (1.5), finally resulting in only 1 teacher passing the 30-day audit. This 1% selection rate is presented as a barrier to entry for competitors, suggesting that WhiteHat Junior’s value lies not just in the software, but in the quality of the human capital they have successfully vetted.
Slide 10: Business Summary and Unit Economics
Slide 10 provides a 'Business Summary' that compares actual performance against the Series A plan. The metrics are impressive: a monthly revenue run rate of $335k (146% of plan) and an ARPU of $386 (202% of plan). The right side of the slide features a waterfall chart for 'Actual Per Class Unit Economics' in Rupees. It shows a Gross Margin to CAC ratio of 2.4, which is a healthy benchmark for a service-heavy business. The slide also lists 'Immediate Improvement Drivers' such as global pricing and basic ops automations, signaling to investors that there is still 'low-hanging fruit' for margin expansion.
Slide 13: Agenda
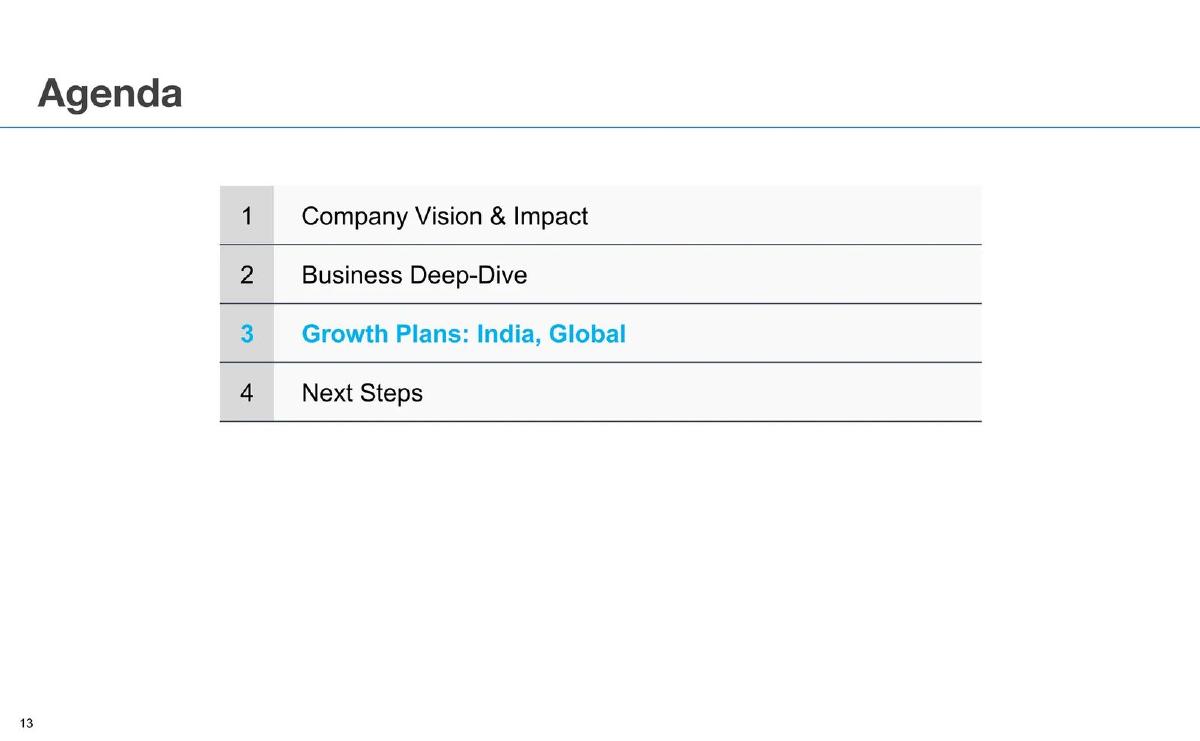
A simple transition slide that breaks the presentation into four parts: Company Vision & Impact, Business Deep-Dive, Growth Plans, and Next Steps. The 'Growth Plans' section is highlighted in blue, indicating the focus of the subsequent slides.
Slide 16: Teacher Financial Incentives
Slide 16 is a rare look into the 'gig economy' side of EdTech. It details how a teacher’s pay scales over three months. In Month 1, the teacher is 100% focused on trial classes, earning a total of ₹16,000. By Month 3, the teacher is 100% focused on paid classes, and their total pay jumps to ₹44,000. This slide serves two purposes: it proves the model is attractive enough to recruit high-quality talent, and it shows how the company manages the transition from lead generation (trials) to revenue generation (paid students) at the individual teacher level.
Slide 19: Market Expansion and Product Tiers
Slide 19 addresses the scalability of the 1-to-1 model. The company introduces a 'New Product Environment' that includes a 1-to-4 offering at $250/student/year, half the price of the 1-to-1 model. The slide uses a pyramid diagram to show that while the 1-to-1 model captures a $4.4Bn market, the introduction of the 1-to-4 model expands the total addressable market to $8.2Bn. This demonstrates strategic thinking regarding market saturation and the need for a 'middle-market' product to maintain high growth rates.
Slide 22: The 3-Year Financial Plan
The final slide in this selection is a comprehensive P&L and Cash Flow table covering 12 quarters. It projects a massive scale-up in teachers (from 239 in Q1 to 16,495 in Q12) and students (from 4,048 to 436,764). The most important row is 'Net Profit / (Loss),' which shows the company burning cash until Q10, then turning a profit of $1.11M in Q11 and $2.63M in Q12. This 'J-curve' is standard for venture-backed startups, but the level of detail provided—including renewal rates fixed at 50% and price increases of 6%—adds a layer of credibility to the projections.
What Works in This Deck
Granular Unit Economics: The inclusion of Slide 10 is the deck's strongest point. By breaking down the cost of a single class, the founders demonstrate they have a firm grip on their margins. Investors can clearly see where the money goes (teacher costs being the largest chunk) and how much is left to cover overhead and growth.
Supply-Side Focus: Most EdTech decks focus exclusively on the student. WhiteHat Junior correctly identifies that in a live-teaching model, the teacher is the bottleneck. Slides 7 and 16 prove they have a system for finding, vetting, and retaining talent at scale.
Evidence of Execution: By showing that they are already beating their Series A plan (Slide 10), the founders build immediate trust. It is much easier to raise money when you can prove that your previous projections were conservative.
What Is Missing
Team Slide: In the 8 slides provided, there is no mention of the founding team or their backgrounds. In a high-execution business like this, the pedigree of the leadership team is usually a major selling point.
Competitive Landscape: While the deck mentions 'substitutes' on Slide 7, it does not name specific competitors or explain how WhiteHat Junior wins against other coding platforms or traditional after-school programs.
Technology Architecture: The deck treats the platform as a 'black box.' There is no information on how the live video is delivered, how the curriculum is managed, or what proprietary tech they have built to handle 16,000+ teachers simultaneously.
What a Founder Should Copy
The 'Actual vs. Plan' Comparison: If you have traction, use a table like the one on Slide 10. It shows you are disciplined and that your business model is working in the real world, not just on a spreadsheet.
The Funnel Visualization: Slide 7’s teacher funnel is an excellent way to visualize quality control. If your business relies on a specific type of labor or partner, show the investor exactly how hard it is to get through your door.
Tiered Market Analysis: Slide 19 is a great example of how to present a 'Product Roadmap' as a 'Market Expansion' strategy. Instead of just saying 'we will add group classes,' they show how group classes double their TAM.
Frequently asked questions
- How does WhiteHat Junior justify its teacher quality?
- According to Slide 7, the company employs a rigorous 8-step selection process. This includes online applications, phone qualifications, three separate demo stages, system upgrades, conversion training, and a 30-day audit. The funnel shows that for every 100 applicants, only 1 teacher is eventually onboarded, allowing them to claim a 'Top 99th Percentile' teacher base.
- What are the specific unit economics per class?
- Slide 10 breaks down the per-class economics in Indian Rupees (₹). Revenue per class is ₹554. After subtracting ₹70 for discounts and ₹308 for teacher costs, the Gross Margin stands at ₹175. Further deductions for Ops costs (₹52) and CAC (₹71) leave a Variable Margin of ₹52 per class.
- What is the growth strategy for reaching lower-income segments?
- Slide 19 details a shift from a pure 1-to-1 model to a 1-to-4 offering. While the 1-to-1 model costs $500/student/year, the 1-to-4 model drops the price to $250. The company expects this to unlock a segment of 19.8 million students who were previously priced out, expanding the total market size to approximately $8.2 billion.
- How does the company handle teacher retention and incentives?
- Slide 16 outlines a three-month ramp-up for teachers. In Month 1, teachers earn a guaranteed pay of ₹10,000 plus incentives. By Month 3, as their schedule shifts to 100% paid classes, their earning potential increases to ₹44,000 per month. This structure ensures teachers are compensated during the 'trial' phase while pushing for high student conversion.
- What are the long-term financial projections for the company?
- Slide 22 presents a 12-quarter plan. It projects revenue growing from $0.8M in Q1 to $35.1M in Q12. While the company projected net losses for the first ten quarters, it expected to turn a net profit of $1.11M in Q11, reaching a cumulative student base of over 436,000.