How delivery, e-commerce and subscription-box startups show what one order earns after product, packaging, shipping and fees.
Per-Order Unit Economics Slide: What One Order Earns
Businesses that ship or deliver physical orders pay costs every time an order goes out: the product, packaging, delivery, payment processing and often waste or returns. The per-order slide shows the order value, subtracts each of those costs, and ends with what the company keeps. Investors check whether the lines add up, which costs are included, whether the figures are actual or planned, and whether customer acquisition is inside or outside the number. This guide compares seven real slides on those points.
TL;DR
Start from the order value, list each cost per order, end with contribution per order, and say whether it's actual or a target and which costs sit outside it. Chiper's slide adds up, is dated (September 2021) and shows how each improvement moves $1.00 per order to $3.00. Eaze's waterfall adds up to $21.45 per transaction. Yumi and WineSimple also add up, with WineSimple a cent off. Bento's rows don't: its October costs leave $2.19, not the $0.16 shown. Just Cause Coffee gives a cost and price but leaves out shipping. Fynd shows the right lines with the numbers blanked out.
Per-order unit economics slides from real pitch decks
Each example shows the slide above its analysis and links to the full teardown. Complete, dated breakdowns that add up come first. Claims are as shown on the slides; calculations and comments are ours.
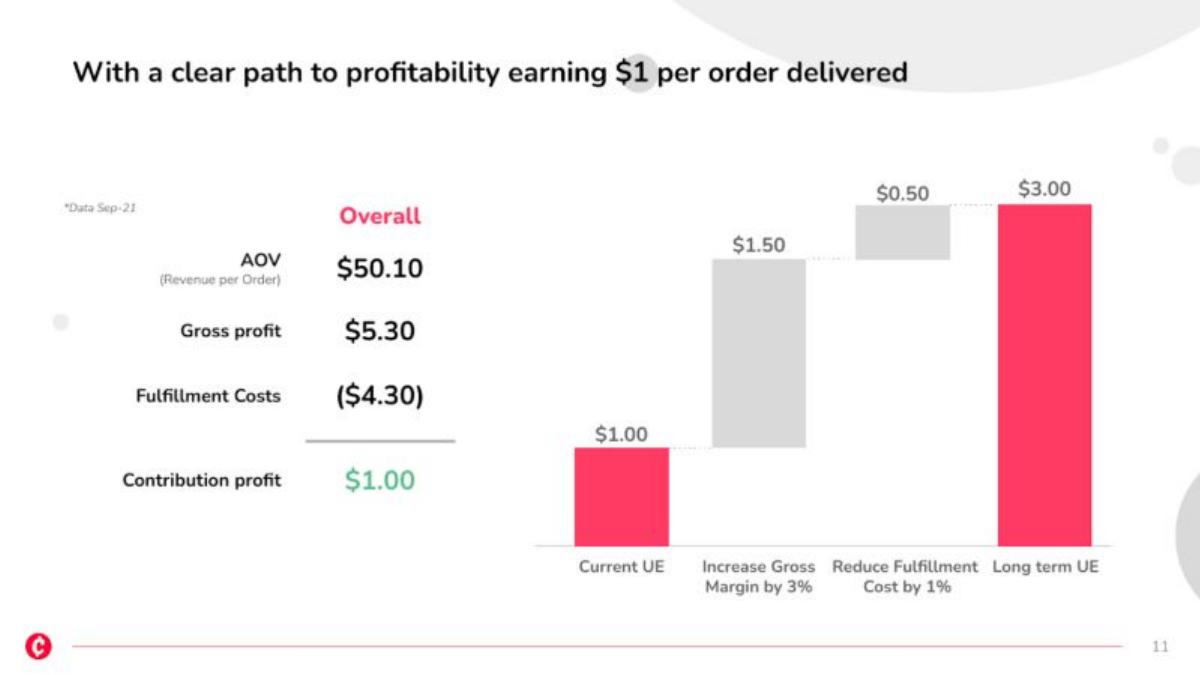
Chiper unit economics slide — slide 11
Wholesale ordering platform for small corner shops in Latin America. A different page of this deck appears in the run-rate guide.
Chiper deck, slide 11. Exact stored slide matched to this analysis.
Our analysis: Dated actuals plus a costed path to a target.
Evidence and limitation: It adds up: $5.30 − $4.30 = $1.00, and $1.00 + $1.50 + $0.50 = $3.00. Gross margin is about 10.6% of order value. The improvement steps are percentage points of order value: 3% of $50.10 is about $1.50, and 1% of $50.10 is about $0.50. "Reduce fulfillment cost by 1%" means one point of order value, not 1% of the $4.30 (which would be about 4 cents). No acquisition cost or overhead, which the slide doesn't mention.
What a founder can adapt: Label the steps precisely: "+3 points gross margin (of order value)"; add "before marketing and overhead".
Supporting analysis
What the deck claims: "With a clear path to profitability earning $1 per order delivered." "*Data Sep-21." "Overall: AOV (Revenue per Order) $50.10; Gross profit $5.30; Fulfillment Costs ($4.30); Contribution profit $1.00." A waterfall: "Current UE $1.00", "Increase Gross Margin by 3% $1.50", "Reduce Fulfillment Cost by 1% $0.50", "Long term UE $3.00".
Presentation choice: Every number can be recomputed, and the path from $1 to $3 shows which levers matter.
When it does not fit: Percentages that can be read two ways.
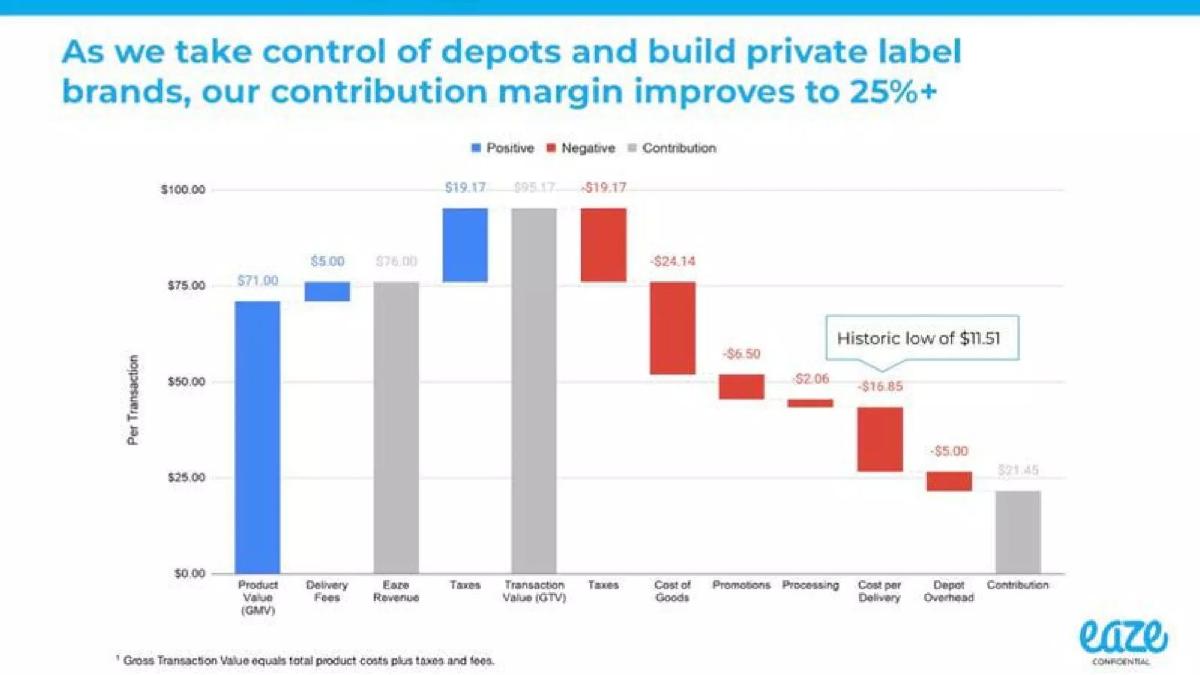
Eaze deck, slide 9. Exact stored slide matched to this analysis.
Our analysis: A complete single-order waterfall, including overhead at the depot.
Evidence and limitation: Every step adds up: $76.00 − $24.14 − $6.50 − $2.06 − $16.85 − $5.00 = $21.45, about 28% of the $76 revenue. Taxes are shown going in and out, so they don't inflate revenue. The title describes a future improvement, but the chart doesn't say whether these figures are current, an average, or the planned state. The callout suggests delivery cost has been as low as $11.51 against the $16.85 used.
What a founder can adapt: Add a label: "[Period] average, actual" or "Target once depots are owned".
Supporting analysis
What the deck claims: "As we take control of depots and build private label brands, our contribution margin improves to 25%+." A waterfall per transaction: Product Value (GMV) $71.00; Delivery Fees $5.00; Eaze Revenue $76.00; Taxes $19.17; Transaction Value (GTV) $95.17; Taxes −$19.17; Cost of Goods −$24.14; Promotions −$6.50; Processing −$2.06; Cost per Delivery −$16.85 (callout: "Historic low of $11.51"); Depot Overhead −$5.00; Contribution $21.45. Footnote: "Gross Transaction Value equals total product costs plus taxes and fees."
Presentation choice: It includes costs many slides skip (promotions, processing, depot overhead) and keeps taxes out of revenue.
When it does not fit: A title about the future over a chart with no time label.
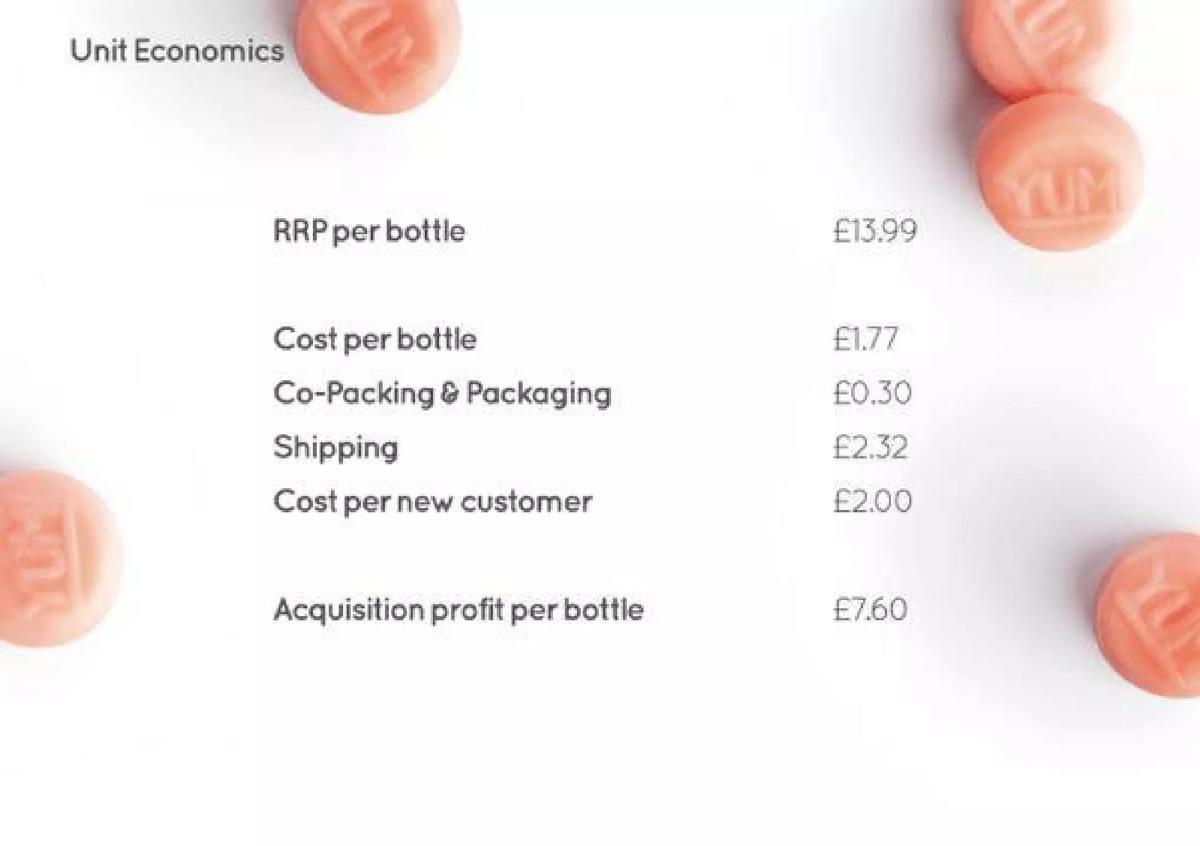
Yumi Nutrition deck, slide 13. Exact stored slide matched to this analysis.
Our analysis: First-order profit including acquisition.
Evidence and limitation: It adds up: £13.99 − £1.77 − £0.30 − £2.32 − £2.00 = £7.60. It includes acquisition cost, which most slides here leave out, but charges one customer's acquisition cost to one bottle, so it describes a first order. It uses the recommended retail price; the slide doesn't say whether that includes VAT or whether customers pay it after discounts. No payment processing line.
What a founder can adapt: "Price paid (ex VAT) £[X]"; add payment fees; state where the £2.00 acquisition cost comes from and over what period.
Supporting analysis
What the deck claims: "Unit Economics." "RRP per bottle £13.99. Cost per bottle £1.77. Co-Packing & Packaging £0.30. Shipping £2.32. Cost per new customer £2.00. Acquisition profit per bottle £7.60."
Presentation choice: It shows the first order is profitable after acquisition, if the £2.00 holds.
When it does not fit: Using list price when customers pay less, or when it includes tax.
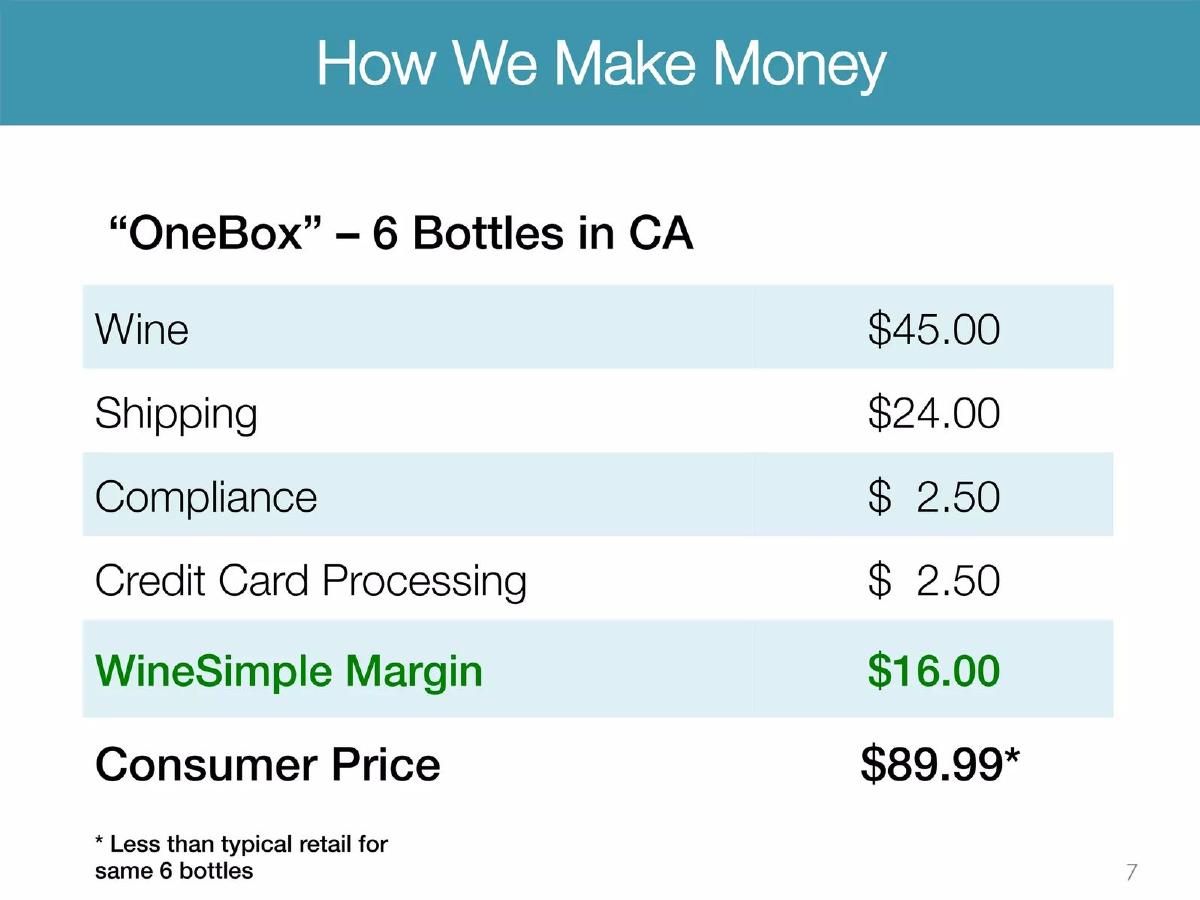
WineSimple deck, slide 7. Exact stored slide matched to this analysis.
Our analysis: A clear price build-up for one product in one market.
Evidence and limitation: The lines total $90.00, a cent more than the $89.99 price. The margin is about 18% of the price. Shipping is the largest cost after the wine, which is the kind of fact this slide should surface. It's one box in one state; no acquisition cost, packaging, or statement of whether it's actual.
What a founder can adapt: Add packaging and "before acquisition cost", and state whether other states differ.
Supporting analysis
What the deck claims: "How We Make Money." "'OneBox' – 6 Bottles in CA." "Wine $45.00; Shipping $24.00; Compliance $2.50; Credit Card Processing $2.50; WineSimple Margin $16.00; Consumer Price $89.99* (*Less than typical retail for same 6 bottles)."
Presentation choice: It shows shipping at more than a quarter of the price, which an investor needs to see.
When it does not fit: Rows that don't quite sum to the price.
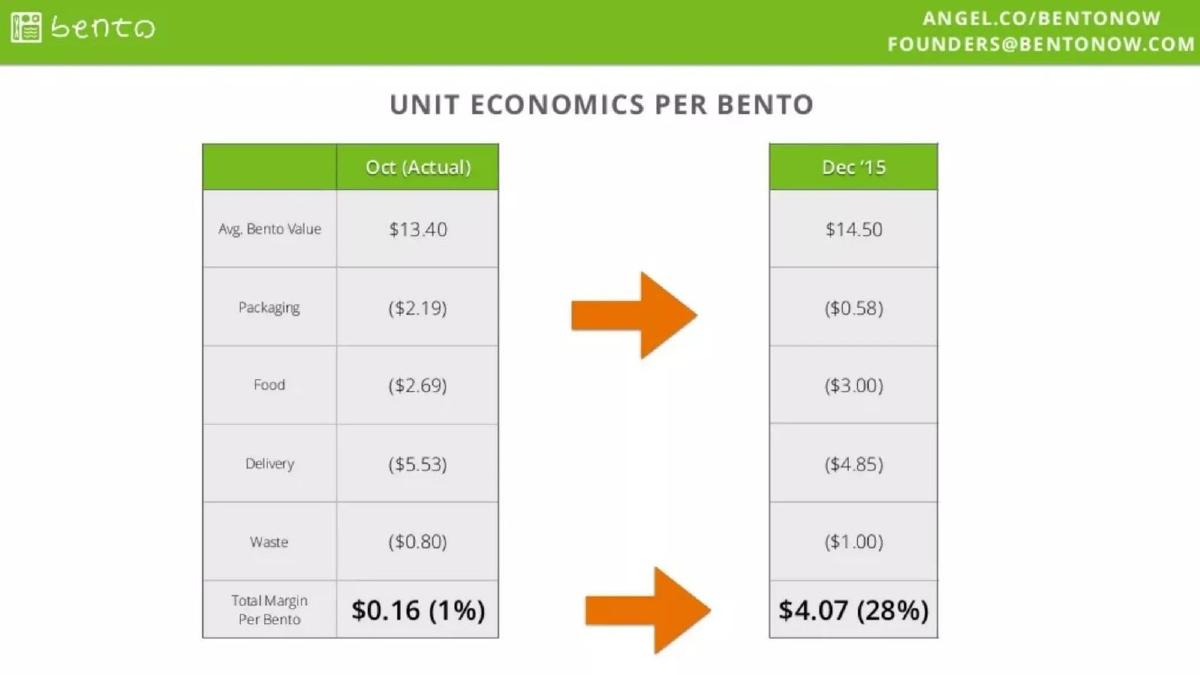
Bento deck, slide 9. Exact stored slide matched to this analysis.
Our analysis: Actual versus target, with a missing line.
Evidence and limitation: Actual and target are labelled, which is good. But the rows don't add up. October: $13.40 − $2.19 − $2.69 − $5.53 − $0.80 = $2.19, not $0.16. December: $14.50 − $0.58 − $3.00 − $4.85 − $1.00 = $5.07, not $4.07. The gaps ($2.03 and $1.00) suggest a cost line missing from the table. The plan relies mostly on packaging falling from $2.19 to $0.58.
What a founder can adapt: Add the missing line (for example "Other: ($2.03)") so each column sums, and say what cuts packaging cost.
Supporting analysis
What the deck claims: "Unit Economics per Bento." Oct (Actual): Avg. Bento Value $13.40; Packaging ($2.19); Food ($2.69); Delivery ($5.53); Waste ($0.80); Total Margin per Bento $0.16 (1%). Dec '15: $14.50; ($0.58); ($3.00); ($4.85); ($1.00); $4.07 (28%).
Presentation choice: The actual-vs-target layout is right; the arithmetic shows why every line must be on the slide.
When it does not fit: Totals that the rows above don't produce.
Coffee subscription tied to charitable causes. Included as a weaker example.
Just Cause Coffee deck, slide 18. Exact stored slide matched to this analysis.
Our analysis: Product margin presented as per-box profit.
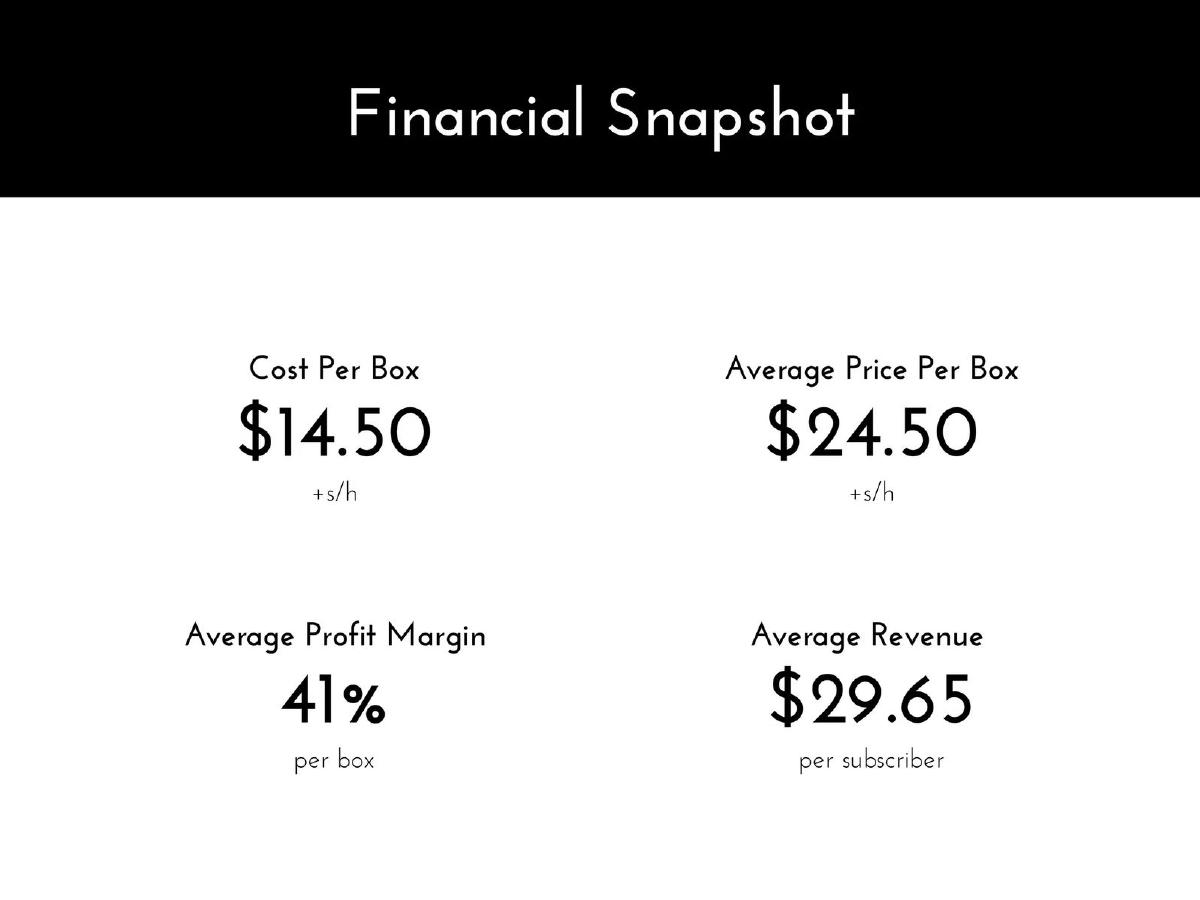
Evidence and limitation: ($24.50 − $14.50) ÷ $24.50 is about 41%, so the margin matches. But both figures exclude shipping and handling ("+s/h"), and the slide doesn't say whether customers pay shipping. $29.65 per subscriber has no period and differs from the $24.50 box price without explanation. No packaging, payment or acquisition lines.
What a founder can adapt: "Price $24.50 + shipping $[X] charged; costs: coffee $[A], packaging $[B], shipping $[C], payment $[D]; contribution $[E]".
Supporting analysis
What the deck claims: "Financial Snapshot." "Cost Per Box $14.50 +s/h"; "Average Price Per Box $24.50 +s/h"; "Average Profit Margin 41% per box"; "Average Revenue $29.65 per subscriber".
Presentation choice: Included to show how leaving out shipping can make a box look more profitable.
When it does not fit: "Profit margin" that excludes delivery.
Indian fashion e-commerce platform. Included as a weaker example because the figures are hidden.
Fynd deck, slide 6. Exact stored slide matched to this analysis.
Our analysis: A good template with the data removed.
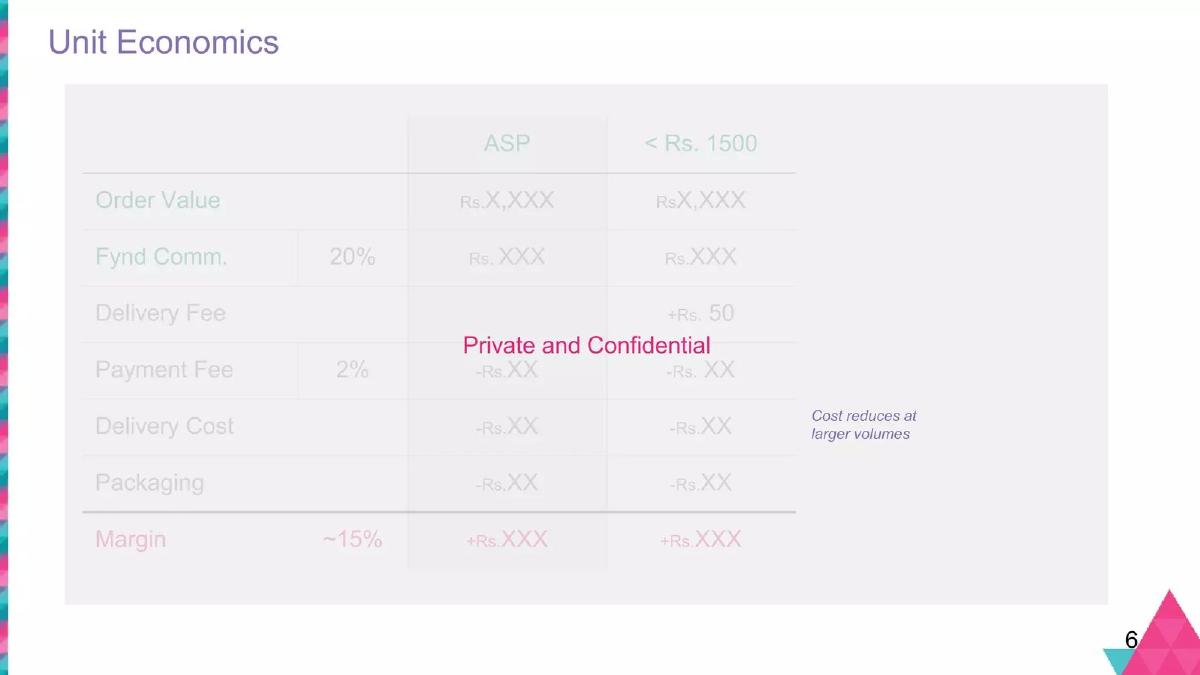
Evidence and limitation: The structure is right: commission, delivery fee charged, payment fee, delivery cost, packaging, and a margin, split by order size. With the amounts blanked, nothing can be checked except the 20% commission, 2% payment fee and ~15% margin.
What a founder can adapt: Fill in the figures for the version investors see, or show them in the data room.
Supporting analysis
What the deck claims: "Unit Economics." A table overlaid with "Private and Confidential": rows Order Value, Fynd Comm. (20%), Delivery Fee, Payment Fee (2%), Delivery Cost, Packaging, Margin (~15%); columns "ASP" and "< Rs. 1500"; a note "Cost reduces at larger volumes". The amounts are shown as placeholders ("Rs. X,XXX", "Rs. XX").
Presentation choice: Included for its structure: separate columns for small orders, where delivery cost bites hardest.
When it does not fit: Sending placeholders to investors.
What improved: Our illustrative rewrite of the Just Cause Coffee slide; bracketed figures are placeholders, not company facts. It brings shipping into the margin.
What this guide adds
The main unit economics guide covers LTV, CAC and payback: what a customer is worth over time. The gross margin guide covers the margin across the business. This guide covers a single order, where delivery and packaging often decide whether a physical-goods business makes money at all.
The lines investors look for
Order value (and whether it includes tax or delivery fees charged to the customer). Product cost. Packaging. Delivery or shipping. Payment processing. Waste, returns or promotions. Contribution per order. Then, separately, acquisition cost and overhead, and whether they're included.
Contribution per order before marketing is not profit. A slide that ends there should say so, and a slide that includes acquisition should say how it spreads that cost across orders.
How we read each slide
We quote the text on the slide images and re-added every column. We have not checked company figures. None of these pages was in our stored image set, so we rendered each from the original deck file in our library; the pages shown are the ones quoted.
Common mistakes
Rows that don't add up. Re-add every column before sending.
Shipping left out. For physical goods, delivery is often the largest cost after the product.
No time label. Say whether it's a period's actual or a target.
Acquisition unclear. State whether it's included, and how it's spread across orders.
Ambiguous percentages. Say whether a change is in points of order value or a share of the cost.
Placeholders in the investor version. Fill in figures or move them to the data room.
Diagnostic checklist
Every column adds up.
Delivery, packaging and payment included.
Dated; actual or target stated.
Acquisition and overhead stated as included or excluded.
Levers shown with arithmetic.
Frequently asked questions
What should a per-order unit economics slide include?
The order value, each cost per order (product, packaging, delivery, payment, waste), the contribution left, whether it's actual or a target, and whether acquisition and overhead are included. Chiper shows $50.10 per order, $5.30 gross profit, $4.30 fulfilment and $1.00 contribution for September 2021.
What's the most common mistake on these slides?
Rows that don't add up to the total shown. Bento's October column leaves $2.19 after the listed costs, but the slide shows $0.16, which suggests a cost line is missing from the table.
How we chose these examples
Corpus: published pitch deck teardowns on StartupFundraising.com. Founder-uploaded private decks are excluded.
Selection (2026-09-26): we searched teardowns for per-order, average order value, contribution margin, fulfilment and shipping costs, and for unit economics slides that mention per-order costs. We rendered 17 pages from 17 decks, plus five neighbouring pages of the Just Cause Coffee deck to locate its financial page (p18; the teardown's numbering differs).
Kept seven. Excluded: Polar Pants p4 (the same page already appears in the business model guide), Barn & Willow p4, T&J Designs p3, Boxed Up p11 and Unfabled p6 (order value only, no costs), Evine p9 (business-wide contribution, not per order), Overtime p14, Rokoko p4, Smalls p20 and Vo-D p10 (no per-order figures on the page). Superfüds and Lovearth deck files were not in the library.
None of the chosen pages was in our stored image set; we rendered them from the original deck PDFs in our library and stored them with the existing slide-image workflow. All seven decks were confirmed as published teardowns on 2026-09-26.
Review: slide images were checked on 2026-09-26 and matched to company, deck and page (editorial model review). No person has yet completed an editorial review of this page. We make no claim that any slide caused a fundraising outcome.