The edfa3ly pitch deck is a concise, metric-heavy presentation designed for a Demo Day format. It addresses the friction points of international shopping in the MENA region, including low credit card penetration (under 4%) and complex customs regulations. The company demonstrates significant traction, growing from $0.9 million in revenue in 2011 to $15.4 million in 2015, with projections reaching $71.3 million for 2017. By offering localized payment methods—such as cash collection and ATM payments—and a $1 per item shipping fee, edfa3ly positions itself as a critical infrastructure layer for…
Key takeaways
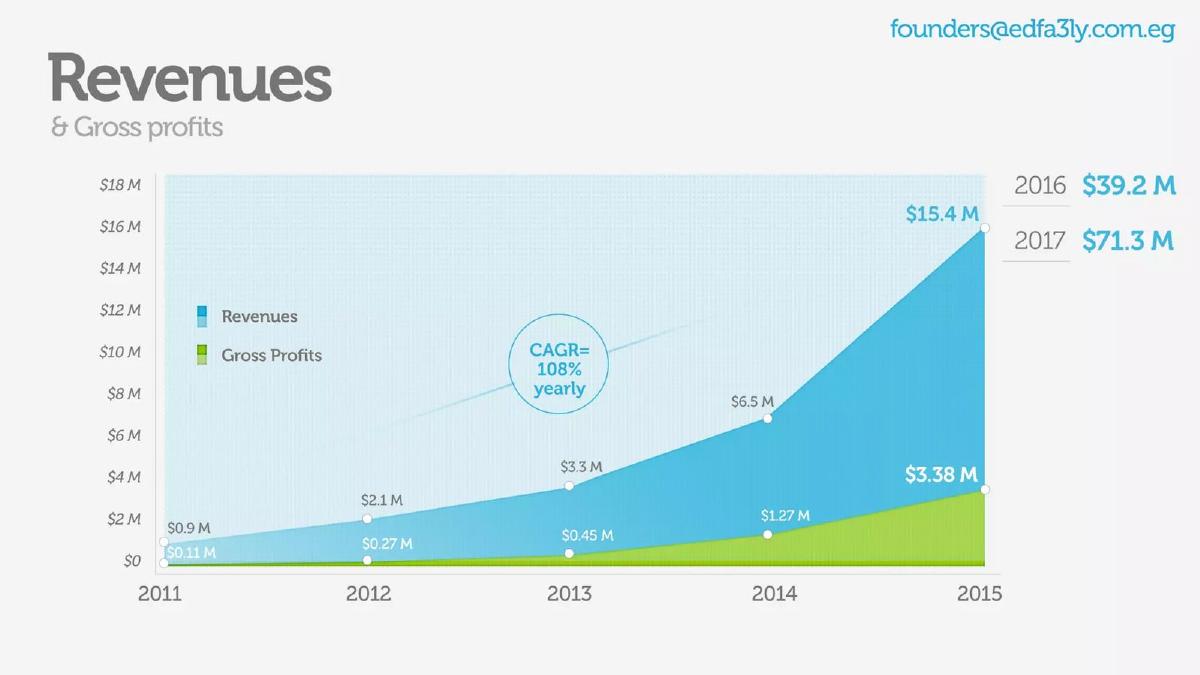
- Revenue grew at a 108% yearly CAGR between 2011 and 2015, reaching $15.4 million (Slide 2).
- The company projects a significant revenue jump to $71.3 million by 2017 (Slide 2).
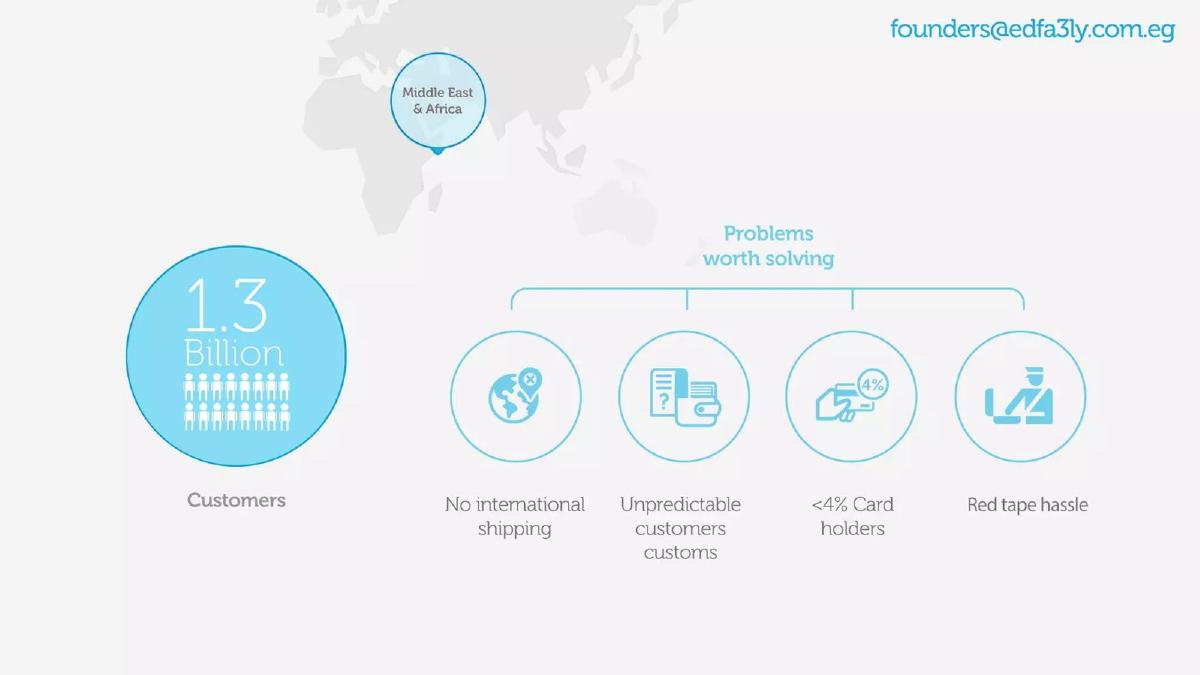
- The target market consists of 1.3 billion customers in the Middle East and Africa (Slide 4).
- Less than 4% of the target population are credit card holders, necessitating alternative payment methods (Slide 4).
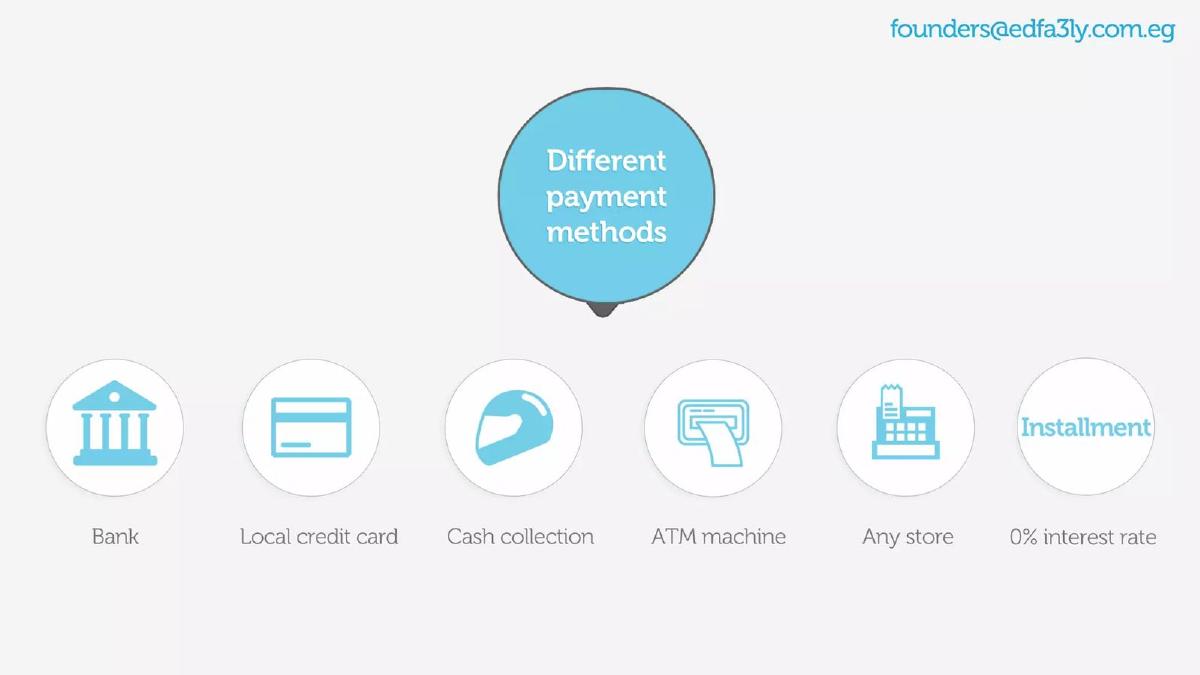
- Localized payment solutions include cash collection, ATM machines, and 0% interest installments (Slide 5).
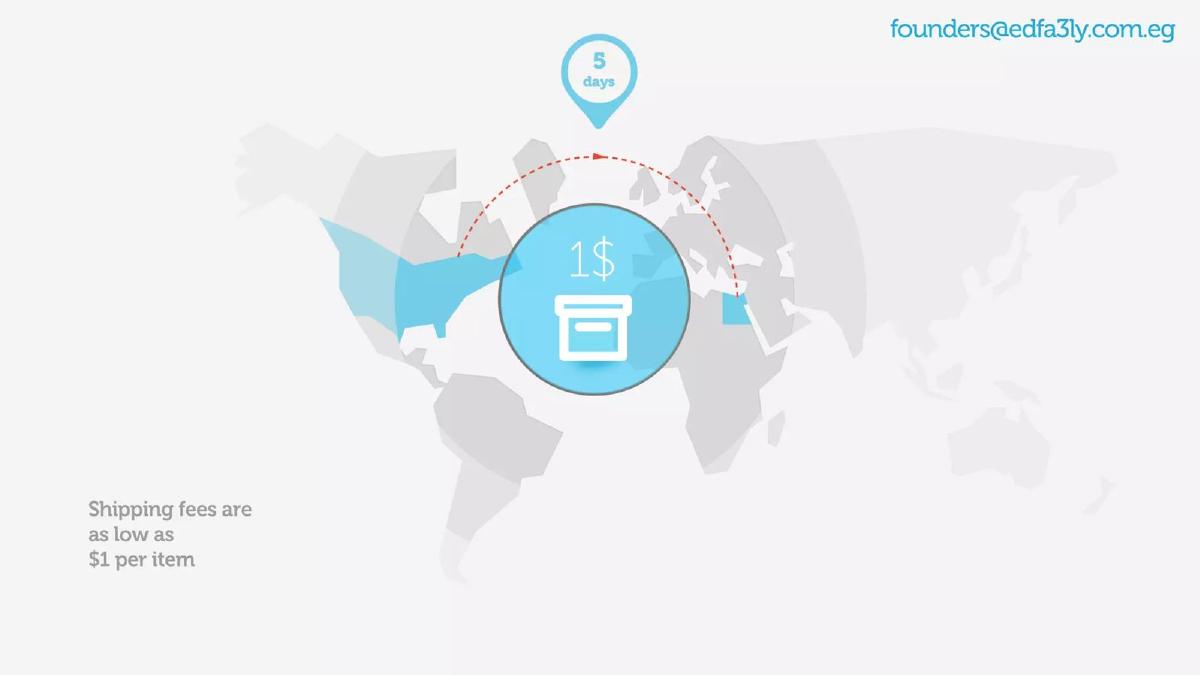
- Shipping fees are marketed as low as $1 per item with a 5-day delivery window (Slide 6).
- The company utilized a $150,000 seed fund to acquire 33,000 customers and deliver $15 million in products (Slide 7).
- Expansion plans target East Africa, North Africa, and the Gulf Cooperation Council (GCC) countries (Slide 8).
Slide-by-Slide Teardown
Slide 1: Title Slide
The title slide is minimalist, featuring the edfa3ly logo and the tagline: "Bridge for Middle Eastern & African consumers to shop the world." The inclusion of a founder email address in the top right corner is a standard practice for Demo Day decks to facilitate immediate follow-up. The branding is clean, using a blue and grey color palette that persists throughout the deck.
Slide 2: Revenues & Gross Profits
This is the most data-dense slide in the deck. It uses a stacked area chart to show revenue and gross profit growth from 2011 to 2015. The metrics are impressive: revenue grew from $0.9M in 2011 to $15.4M in 2015. Gross profits are also tracked, moving from $0.11M to $3.38M in the same period. The slide explicitly states a "CAGR = 108% yearly." To the right, the company provides projections for 2016 ($39.2M) and 2017 ($71.3M). This slide serves to establish immediate credibility through historical performance rather than just future promises.
Slide 3: The User Journey
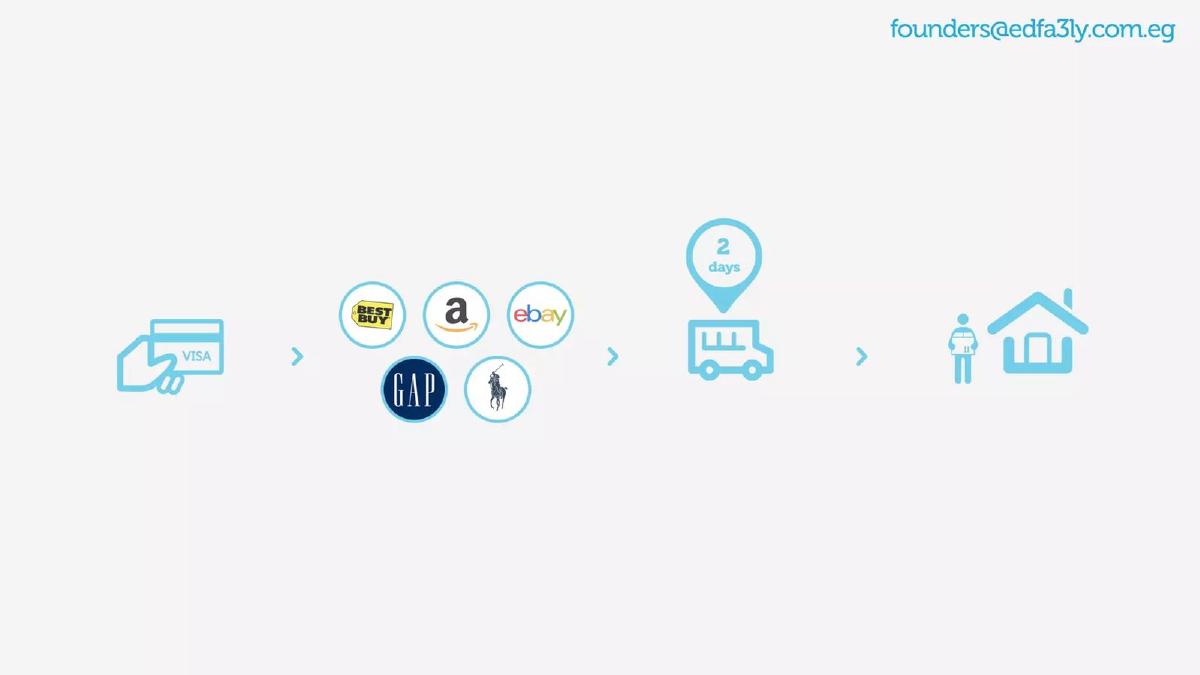
Using simple iconography, this slide illustrates the service flow. It shows a user paying (Visa icon), selecting products from major US retailers (logos for Best Buy, Amazon, eBay, Gap, and Ralph Lauren are shown), a 2-day domestic transit period, and finally, last-mile delivery to the consumer's home. This clarifies that edfa3ly acts as the intermediary that handles the international leg of the transaction that these retailers typically do not support for the MENA region.
Slide 4: Market Opportunity and Problem
The slide identifies a total addressable market of 1.3 billion customers in the Middle East and Africa. It breaks down the "Problems worth solving" into four categories: No international shipping, unpredictable customs, low credit card penetration (specifically citing that less than 4% of the population are cardholders), and red tape. This slide effectively justifies why a specialized service is needed despite the existence of global e-commerce giants.
Slide 5: Payment Solutions
This slide addresses the "4% cardholder" problem mentioned previously. It lists six localized payment methods: Bank, Local credit card, Cash collection, ATM machine, Any store, and Installment (0% interest rate). By showing these options, edfa3ly demonstrates a deep understanding of local infrastructure and consumer behavior, which is a significant barrier to entry for Western competitors.
Slide 6: Logistics and Pricing
The slide features a world map with a shipping route from the US to the Middle East. It highlights two key value propositions: a 5-day delivery window and shipping fees "as low as $1 per item." This addresses the cost and speed concerns that usually deter international shopping.
Slide 7: Efficiency and Traction
This slide uses three circles to show the efficiency of their initial capital. It states that with a $150,000 Seed fund, the company acquired 33,000 customers and delivered $15 million in products. This is a powerful "capital efficiency" argument, suggesting that the founders can achieve significant scale with relatively small amounts of investment.
Slide 8: Expansion Strategy
The slide shows the transition from a single-market focus (Egypt, indicated by the flag) to a regional one. The text states: "Now we are expanding in East Africa, North Africa and the Gulf Cooperation Council countries." It displays flags for countries including Kuwait, Kenya, Tunisia, Saudi Arabia, Uganda, Algeria, Morocco, and Tanzania. This signals the scalability of the business model across similar emerging markets.
Slide 9: Contact Slide
The final slide repeats the company logo and the founder's email address. It is a standard closing slide for a short presentation.
What Works Well
Historical Traction: Leading with a five-year track record of 108% CAGR (Slide 2) is a strong move. It proves the business model isn't just a theory but has survived and scaled over half a decade.
Problem-Solution Alignment: The deck does an excellent job of identifying specific regional hurdles (Slide 4) and immediately presenting the operational solutions for them (Slide 5 and 6). The mention of the 4% credit card penetration rate is a particularly compelling data point that highlights a massive gap in the market.
Capital Efficiency: Slide 7 is a masterclass in showing ROI. Claiming $15 million in delivered products from a $150,000 seed investment suggests a highly optimized operation and a strong product-market fit.
What is Missing
Team Slide: There is no mention of the founders' backgrounds, their previous experience in logistics, or the size of the current team. In early-stage investing, the "who" is often as important as the "what."
Competitive Landscape: The deck assumes there are no direct competitors or that the retailers themselves won't eventually solve these shipping issues. A slide addressing Aramex (Shop & Ship) or other regional logistics players would have added depth.
The Ask: The deck ends without stating how much money they are looking to raise or what the specific milestones for the next round of funding will be. While common in Demo Day decks where the "ask" is often delivered verbally, it leaves the document incomplete as a standalone pitch.
Unit Economics: While gross profit is shown, there is no breakdown of the take rate per transaction, the customer acquisition cost (CAC), or the lifetime value (LTV). Investors would want to know if the $1 per item shipping fee is a loss leader or a sustainable margin-maker.
Founder Takeaways
Quantify the friction: If you are operating in an emerging market, don't just say "payments are hard." Use a specific stat like edfa3ly's "<4% Card holders" to illustrate the depth of the problem. · Show, don't just tell, efficiency: The comparison between seed funding received and total volume of goods delivered is a very persuasive way to show that you know how to manage a balance sheet. · Use projections cautiously: While edfa3ly included 2017 projections, they were backed by four years of actual historical data. Never show a "hockey stick" projection without the historical "handle" to support the trajectory. · Keep it visual: For a Demo Day or a first-touch deck, use icons and maps to explain complex logistics. It allows the audience to grasp the business model in seconds rather than minutes.
Frequently asked questions
- What is the primary problem edfa3ly is solving?
- According to Slide 4, the company solves four major pain points for consumers in the Middle East and Africa: the lack of international shipping from global retailers, unpredictable customs costs, extremely low credit card penetration (under 4%), and the general 'red tape' associated with importing goods.
- How does edfa3ly handle payments for non-cardholders?
- Slide 5 outlines a variety of localized payment methods designed to bypass the low credit card usage in the region. These include bank transfers, cash collection via couriers, payments through ATM machines, in-store payments, and 0% interest installment plans.
- What is the company's historical growth rate?
- Slide 2 shows a consistent upward trajectory with a 108% yearly CAGR. Revenue started at $0.9 million in 2011 and scaled to $15.4 million by 2015. During that same period, gross profits grew from $0.11 million to $3.38 million.
- What are the shipping logistics and costs mentioned?
- Slide 6 highlights a shipping cost as low as $1 per item. The visual representation suggests a transit time of 5 days from international hubs (like the US) to the target markets in the Middle East and Africa.
- What information is missing from this pitch deck?
- This is a Demo Day deck, so it is intentionally brief. However, it lacks a team slide (no founders or key personnel are mentioned), a competitive landscape analysis, a clear 'Ask' regarding the current round's size or terms, and a breakdown of operational costs beyond gross profit.