Flyhomes successfully raised $310 million by positioning itself as a vertically integrated fintech solution for the real estate market. The deck focuses heavily on the 'buyer's dilemma'—the inability to compete with cash offers or time a simultaneous buy/sell. By showcasing a 4.5x faster closing time (1 month vs. 4.5 months) and a 4x higher win rate (2.2 offers to win vs. 8.5 industry average), the company demonstrated clear product-market fit. The deck is notable for its use of detailed customer personas and journey maps to explain complex financial products like 'Cash Offer' and 'Trade Up.'…
Key takeaways
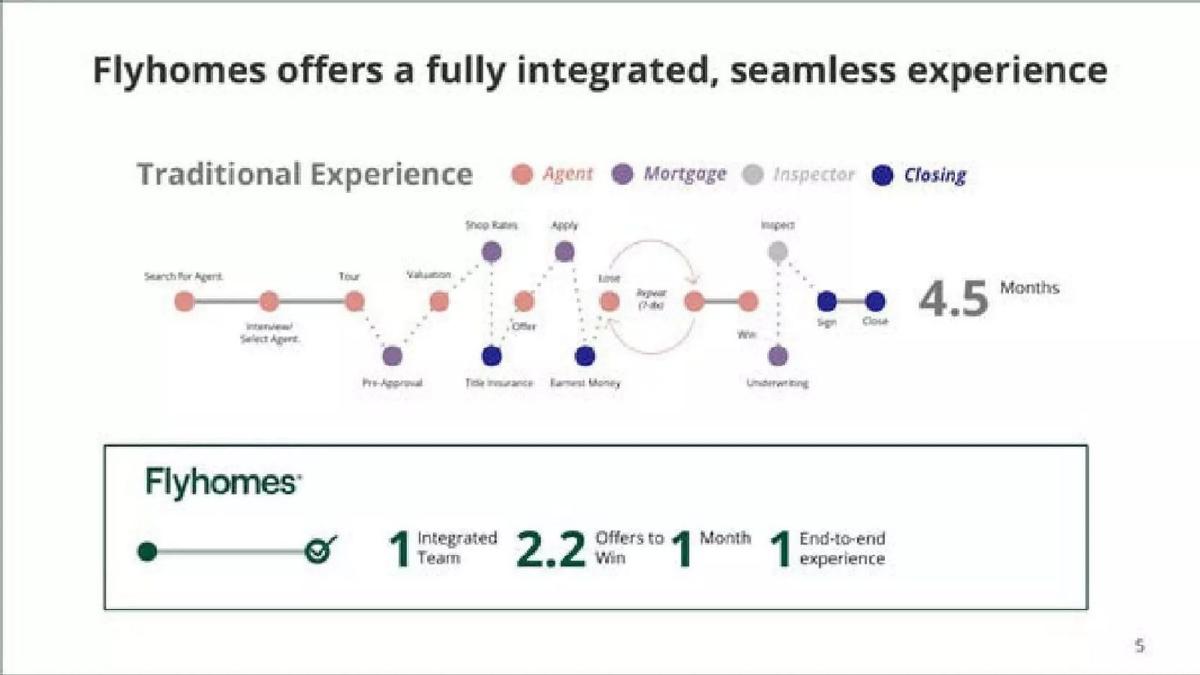
- Flyhomes claims to reduce the homebuying timeline from an industry average of 4.5 months to just 1 month (Slide 5).
- The company's 'Cash Offer' product results in a win rate of 2.2 offers per win, compared to the industry average of 8.5 (Slide 10).
- Flyhomes identifies a $1.7T US Gross Transaction Value (GTV) market with 99% of the market still available to be disrupted (Slide 16).
- The deck highlights a high Net Promoter Score (NPS) of 78, significantly outperforming traditional agents, mortgage, and title companies (Slide 11).
- A significant portion of growth is organic, with 50%+ of agents found via referral or repeat business (Slide 18).
- The company targets a $500M revenue opportunity within its initial four regions: Pacific Northwest, Northern California, Southern California, and the Northeast (Slide 17).
- The team slide features heavyweights from Amazon, McKinsey, Microsoft, and JP Morgan, alongside a board with partners from Andreessen Horowitz and Norwest (Slide 20).
- The deck identifies a 3.3 million home shortage in the US as a primary tailwind for their business model (Slide 13).
Executive Summary: The Vertical Integration Play
Flyhomes is not a traditional real estate brokerage. This 20-slide deck, used during their Series funding rounds, makes a forceful argument for the vertical integration of real estate services. By combining brokerage, mortgage, and title services under one roof, Flyhomes aims to solve the 'Buyer's Dilemma.' The deck is a masterclass in using data to highlight industry failure and then presenting a proprietary solution that is 'objectively irrational for buyers to work with anyone else' (Slide 10).
Slides 1-3: Setting the Vision
The deck opens with a standard title slide featuring Tushar Garg, Co-Founder & CEO. Slide 2 is a dense legal disclaimer, typical for a Series B or C stage company where forward-looking statements regarding financial innovation carry regulatory weight. Slide 3 establishes the mission: 'Flyhomes is building the world’s best homebuying experience.' It is a broad, consumer-centric vision that sets the stage for the specific problems identified in the following section.
Slides 4-6: The Problem and the Integrated Solution
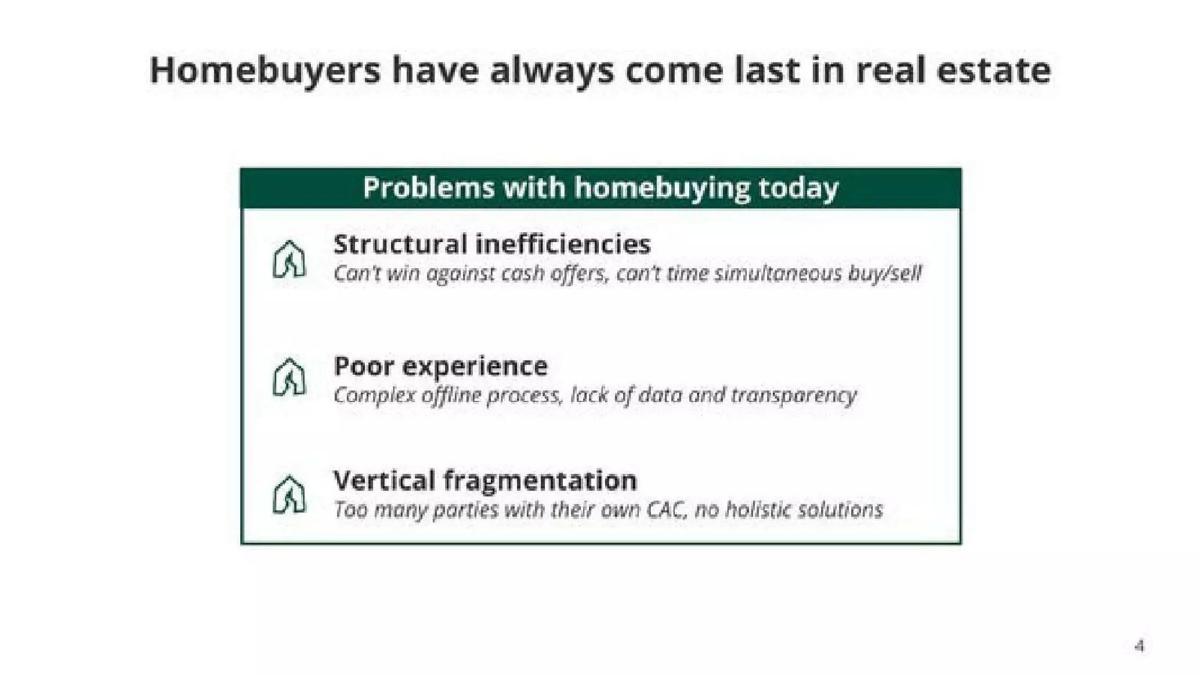
Slide 4 identifies three core problems: Structural inefficiencies (inability to win against cash), poor experience (complex offline processes), and vertical fragmentation (too many parties with their own Customer Acquisition Cost). This is a crucial slide because it justifies why a 'simple' app isn't enough; the problem is structural.
Slide 5 is the 'Aha!' moment of the deck. It contrasts the 'Traditional Experience'—a chaotic, multi-month process involving agents, mortgage brokers, inspectors, and closing agents—with the Flyhomes experience. They claim to reduce the timeline from 4.5 months to just 1 month. They also highlight a '2.2 Offers to Win' metric, implying that their buyers are significantly more efficient than the market average.
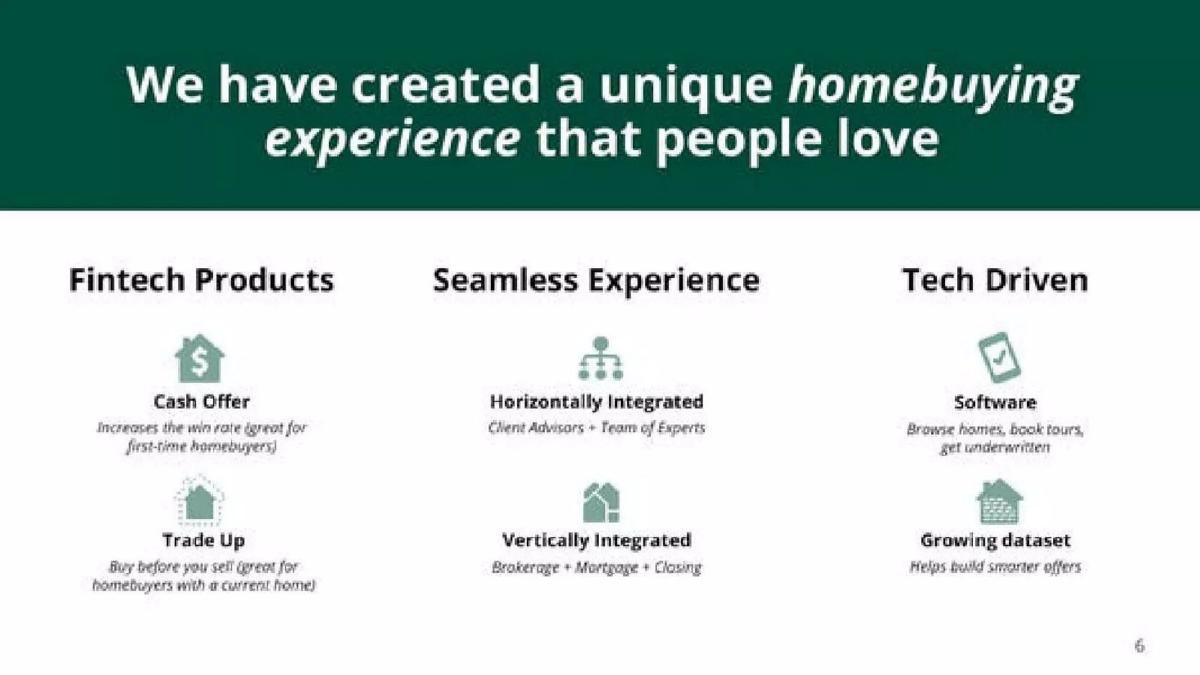
Slide 6 summarizes the value proposition into three pillars: Fintech Products (Cash Offer, Trade Up), Seamless Experience (Horizontal and Vertical integration), and Tech Driven (Software and a growing dataset). This slide bridges the gap between a service business and a scalable technology platform.
Slides 7-9: Customer Personas and Product Deep Dives
Instead of abstract feature lists, Flyhomes uses journey maps. Slide 7 follows a couple through the 'Cash Offer' process, moving from 'Anxious' to 'Win!' and finally 'Referrals.' It notes that 36% of customers have made a referral. Slide 8 does the same for the 'Trade Up' product, showing how they solve the 'Conundrum' of needing to sell a condo to buy a 'forever home.' They mention a 'Guaranteed Price' for the old home, which is a significant risk-mitigation feature for the consumer.
Slide 9 provides a rare look at the actual product interface. The screenshots show a map-based search, a communication feed with an agent (Anne Daniels), and a tour scheduling tool. It reinforces the 'tech-driven' claim made earlier in the deck.
Slides 10-11: Proof Points and Social Validation
Slide 10 is the strongest data slide in the deck. It uses bar charts to show Flyhomes is 4.5x faster than the industry, has a 4x higher win rate, and saves clients 'tens of thousands' per deal. Specifically, they claim their winning offers are 97.6% of the average highest competing offer, meaning their clients win even when they aren't the highest bidder, thanks to the certainty of a cash offer.
Slide 11 focuses on sentiment. A Net Promoter Score (NPS) of 78 is exceptionally high for the real estate industry, where traditional agents and mortgage companies often lag in the 20s or 30s. The fact that 10% of US employees were former clients is a powerful testament to the brand's impact on its users.
Slides 12-13: Market Dynamics and Macro Trends
Slide 12 addresses the 'Seller's Market' of 2021. It shows that average days on market were cut in half (from 43 to 21) while the number of offers per home rose by 51%. This data justifies why Flyhomes' fintech products are necessary; in a market this hot, traditional financing is a liability.
Slide 13 looks at long-term trends: a 3.3M home shortage, low interest rates, and the fact that Millennials (the largest segment) make up 40% of homebuyers. This slide tells investors that Flyhomes isn't just a pandemic-era fluke, but a solution to a decade-long supply-demand imbalance.
Slides 14-16: Competitive Landscape and Market Size
Slide 14 uses a standard 2x2 matrix to position Flyhomes. They place themselves in the top-right quadrant (Customer-centric and Buyer-focused). They categorize Zillow and Opendoor as 'Seller-focused iBuyers' and companies like Compass as 'Agent-centric.' This positioning is clever because it carves out a unique space that isn't directly competing for the same 'flip' inventory as iBuyers.
Slide 16 quantifies the 'Massive' market. With $1.7T in US GTV and 5 million homes sold annually, the scale is undeniable. The claim that '99% of the market is available to be disrupted' suggests that despite the presence of giants like Zillow, the actual transaction layer remains antiquated.
Slides 17-20: Growth Strategy and The Team
Slide 17 shows their current footprint: Pacific Northwest, California, and the Northeast. They estimate a $500M revenue opportunity in just these four regions with only a 5% market share. This demonstrates a clear path to scale without needing to be in every state immediately.
Slide 18 explains the 'Flywheel.' By delivering a superior client experience, they drive referrals and repeat business, which lowers their overall CAC and allows for continued investment in innovation. The pie chart shows that 40% of people find their agent through a referral from a friend or relative, which Flyhomes is successfully tapping into.
Slide 19 is a simple testimonial slide—an email from a first-time homebuyer to the CEO. While anecdotal, it humanizes the data presented in previous slides. Slide 20 introduces the team and board. The pedigree is high, with logos from Amazon, McKinsey, and JP Morgan. The board includes Alex Rampell (Andreessen Horowitz) and Lisa Wu (Norwest Venture Partners), signaling to new investors that the company has already passed the due diligence of top-tier firms.
What Works in This Deck
The 'Buyer-First' Narrative: Most real estate tech focuses on the seller (iBuying) or the agent (SaaS tools). Flyhomes identifies a massive, underserved segment—the frustrated buyer—and builds the entire deck around them. Quantifiable Superiority: The metrics on Slide 10 (4.5x faster, 4x win rate) are specific and hard to ignore. They move the conversation from 'we have a nice app' to 'we have a superior financial engine.' Visualizing the Journey: The use of journey maps (Slides 7 and 8) makes complex fintech products like 'Trade Up' easy to understand for an investor who might not be a real estate expert.
What is Missing
The Ask: There is no slide stating how much money they are looking for or what the specific milestones for the next 18-24 months are. Unit Economics: While they mention lower CAC on the flywheel slide, they don't provide the hard numbers for Contribution Margin or LTV/CAC ratios. For a company handling massive amounts of debt and capital for cash offers, these numbers are critical. Risk Factors: The deck is very optimistic. It doesn't deeply address the risks of holding residential real estate on the balance sheet during a market downturn, which is the primary concern for the iBuying/Fintech model.
What a Founder Should Copy
The Comparative Timeline: Slide 5 is a perfect example of how to visualize a 'Before vs. After' scenario. If your product simplifies a complex process, draw the messy old way and the clean new way side-by-side. NPS as a Weapon: If you are in a low-NPS industry (insurance, real estate, telco), use your high NPS as a primary differentiator. It proves that your growth is sustainable and not just driven by heavy ad spend. Market Positioning: The 2x2 matrix on Slide 14 is a classic for a reason. It allows you to define the terms of the competition so that you are the only one in the 'winning' quadrant.
Final Note: This deck is designed for a Series B or C round where the 'Product' is no longer just the software, but the entire business model and its ability to capture a slice of a $1.7T market.
Frequently asked questions
- What is the core problem Flyhomes aims to solve?
- Flyhomes identifies 'structural inefficiencies' as the primary pain point, specifically that buyers cannot win against cash offers and struggle to time simultaneous buy/sell transactions. Slide 4 notes that homebuyers have always 'come last' in real estate due to vertical fragmentation and a lack of data transparency.
- How does Flyhomes differentiate itself from iBuyers like Zillow or Opendoor?
- According to Slide 14, Flyhomes positions itself in the 'Customer-centric' and 'Buyer-focused' quadrant. While iBuyers are labeled as 'Seller-focused,' Flyhomes focuses on empowering the buyer with financial tools like cash offers to compete in hot markets, rather than just providing liquidity to sellers.
- What financial products does Flyhomes offer to consumers?
- The deck highlights two main fintech products on Slide 6: 'Cash Offer,' which increases win rates for first-time buyers, and 'Trade Up,' which allows current homeowners to buy a new home before selling their old one. These are supported by an integrated brokerage, mortgage, and closing stack.
- What are the key performance metrics cited in the deck?
- Key metrics include a 4.5x faster closing speed, a 4x higher win rate, and an average savings of 2.4% below the highest competing offer (Slide 10). They also boast a 78 NPS and note that 10% of their US employees were clients before joining the company (Slide 11).
- What information is missing from this pitch deck?
- The deck lacks a specific 'Ask' slide detailing how much capital is being raised in this specific round and how it will be allocated. It also omits detailed unit economics (CAC/LTV ratios) and a clear multi-year financial projection, focusing instead on market opportunity and past performance.