Nextdoor’s 2021 SPAC presentation is a comprehensive look at a social network that has achieved significant scale, reporting 60 million verified users by Q1 2021 (Slide 32). The deck focuses heavily on the 'hyperlocal' advantage, arguing that proximity creates a unique trust barrier that global social networks cannot replicate. With a leadership team featuring veterans from Square, Salesforce, and Google (Slide 28), the company presents a clear path to monetization through a full-funnel advertising approach. While the company reported a net loss of $75.2M in 2020 (Slide 42), the deck emphasiz…
Key takeaways
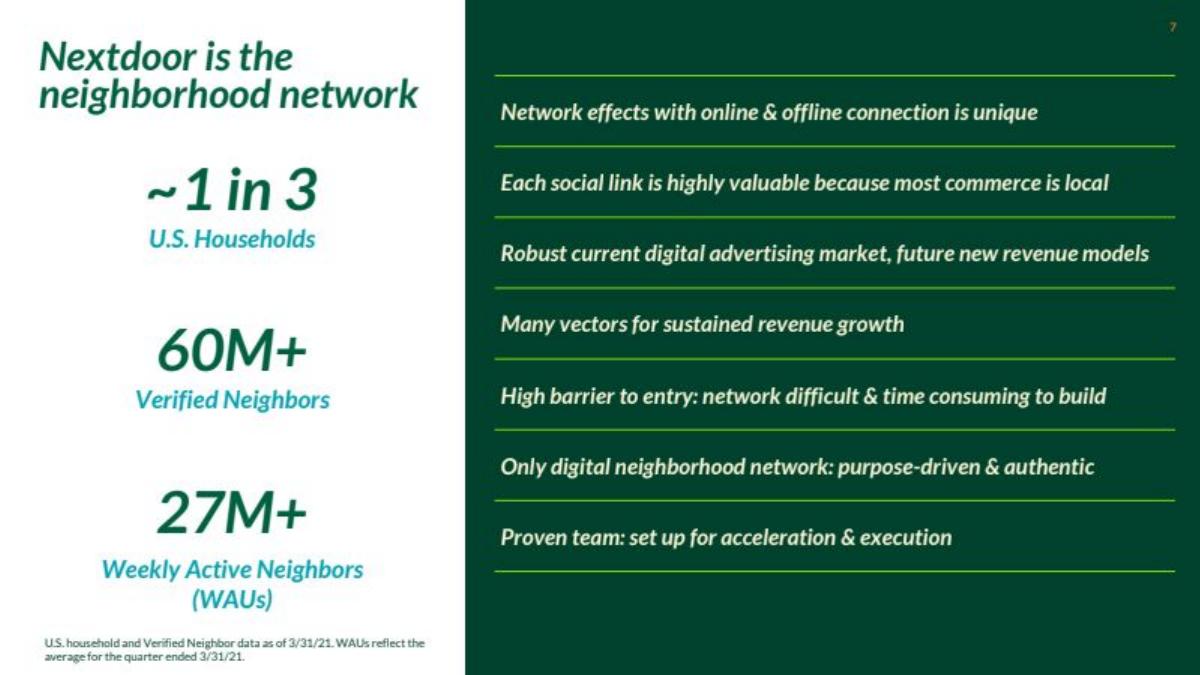
- Nextdoor reached 60 million ending verified users by Q1 2021, with 51 million of those in the U.S. (Slide 32).
- Weekly Active Users (WAU) grew from 13.3 million in 2018 to 27.6 million by Q1 2021 (Slide 32).
- The company demonstrates a 2.3x increase in weekly engagement as neighborhood penetration increases, proving strong local network effects (Slide 16).
- Nextdoor identifies a massive $607B global digital advertising TAM by 2024, focusing on adjacent markets like home services and real estate (Slide 24).
- The platform has a unique audience profile, with 82% of its monthly visitors not visiting Snap and 64% not visiting LinkedIn (Slide 18).
- Monetization is accelerating, with U.S. ARPU growing 31% year-over-year to $5.71 in Q1 2021 (Slide 34).
- The leadership team was significantly 'turbocharged' in the 24 months leading up to the deck, adding executives from Square, Hyatt, and LinkedIn (Slide 28).
- Financials show an improving Adjusted EBITDA, moving from a $58.8M loss in 2019 to a $50.2M loss in 2020 despite increased scale (Slide 42).
The Hyperlocal Social Contract: A Deep Dive into Nextdoor's SPAC Deck
Nextdoor’s 2021 investor presentation is a high-stakes document designed to transition a well-known consumer app into a public-market-ready advertising powerhouse. With a total of 43 slides (22 of which are analyzed here), the deck moves quickly from community sentiment to hard-nosed unit economics. It is a textbook example of how to pitch a 'network effect' business by showing that the value of the network increases not just with total users, but with local density.
The Vision and Social Context
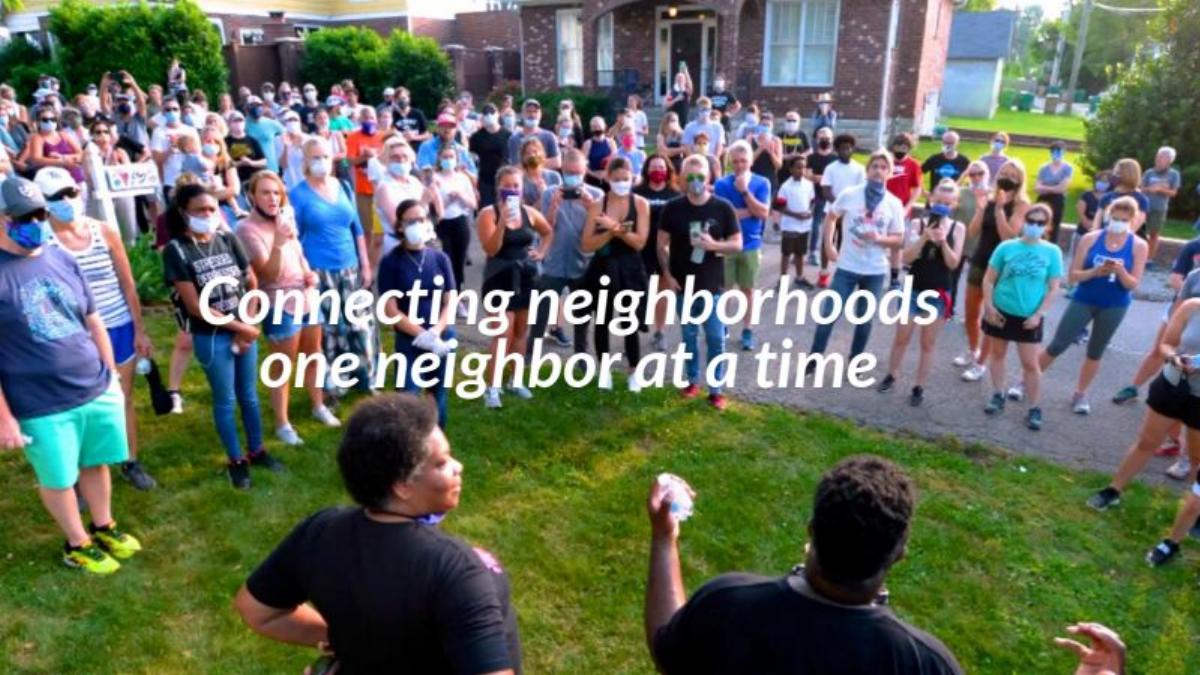
Slide 1 through Slide 8 set the emotional and social stage. The deck opens with vibrant imagery of community murals and neighborhood gatherings. Slide 3 contains the standard legal disclaimer common in SPAC (Special Purpose Acquisition Company) presentations, noting that the figures include non-GAAP financial measures. Slide 5 introduces the core mission: "Connecting neighborhoods one neighbor at a time."
Slide 8 provides the 'Why Now' for the investment. It cites that 73% of people say neighbors are one of the most important communities in their lives and that knowing at least six neighbors can reduce loneliness. By citing sources like Open Mind Strategy and Nextdoor's own Global Loneliness Study, the company frames itself not just as a utility, but as a solution to a societal problem. This is a strategic move to build 'ESG' (Environmental, Social, and Governance) appeal for institutional investors.
Product Utility and User Personas
Slide 10 and Slide 12 focus on how the product actually works. Slide 10 breaks the app down into five pillars: Local Perspectives, Groups, Recommendations, Connections, and Businesses. This slide is crucial because it shows the versatility of the platform—it is a news feed, a marketplace, and a directory all in one.
Slide 12 uses a 'day in the life' case study of Dawn, a small business owner in Grant Park, GA. It tracks her usage from Monday (updating her business page) to Saturday (promoting a new job listing). This humanizes the B2B side of the platform, showing that Nextdoor isn't just for bored neighbors; it's a vital tool for local commerce and employment.
The Engine: Growth Loops and Network Effects
Slide 14 and Slide 16 represent the 'meat' of the business case. Slide 14 introduces the 'Strong competitive moat' through a flywheel involving Neighbors, Businesses, and Public Agencies. The inclusion of Public Agencies (police, fire departments, local government) is a unique differentiator for Nextdoor. These agencies provide 'Verified people & info,' which acts as a trust anchor that platforms like Facebook often struggle to maintain.
Slide 16 is perhaps the most important slide for a growth investor. It shows a bar chart of '% Neighborhood penetration' vs '% of Neighbors Active Weekly.' The trend is clear and upward: as a neighborhood moves from <5% penetration to 90%+, the weekly activity rate climbs from roughly 24% to over 50%. The slide explicitly states: "2.3x increase in weekly engagement as more neighbors join." This proves that the product becomes more valuable the more people in a specific area use it.
Market Positioning and Audience Exclusivity
Slide 18 and Slide 20 address the competitive landscape. Slide 18 makes a bold claim about audience exclusivity. It states that 82% of Nextdoor monthly visitors do not visit Snap, and 27% do not visit Facebook & Messenger. By showing that Nextdoor reaches an audience that other platforms miss, they justify their place in a brand's advertising budget. The slide also points to a ">$1T Aggregate market cap of these other platforms," suggesting that Nextdoor is playing in the same league as the giants.
Slide 20 compares U.S. DAU (Daily Active Users) and ARPU (Average Revenue Per User). Nextdoor shows itself at 12M DAU with a $10 ARPU, compared to Snap (90M DAU, $18 ARPU) and Twitter (36M DAU, $59 ARPU). The visual implication is that Nextdoor has massive 'white space' to grow both its user base and its revenue per user to match its peers.
Future Expansion and TAM
Slide 22 and Slide 24 look forward. Slide 22 introduces a product shift from following only where "I live" to following neighborhoods where "My mum lives," "I own a business," or "I volunteer." This is a significant strategic pivot that expands the user's 'local' footprint, potentially increasing time spent on the app.
Slide 24 defines the Total Addressable Market (TAM). It projects the global digital advertising market to grow from $355B in 2020 to $607B by 2024. It also lists 'Large Adjacent Markets' including Home Services, Local Commerce, Classifieds, Real Estate, and Local Events. By listing these, Nextdoor signals that it isn't just competing for social media ad dollars, but also for the budgets of companies like Yelp, Zillow, and Craigslist.
The Business Model and Leadership
Slide 26 and Slide 28 detail the 'how' and 'who.' Slide 26 shows the 'Full funnel approach,' mapping product features to the marketing funnel: Awareness (Sponsored Posts), Intent (Sponsorships), and Action (Local Deals). This slide tells an advertiser exactly how to spend their money.
Slide 28 showcases the leadership team. The deck highlights that this team was "turbocharged" in the last 24 months. With Sarah Friar (CEO, formerly of Square and Salesforce) and Mike Doyle (CFO, formerly of Expedia), the company presents a roster of executives who have successfully scaled multi-billion dollar public companies. This is a critical slide for a SPAC deal, where investors are often 'betting on the jockey' as much as the horse.
Financial Performance and Valuation
Slide 32 through Slide 42 provide the hard numbers. Slide 32 shows that Ending Verified Users grew from 33M in 2018 to 60M in Q1 2021. Interestingly, while the U.S. accounts for the vast majority of users (51M of the 60M), the international segment is growing. Slide 34 breaks down the ARPU growth, showing that 'Local' revenue and 'Engagement' are the primary drivers of the 31% year-over-year ARPU increase.
Slide 40 addresses valuation directly. It compares Nextdoor's 40% revenue growth to peers, noting that it outpaces Twitter (23%) and Match (19%). It also shows that at a $3.5B Enterprise Value, Nextdoor's 2022E EV/Revenue multiple of 14.2x is lower than Snap (20.0x) and Pinterest (15.7x), framing the stock as a relative bargain.
Finally, Slide 42 provides the Adjusted EBITDA reconciliation. It shows that while the Net Loss increased slightly from $73.3M in 2019 to $75.2M in 2020, the Adjusted EBITDA actually improved from a $58.8M loss to a $50.2M loss. This suggests that the company is beginning to find operational efficiencies as it scales.
What Nextdoor Does Well
Network Effect Proof: Slide 16 is the strongest slide in the deck. It doesn't just claim network effects; it uses data to prove that engagement increases as local density increases. · Audience Differentiation: Slide 18 successfully argues that Nextdoor is not 'just another social network' by showing how little its audience overlaps with Snap and LinkedIn. · Leadership Credibility: The 'turbocharged' leadership slide (Slide 28) is exceptionally strong, featuring recognizable logos (Google, Square, Salesforce) that build immediate trust with institutional investors. · Clear Monetization Path: Slide 26 (the funnel) and Slide 34 (ARPU drivers) take the mystery out of how the company makes money, transitioning it from a 'community app' to an 'ad tech' platform.
What is Missing from the Nextdoor Deck
Churn and Retention Data: While the deck shows 'Verified Users' and 'WAU,' it does not explicitly show cohort retention or churn rates. For a social network, knowing how many users leave after the first 30 days is critical. · Content Moderation Strategy: Nextdoor has faced public scrutiny regarding racial profiling and misinformation. The deck mentions 'Trust' as a moat (Slide 14) but does not detail the costs or technologies used to moderate the platform, which is a significant operational risk. · International Monetization: Slide 32 shows that international users are a small but growing part of the base, but Slide 34 only focuses on U.S. ARPU. There is no clear plan for how they will monetize the 9M international users.
Founder Takeaways: What to Copy
The 'Day in the Life' Slide: Use a specific persona (like Dawn on Slide 12) to show exactly how your product fits into a customer's routine. It is much more effective than a list of features. · Density Metrics: If you are a marketplace or a local service, don't just show total growth. Show how your economics or engagement improve as you get 'denser' in a specific market (Slide 16). · The Funnel Map: If you are building an ad-supported business, show exactly where your products sit in the advertiser's funnel (Slide 26). It makes your revenue model feel tangible. · Peer Comparison: When discussing valuation, group your competitors into logical buckets (e.g., 'Advertising Comps' vs 'Community Comps' on Slide 40). This helps investors understand which 'multiples' they should apply to your business.
Frequently asked questions
- What is Nextdoor's primary value proposition to advertisers?
- Nextdoor positions itself as a 'full funnel' platform that moves neighbors from awareness to action. According to Slide 26, they use first-party data to create efficient targeting through sponsored posts, local deals, and dynamic local ads. Because the context is hyperlocal, the company argues that the content is inherently more relevant to the user than global social feeds.
- How does Nextdoor define its network effects?
- Nextdoor defines its network effects through neighborhood penetration. Slide 16 shows a direct correlation: as the percentage of a neighborhood that joins Nextdoor increases, the percentage of neighbors active weekly also rises. Specifically, they claim a 2.3x increase in weekly engagement as more neighbors join, suggesting the platform becomes more 'sticky' as it nears total local saturation.
- Who are Nextdoor's main competitors according to the deck?
- Slide 40 compares Nextdoor to two main groups: 'Advertising Comps' (Snap, Pinterest, Twitter) and 'Community Comps' (Bumble, Roblox, Match). The deck argues that Nextdoor's revenue growth of 40% is superior to Twitter, Bumble, and Match, while trading at a lower EV/Revenue multiple than Snap or Pinterest.
- What is the 'hyperlocal growth loop' mentioned in the deck?
- The growth loop, illustrated on Slide 14 and Slide 36, involves three pillars: Neighbors, Public Agencies, and Businesses. Neighbors provide local perspectives and recommendations, which attract local businesses seeking customers. Public agencies provide verified information, which increases trust. This ecosystem creates 'instant distribution' and 'hyperlocal at scale,' which Nextdoor claims is a strong competitive moat.
- What are the biggest risks Nextdoor disclosed in this presentation?
- Slide 38 outlines several risks, including a history of net losses, the potential for inaccurate market opportunity estimates, and legal liabilities regarding content published on the platform. They also highlight the 'dual class' stock structure, which concentrates voting power with management and existing stockholders, potentially limiting new investors' influence.