NewHomesMate (pitching as Propertymate) successfully raised $5.5M in Seed funding in 2024 by targeting the underserved new construction niche of the residential real estate market. The deck identifies a $400 billion industry that has remained stagnant for 40 years, proposing a marketplace that qualifies buyers and collects commissions from builders. The company demonstrated significant traction throughout 2022, showing a steady increase in Marketing Qualified Leads (MQLs) reaching 29,635 by November and a Gross Merchandise Value (GMV) peak of over $7.1 million. By positioning themselves as a…
Key takeaways
- The deck identifies a massive $400 billion market opportunity in new construction residential sales as of 2021 (Slide 7).
- The business model functions as a digital brokerage, qualifying buyers and collecting commissions from builders post-closing (Slide 5).
- Revenue is currently derived from a 1-4% commission on home prices, averaging $9,818 per transaction (Slide 6).
- The company demonstrated strong lead generation growth, with MQLs rising from 7,887 in January 2022 to 29,635 in November 2022 (Slide 11).
- GMV showed volatility but an upward trend, ending November 2022 at $7,116,898 (Slide 11).
- The long-term strategy involves capturing up to 10% of transaction value by integrating mortgage, title, and insurance services (Slide 9).
- At the time of the pitch, the company reported an Annualized Run Rate of $2,348,800 (Slide 13).
- Expansion plans were aggressive, targeting dozens of new markets across the US for 2023 (Slide 17).
Market Opportunity and Problem Definition
Slide 1: Title Slide
The deck opens with the company's former branding, Propertymate. The subtitle is direct: "A marketplace for new construction homes." The background imagery of a suburban housing development immediately anchors the viewer in the specific niche of real estate they are targeting—new builds rather than the broader resale market.
Slide 2: Team and Leadership
This slide introduces three chief executives. The content focuses on their career history, establishing founder-market fit. While the specific text is summarized as a detailed explanation of their careers, the presence of this slide early in the deck suggests the founders wanted to lead with their credibility in the real estate or technology sectors before diving into the metrics.
Slide 3: The $400 Billion Problem
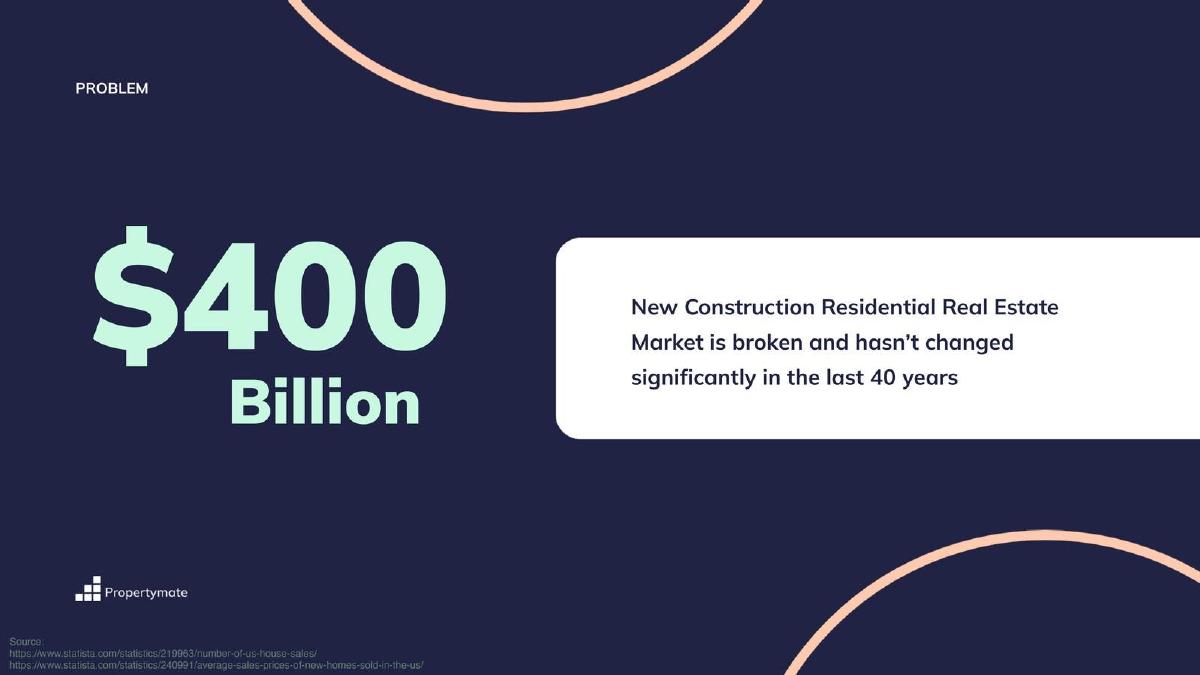
NewHomesMate defines the problem through the lens of stagnation. They cite a $400 Billion market size for new construction residential real estate and claim the industry "hasn't changed significantly in the last 40 years." This is a classic disruption hook, suggesting that while the rest of the world has moved to digital marketplaces, new home construction remains stuck in legacy processes.
The Solution and Product Experience
Slide 4: Product Introduction
The deck introduces the marketplace through visuals of their browser and iPhone platforms. By showing the UI/UX, they demonstrate that the product is not just a concept but a functional tool for homebuilders and buyers to connect. The focus is on the "marketplace" aspect, positioning themselves as the Zillow of new construction.
Slide 5: How It Works
This slide outlines a three-step process: 1) Qualify buyers, 2) Help them find a home (scheduling tours and waitlists), and 3) Take commission. This is a critical slide because it clarifies that NewHomesMate is not just a lead-gen site; they act as a digital broker, participating in the transaction flow to ensure they get paid by the builders after closing.
Slide 6: Current Revenue Model
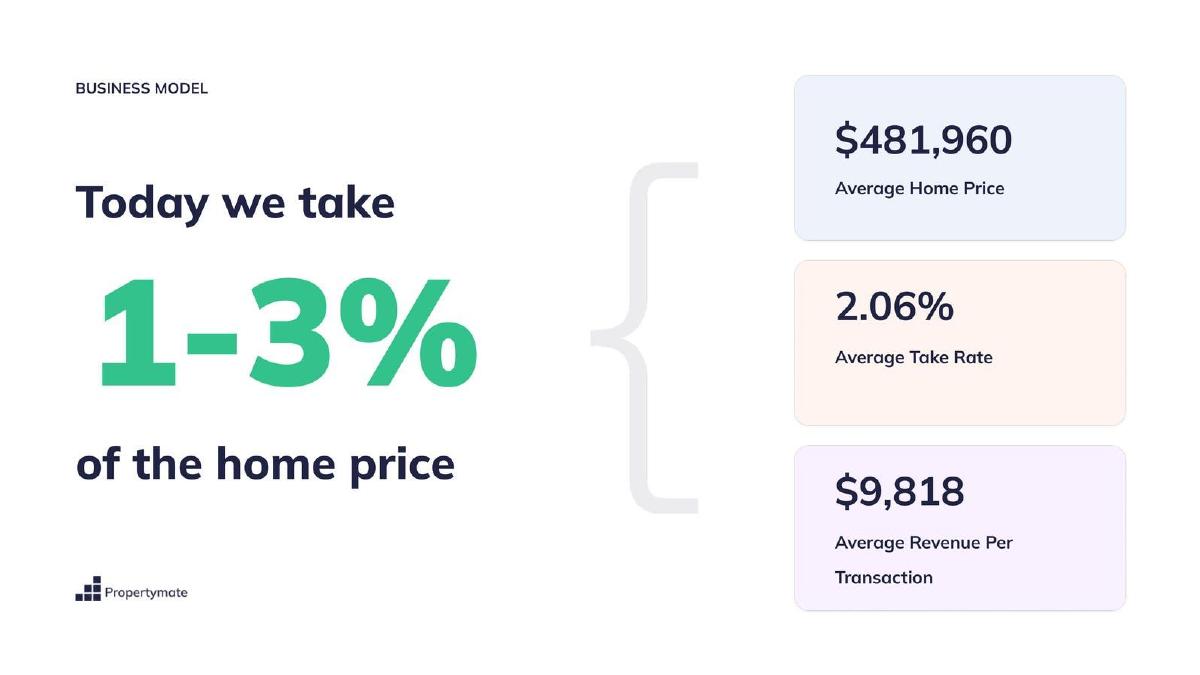
The company provides hard figures for their current state. They take 1-4% of the home price. They state an average revenue of $9,818 per transaction . Providing a specific dollar amount for average revenue helps investors calculate the volume needed to reach significant scale and validates that builders are currently willing to pay these fees.
Market Size and Future Monetization
Slide 7: Massive Opportunity
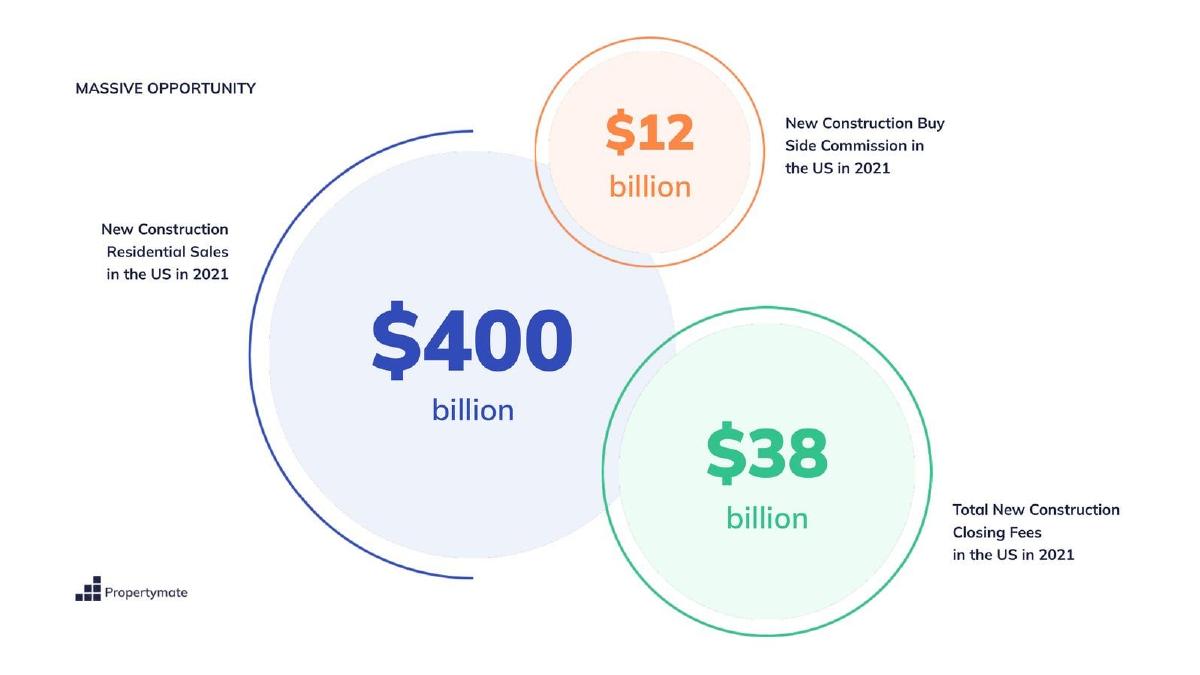
This slide breaks down the Total Addressable Market (TAM). They cite the $400 billion in new construction residential sales in the US in 2021 as the primary market. They then segment this into a $12 billion buy-side commission pool and a $38 billion closing fee pool. This sets the stage for their expansion from a simple marketplace into a full-stack transaction platform.
Slide 8: Short-term Monetization
Currently, the company makes up to 3% by focusing on the top of the funnel: home search and scheduling tours. This slide reinforces the current reality of the business before the deck pivots to the vision of the future.
Slide 9: Long-term Monetization Strategy
The vision slide shows a timeline from "Decides to buy a new home" to "Finally moves in." The steps include mortgage, contract, title, closing, and insurance. The bold claim at the bottom: "We will take up to 10% doing this." This indicates a strategy to capture the entire fintech and legal stack associated with a home purchase, significantly increasing the LTV of each customer.
Traction and Metrics
Slide 10: Geographic Footprint
At the time of the deck, the company was operating in 6 markets across 2 states . This establishes that the model has been tested in multiple locations and is not just a single-city pilot, providing a baseline for the growth charts that follow.
Slide 11: Growth in Leads and GMV
This is the primary traction slide. It shows two lines over the course of 2022. Marketing Qualified Leads (MQLs) grew steadily from 7,887 in January to 29,635 in November . Gross Merchandise Value (GMV) was more volatile, starting at $1,251,100 , peaking at $7,116,898 in November, with a significant dip in July ($4.6M). The tripling of leads is a strong indicator of demand and marketing efficiency.
Slide 12: Revenue and Take Rate
This slide focuses on the increasing revenue rate and the "take rate" of customers using the product. While specific percentages are part of the broader narrative, the goal of this slide is to show that as they scale, they are getting better at converting users into revenue-generating transactions.
Slide 13: Core Metrics (Redacted)
The company presents a snapshot of metrics as of December 15, 2022. The Annualized Run Rate is listed as $2,348,800 . Other metrics, including CAC, LTV, Sales Cycle Length, Burn Multiple, and CAGR, are present but were redacted in the public version of the deck. For a Seed round, an ARR of over $2M is exceptionally high, likely explaining the successful $5.5M raise.
Slide 14: Operational Efficiency
This slide argues that the company is becoming more efficient as it scales. By showing that costs do not rise linearly with revenue or market launches, they make the case for a venture-scale business model rather than a traditional real estate brokerage.
Future Targets and Expansion
Slide 15: Metric Goals
The company sets targets for 2024, including EOY targets for CAC and LTV. Although the specific numbers are redacted, the slide shows that management is focused on specific KPIs like "Time to Break-even" for new markets and "Time to Launch a Market," which are critical for a geographically expanding marketplace.
Slide 16 & 17: The Expansion Map
Slide 16 lists launch locations, and Slide 17 provides a visual map of the US. The map for 2023 is incredibly ambitious, showing pins in almost every major metro area from Seattle to Miami. This visualizes the "land grab" strategy typical of Seed-stage marketplaces looking to dominate a niche before competitors can react.
Slide 18: The Ask
The company explicitly states they are raising $5 million . The funds are earmarked for expansion. The slide also mentions current funders, providing social proof to new investors that the company has already passed the due diligence of other professional backers.
Slide 19: Contact Information
The deck concludes with a simple contact slide for Co-Founder and CEO Dan Hnatkovskyy. It serves as a professional close to a data-heavy presentation.
What NewHomesMate Does Well
The NewHomesMate deck excels at niche identification. By carving out "New Construction" from the broader real estate market, they avoid a direct comparison to Zillow's primary business while still using a familiar "marketplace" language. The traction slide (Slide 11) is particularly effective because it shows two different types of growth: top-of-funnel interest (MQLs) and bottom-line potential (GMV). The inclusion of a specific average revenue per transaction ($9,818) removes the ambiguity often found in early-stage decks regarding how the company actually makes money.
What is Missing from the Deck
The most glaring omission is a detailed competitive landscape. The deck assumes that because the industry is "broken," there are no other players trying to fix it. In reality, there are several startups and established builder-direct portals that compete for these same commissions. Furthermore, the deck does not address the cyclical nature of the housing market or how high interest rates might affect the "New Construction" sector specifically. Finally, while the 10% take-rate vision is compelling, the deck lacks a roadmap for how they will acquire the necessary licenses and infrastructure to handle title and insurance in-house across multiple states.
Founder Takeaways
Lead with a specific dollar amount: If you have transactional revenue, state the average dollar value per transaction clearly, as seen on Slide 6. It makes the business model feel tangible. · Show the full stack vision: Investors love to see how a 2-3% margin can become a 10% margin. Slide 9 provides a clear visual roadmap for increasing LTV without needing to find new customers. · Use MQLs to show demand: Even if your revenue is lumpy (like real estate commissions), showing a steady upward trend in qualified leads (Slide 11) proves that your marketing engine is working. · Map your expansion: A geographic map (Slide 17) is a powerful way to communicate the scale of your ambition and the repeatability of your model.
Frequently asked questions
- What is the primary problem NewHomesMate is solving?
- The company targets the $400 billion new construction residential real estate market, which they claim has not changed significantly in 40 years. They address the fragmentation and lack of transparency for buyers looking specifically for new builds, providing a centralized marketplace that qualifies buyers and facilitates tours.
- How does NewHomesMate generate revenue?
- They operate on a commission-based model. Currently, they earn between 1% and 4% of the home price, paid by builders after closing. Their data shows an average revenue of $9,818 per transaction. Their future goal is to increase this to 10% by handling the entire closing process, including mortgage and insurance.
- What kind of traction did the company show in their Seed deck?
- The deck shows 2022 data where Marketing Qualified Leads (MQLs) tripled over 11 months, growing from 7,887 to 29,635. Gross Merchandise Value (GMV) also grew significantly, reaching over $7.1 million in November 2022, supporting an annualized run rate of approximately $2.35 million.
- What are the company's expansion plans?
- NewHomesMate planned a massive geographic rollout. While they started with 6 markets in 2 states, their 'Phase 3' map for 2023 included dozens of major US metros across nearly every region, including the Pacific Northwest, Texas, the Southeast, and the Northeast.
- What is missing from the NewHomesMate pitch deck?
- The deck is notably missing a detailed competitive analysis slide. While it mentions the industry is 'broken,' it doesn't explicitly compare its features to incumbents like Zillow or specialized new-build platforms. Additionally, several key unit economics like CAC and LTV were redacted in the public version of the deck.