Should a marketplace size its market by the money flowing through it or by the fees it can keep?
Marketplace Market Size Slide: Transaction Value vs the Fees You Keep
A marketplace's customers spend money through it, but the marketplace keeps only a fee. So a marketplace market slide has two possible numbers: the value of all transactions, and the pool of fees (commissions, take rate) a platform could earn from them. Investors want to know which one a slide shows, and how the company gets from the first to the second. This guide compares seven real slides on that question.
TL;DR
Show both numbers and label them: the transaction value, then the fee pool, with the fee rate that links them. Home61 and NewHomeMate do this: $2 trillion in sales against $60 billion in commissions (3%), and $400 billion in sales against $12 billion in buy-side commission (also 3%). Immo gives the transaction value and a 6–7% commission rate but doesn't multiply them. Sideline Swap, Winnie and Avventura give spending only. Podvertise labels 1% of ad spending as its revenue, which only holds if it keeps the whole ad spend rather than a fee on it.
Marketplace market slides from real pitch decks
Each example shows the slide above its analysis and links to the full teardown. Slides that separate transaction value from fees come first. Claims are as shown on the slides; calculations and comments are ours.
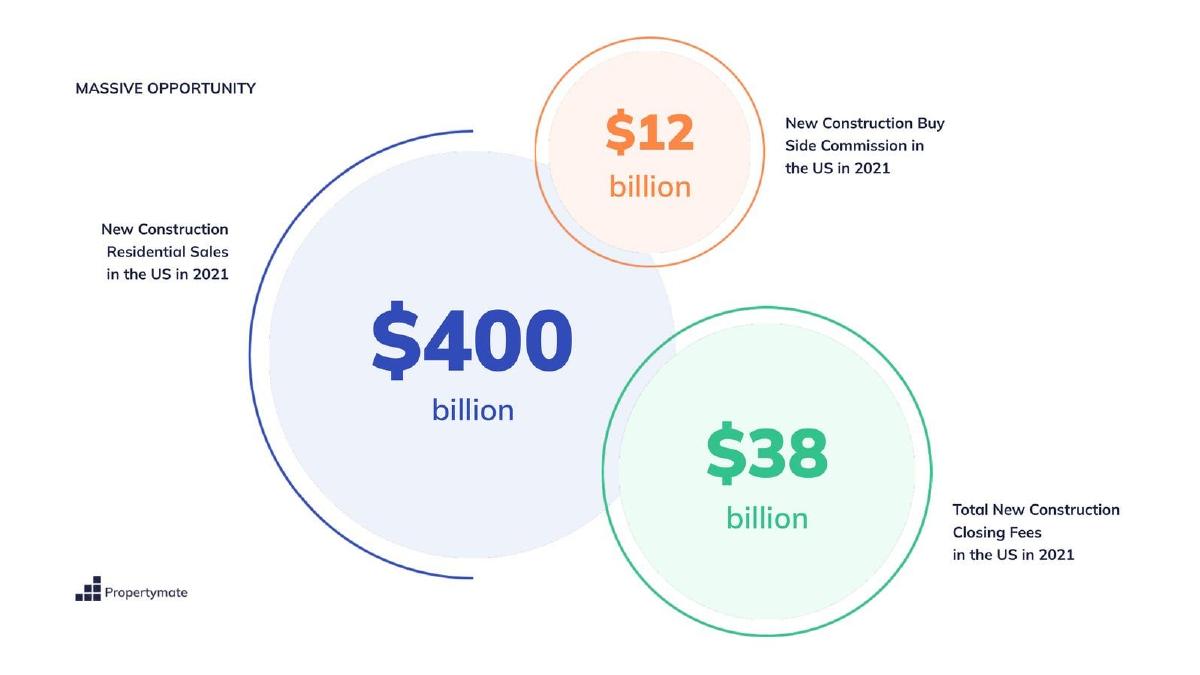
NewHomeMate market slide — slide 7
Platform for buyers of newly built homes in the US. The slide carries a Propertymate logo.
NewHomeMate deck, slide 7. Exact stored slide matched to this analysis.
Our analysis: Narrows from sales to the specific fee a buyer-side platform could capture.
Evidence and limitation: Transaction value and two fee pools, all for one year and one country. $12 billion is 3% of $400 billion; $38 billion is 9.5%. The slide doesn't say whether the $12 billion is included in the $38 billion, which fees it expects to earn, or give a source.
What a founder can adapt: Add the link to revenue: "We charge [X]% of the $12B buy-side pool" and a source for each figure.
Supporting analysis
What the deck claims: "Massive opportunity." "$400 billion: New Construction Residential Sales in the US in 2021." "$12 billion: New Construction Buy Side Commission in the US in 2021." "$38 billion: Total New Construction Closing Fees in the US in 2021."
Presentation choice: It names the fee pool that matches its position (the buyer side) with a year.
When it does not fit: Overlapping fee circles without saying whether they add up.
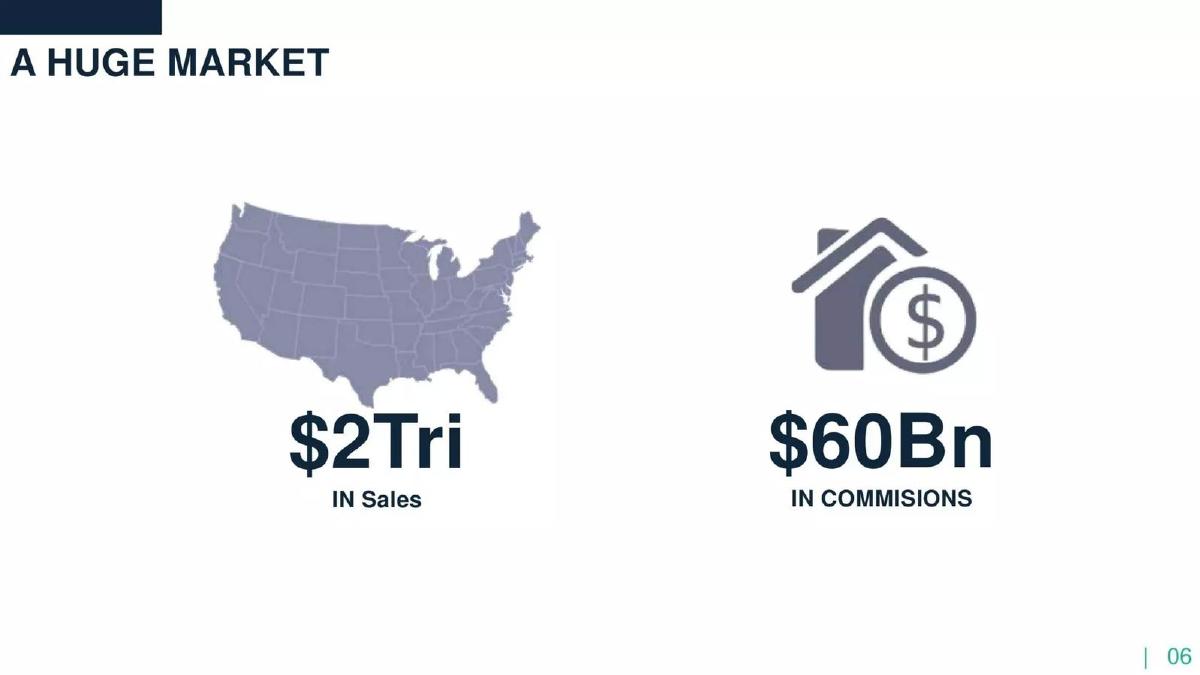
Real estate brokerage platform. The page is labelled 06 in its footer.
Home61 deck, slide 6. Exact stored slide matched to this analysis.
Our analysis: The simplest version of the right structure: what flows, and what's paid in fees.
Evidence and limitation: Two numbers side by side: transaction value and the commission pool. $60 billion is 3% of $2 trillion. No year, source, or statement of what share of commissions Home61 would take.
What a founder can adapt: "US home sales $2T and commissions $60B ([year], [source]); our fee: [X]%".
Supporting analysis
What the deck claims: "A huge market." "$2Tri in sales" (over a map of the US); "$60Bn in commisions".
Presentation choice: It puts the fee pool next to the sales figure instead of leading with the bigger number alone.
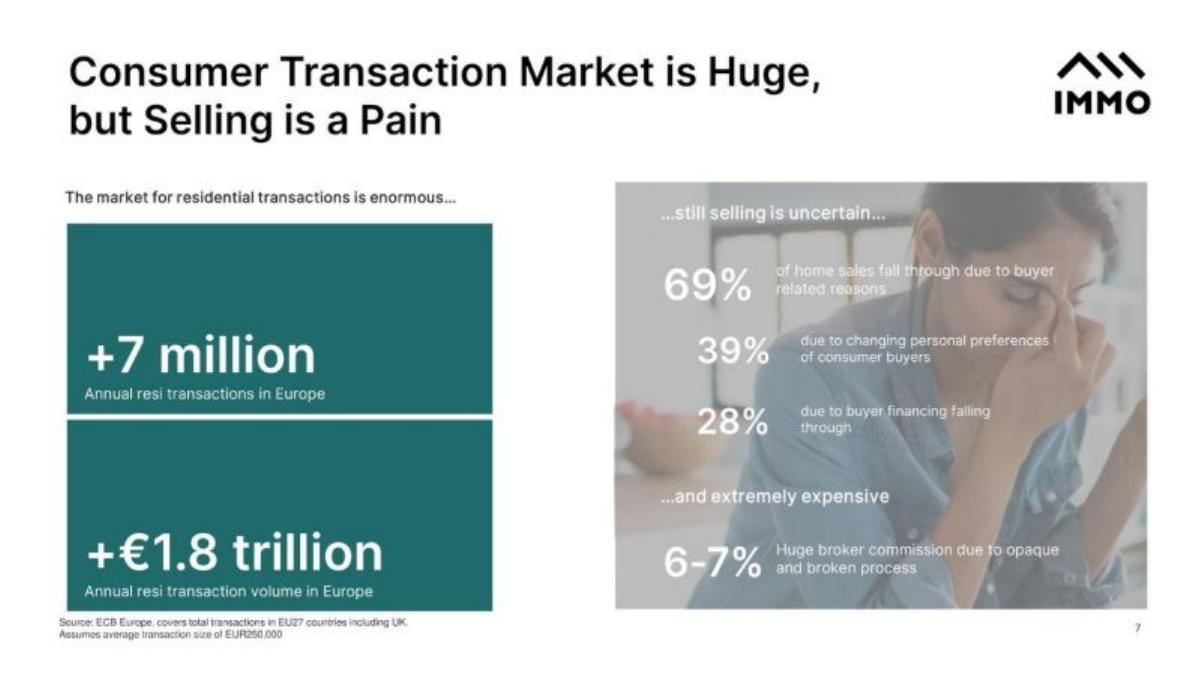
Immo deck, slide 7. Exact stored slide matched to this analysis.
Our analysis: Transaction value with a stated basis, and a fee rate left unconverted.
Evidence and limitation: Sourced, with the assumption stated: 7 million × €250,000 = €1.75 trillion, which rounds to the €1.8 trillion shown. It gives the commission rate but doesn't multiply it out: 6–7% of €1.8 trillion would be about €108–126 billion. That product is our arithmetic; the slide presents the rate as a pain point, and we don't know whether commissions are charged on every transaction counted.
What a founder can adapt: Add the fee pool it implies, with its basis: "[share of transactions using brokers] × 6–7% ≈ €[X]B".
Supporting analysis
What the deck claims: "Consumer Transaction Market is Huge, but Selling is a Pain." "+7 million: Annual resi transactions in Europe." "+€1.8 trillion: Annual resi transaction volume in Europe." "…and extremely expensive: 6–7% Huge broker commission due to opaque and broken process." Footnote: "Source: ECB Europe, covers total transactions in EU27 countries including UK. Assumes average transaction size of EUR250,000."
Presentation choice: It shows its source and assumption, so the headline can be checked.
When it does not fit: Giving the fee rate without the pool it creates.
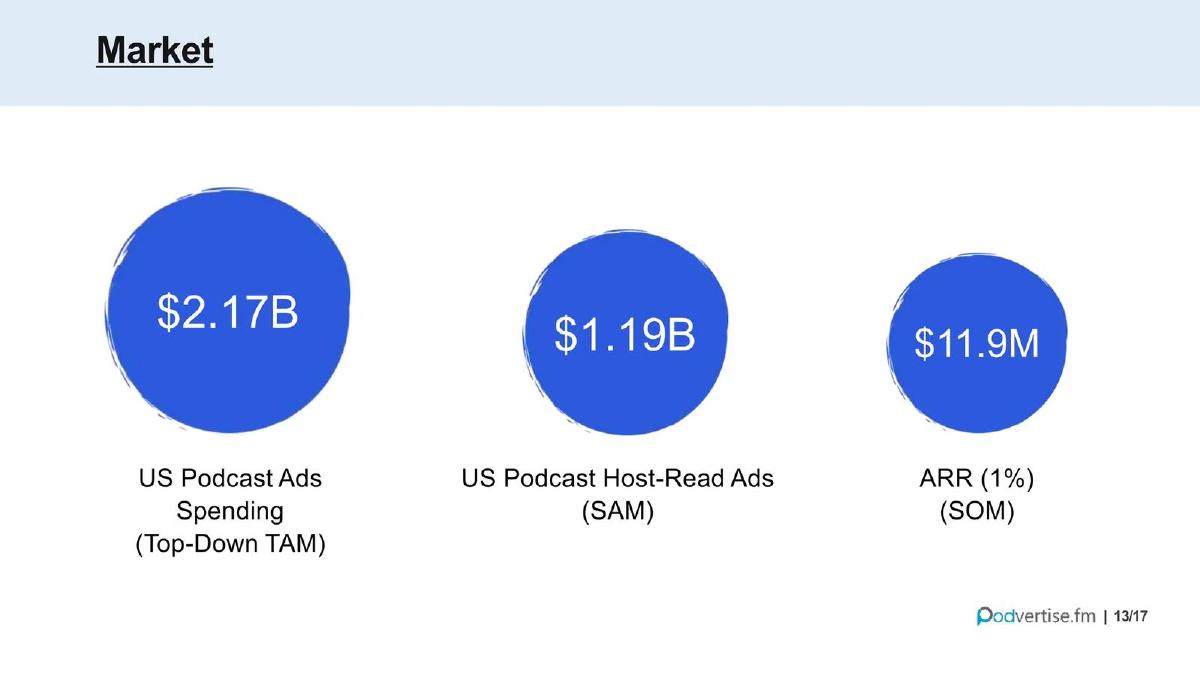
Marketplace connecting podcast hosts with advertisers. Another page of this deck appears in the media solution guide.
Podvertise deck, slide 13. Exact stored slide matched to this analysis.
Our analysis: Transaction value relabelled as revenue at the last step.
Evidence and limitation: The narrowing is clear, and 1% of $1.19 billion is $11.9 million. But the $11.9 million is labelled ARR, the company's own revenue, while it's 1% of ad spending. That holds only if the whole ad spend on those deals is Podvertise's revenue. If it takes a fee from each deal, its revenue would be that fee times $11.9 million of spending. No year or source.
What a founder can adapt: "SOM: 1% of host-read spend = $11.9M of bookings; at a [X]% fee, $[Y] revenue".
Supporting analysis
What the deck claims: "Market." "$2.17B: US Podcast Ads Spending (Top-Down TAM)." "$1.19B: US Podcast Host-Read Ads (SAM)." "$11.9M: ARR (1%) (SOM)."
Presentation choice: It shows how easily a marketplace's share of spending gets written as its revenue.
When it does not fit: Calling a share of transaction value ARR.
Marketplace for used sports equipment. Another page of this deck appears in the marketplace traction guide.
Sideline Swap deck, slide 4. Exact stored slide matched to this analysis.
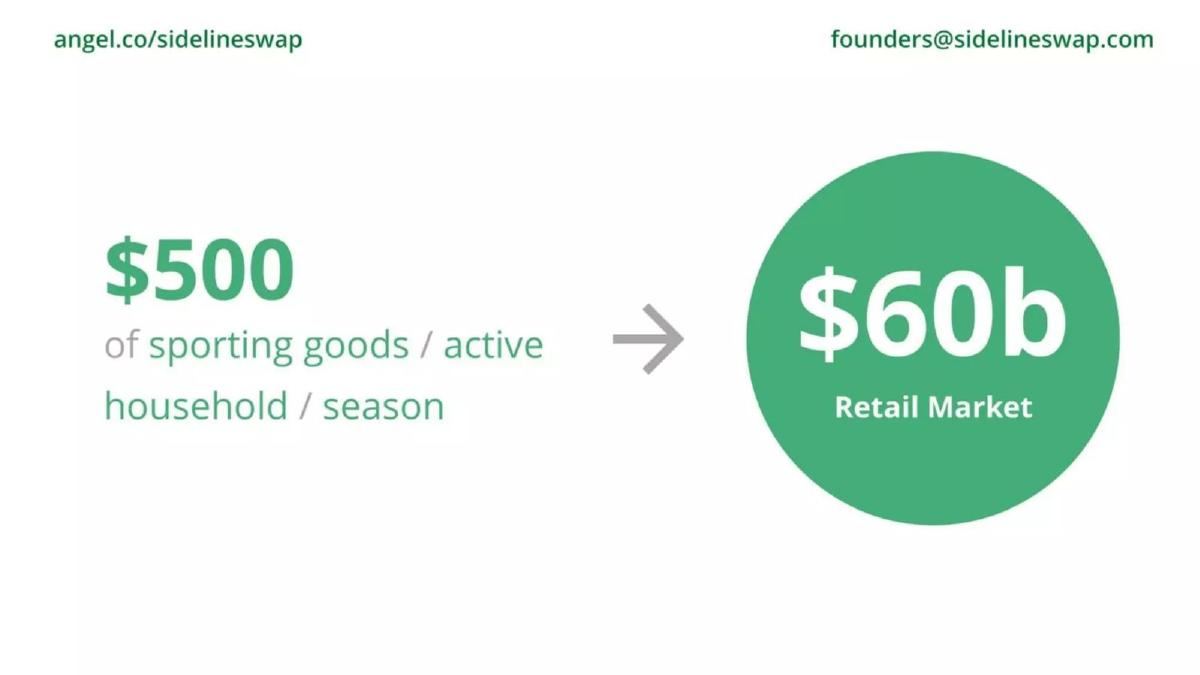
Our analysis: Spending on new goods, used as the market for a resale platform.
Evidence and limitation: A bottom-up start, but the household count is missing: $60 billion ÷ $500 = 120 million households. The slide doesn't say whether that's one season or a year, or how many households are "active". It is also a retail figure, while the marketplace trades used gear; the slide doesn't say how much of that spend is resold, or what fee it charges.
What a founder can adapt: "[N] active households × $500 per season; [X]% resold second-hand = $[Y]B resale; at our [Z]% fee, $[W]".
Supporting analysis
What the deck claims: "$500 of sporting goods / active household / season" → "$60b Retail Market".
Presentation choice: It shows spending per household, which is the right unit, but skips the resale and fee steps.
When it does not fit: Sizing a resale marketplace with new retail spending.
Marketplace for finding child care. Included as a weaker example on the fee question.
Winnie deck, slide 14. Exact stored slide matched to this analysis.
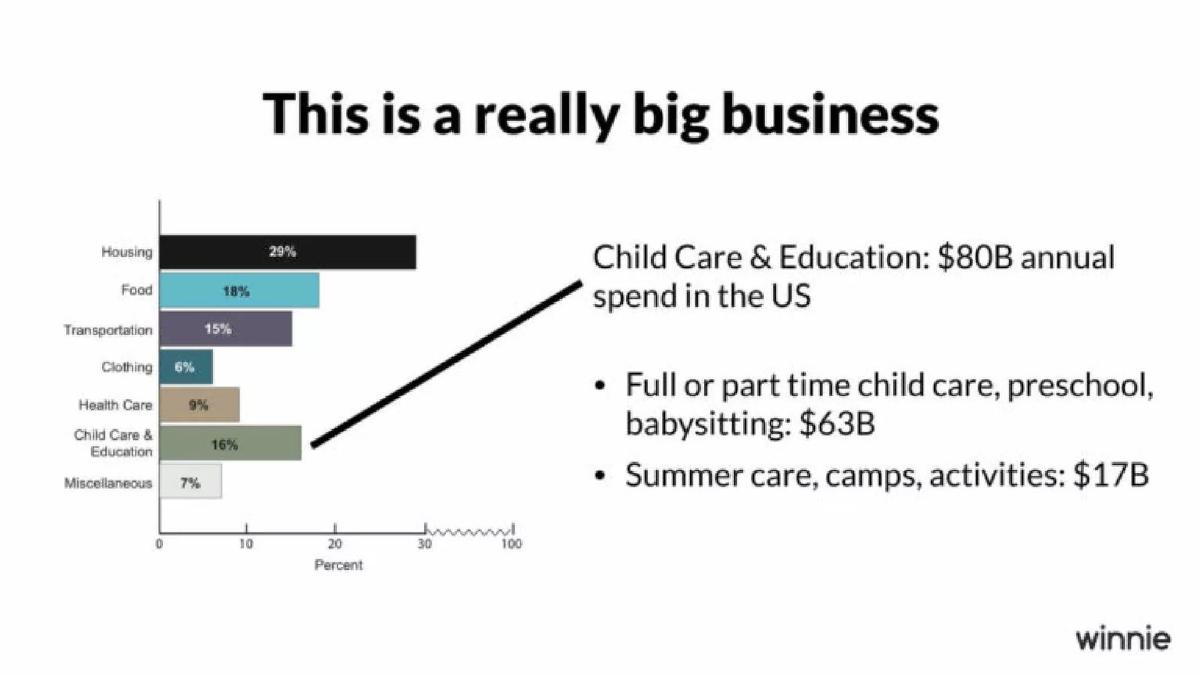
Our analysis: A clear spending split with no link to platform revenue.
Evidence and limitation: The parts add up: $63 billion + $17 billion = $80 billion. It gives annual spending by category but not what a platform earns from it: no fee, subscription or advertising revenue. No source or year for the chart.
What a founder can adapt: Add: "Providers spend [X]% of revenue finding families; [Y] listings × $[price] = $[Z]".
Supporting analysis
What the deck claims: "This is a really big business." A bar chart of family spending shares (Housing 29%, Food 18%, Transportation 15%, Child Care & Education 16%, and others). "Child Care & Education: $80B annual spend in the US. Full or part time child care, preschool, babysitting: $63B. Summer care, camps, activities: $17B."
Presentation choice: Included because the spending breakdown is clear but the revenue step is missing.
When it does not fit: Spending with no route to your revenue.
Platform for booking outdoor recreational activities. Included as a weaker example.
Avventura deck, slide 4. Exact stored slide matched to this analysis.
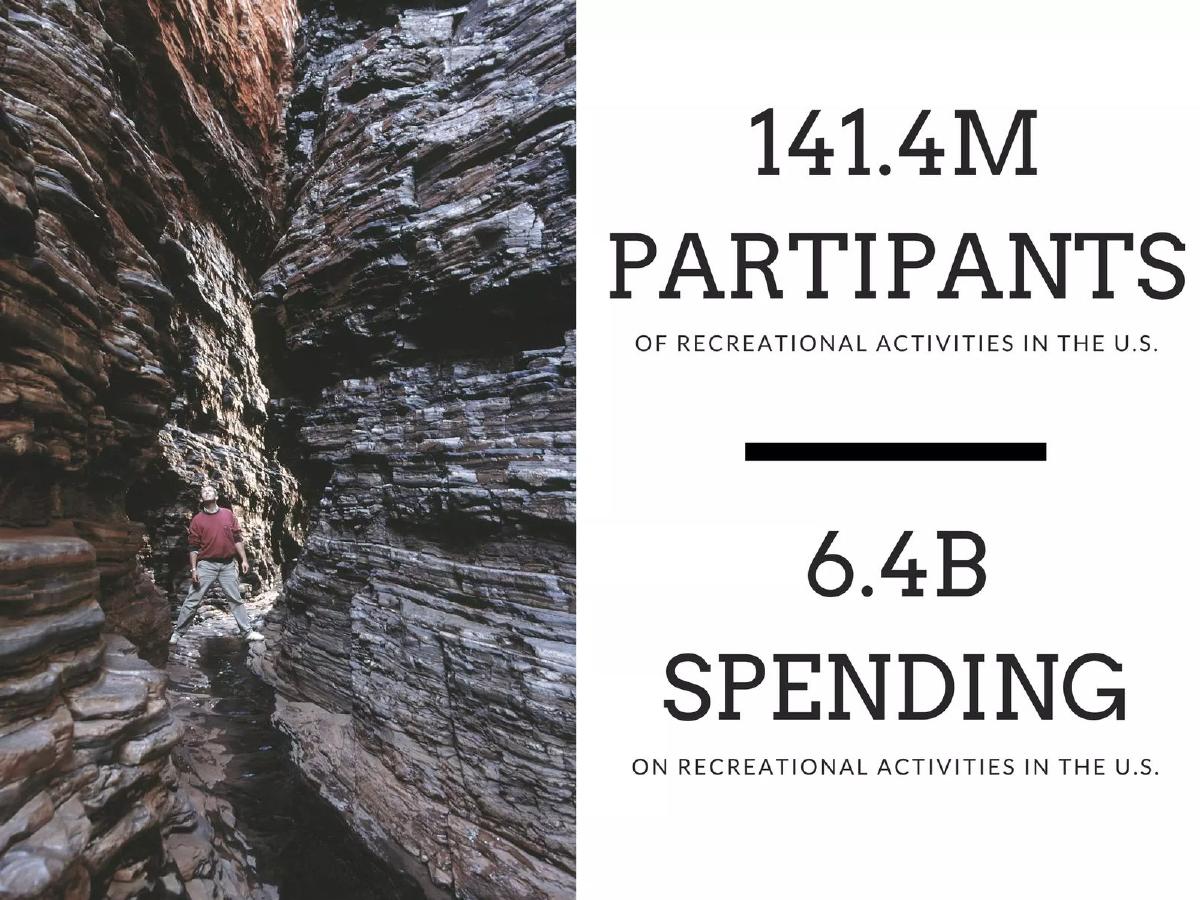
Our analysis: Two headline figures with nothing connecting them to the business.
Evidence and limitation: $6.4 billion ÷ 141.4 million is about $45 per participant. No year, source, currency label, definition of "recreational activities", or fee.
What a founder can adapt: "[N] guided activities booked a year × $[price] = $[X]B ([source, year]); at a [Y]% fee, $[Z]".
Supporting analysis
What the deck claims: "141.4M partipants of recreational activities in the U.S." "6.4B spending on recreational activities in the U.S." (spelling as on the slide).
Presentation choice: Included to show a market slide that gives investors nothing to check.
When it does not fit: Unsourced totals and typos on the headline slide.
Transaction value, fee pool, and whether the rate linking them is shown.
Example
Transaction value
Fee pool
Fee rate
Source and year
NewHomeMate
$400B
$12B buy side; $38B closing
Implied 3%
Year only
Home61
$2T
$60B
Implied 3%
Neither
Immo
€1.8T
Not multiplied
6–7% stated
Source and basis
Podvertise
$1.19B SAM
No
No; 1% labelled ARR
Neither
Sideline Swap
$60B new retail
No
No
Neither
Winnie
$80B
No
No
Neither
Avventura
6.4B
No
No
Neither
Key Takeaways
Label whether each figure is transaction value or revenue.
Show the fee rate that turns one into the other.
Your revenue share is a slice of the fee pool, not of transaction value.
Check that the spending you size is the kind that will flow through you (new vs used, online vs offline).
Give a source, a year and a place for each figure.
Build your marketplace market slide
Work from transaction value to the revenue you could earn.
Transaction value. What do buyers spend a year on what your platform handles? Source, year, place.
Fit. Is that the right kind of spend (used vs new, online vs offline, your segment)?
Fee rate. What fee do incumbents charge, and what will you charge?
Fee pool. Transaction value × fee rate.
Your share. What share of transactions could you handle, and by when?
Copyable framework: [Place] [category] transactions: $[X]B a year ([source, year]). At a [Y]% fee: $[Z]B fee pool. Our target: [share]% of transactions by [year] = $[W] revenue.
Illustrative example 1 — written by us
Before: $1.19B SAM; $11.9M ARR (1%).
After: $1.19B host-read spend ([source, year]); 1% = $11.9M of bookings; at a [X]% fee = $[Y] revenue.
What improved: Our illustrative rewrite of the Podvertise slide; bracketed figures are placeholders, not company facts. It separates bookings from revenue.
What this guide adds
The bottom-up and TAM/SAM/SOM guides explain how to build and narrow a market estimate for any company. The marketplace business model guide covers how platforms charge. This guide covers the step between them for marketplaces: whether the market figure is money the platform handles or money it keeps.
Transaction value, fee pool and revenue
Transaction value (often called GMV, gross merchandise value) is everything buyers pay sellers. The fee pool is the part of that value paid out in commissions or fees today, whoever collects them. A marketplace's revenue is its take rate times the transactions that pass through it.
A slide that shows only transaction value makes the market look many times larger than the revenue available. A 3% fee on $2 trillion is $60 billion, not $2 trillion. If the platform plans to charge less than incumbents, the relevant pool shrinks further.
How we read each slide
We quote the text on the slide images and redid each calculation mentioned. We have not checked the source figures. None of these pages was in our stored image set, so we rendered each from the original deck file in our library; the pages shown are the ones quoted.
Common mistakes
Transaction value as revenue. Your revenue is your fee on transactions, not the transactions.
No fee rate. Show the rate that converts value into a fee pool.
Wrong kind of spend. A resale platform should size resale, not new retail.
Unsourced, undated figures. Give the source, year and place.
Overlapping pools. Say whether fee figures overlap or add up.
Diagnostic checklist
Transaction value labelled as such, with source and year.
Fee rate shown.
Fee pool calculated.
Your share of transactions and resulting revenue kept separate.
Spend matches what flows through your platform.
Frequently asked questions
Should a marketplace size its market by GMV or by revenue?
Show both and label them: the transaction value (GMV), then the fee pool it produces at a stated fee rate. Home61 shows $2 trillion in sales next to $60 billion in commissions, a 3% rate.
What's a common mistake on marketplace market slides?
Treating a share of transaction value as the company's revenue. Podvertise labels 1% of podcast ad spending as ARR, which holds only if it keeps the whole ad spend rather than a fee on it.
How we chose these examples
Corpus: published pitch deck teardowns on StartupFundraising.com. Founder-uploaded private decks are excluded.
Selection (2026-09-26): we searched teardowns that mention a marketplace for market-size slides that also mention commissions, take rate, transactions, spending or GMV. We rendered 12 pages from 11 decks and read each.
Kept seven. Excluded: AceUp p3 (a problem slide with a spending figure), Florence p6 (a product description page), Headout p3 (a problem slide), Home61 p7 (distribution, not market size; the market page is p6), WeStrive p2 (a problem slide with no figures).
None of the chosen pages was in our stored image set; we rendered them from the original deck PDFs in our library and stored them with the existing slide-image workflow. All seven decks were confirmed as published teardowns on 2026-09-26.
Review: slide images were checked on 2026-09-26 and matched to company, deck and page (editorial model review). No person has yet completed an editorial review of this page. We make no claim that any slide caused a fundraising outcome.