How marketplaces show their supply side in a pitch deck: how many providers, how good, how dense, whether they stay, and how they are recruited.
Marketplace Supply Slide: Showing the Side That Makes Buyers Come
A marketplace is only useful to buyers if there is enough good supply where and when they need it: coaches, gyms, restaurants, teachers, charities, products. Investors ask how many providers you have, whether they are good, whether they are dense enough in one place, whether they stay, and what it costs to add more. This guide compares seven real supply-side slides on those questions.
TL;DR
Show the supply count with a date, one measure of quality, density in the area you serve, whether providers stay, and how you recruit them. Laoshi comes closest on staying power: 290+ teachers with more than 40% still active after five months. Fitpal shows 470+ gyms on a map of one city, plus 200,000+ classes taken, which works out to roughly 425 per gym. AceUp gives 500+ coaches with quality shares (80% with advanced degrees). Lunchbox sets a supply threshold before launch: 1,000 restaurant locations in New York. PledgeGo describes how it vets charities. Chillchat and Pair give a recruiting intention and a bare count.
Marketplace supply slides from real pitch decks
Each example shows the slide above its analysis and links to the full teardown. Slides that show supply staying or being used come first. Claims are as shown on the slides; checks and comments are ours.
Laoshi traction slide — slide 10
App connecting Mandarin tutors with their students. Other pages of this deck appear in the edtech problem and solution guides.
Laoshi deck, slide 10. Exact stored slide matched to this analysis.
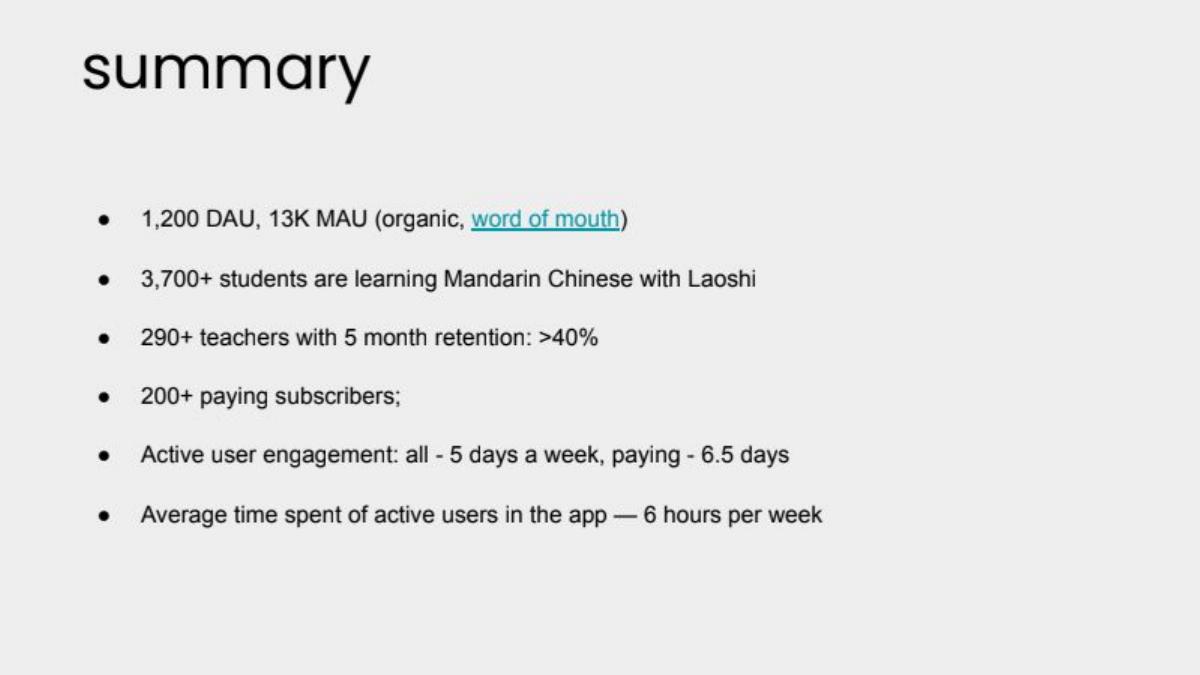
Our analysis: Supply retention next to demand figures, so an investor can see both sides.
Evidence and limitation: The only slide here that measures whether supply stays: more than 40% of teachers active after five months. The slide doesn't say which group of teachers that is measured on (all who joined, or one month's intake) or what counts as active. 3,700 students for 290 teachers is about 13 students per teacher. No date.
What a founder can adapt: "290 teachers ([month, year]); of teachers who joined in [month], [X]% active in month 5 (active = [definition])".
Supporting analysis
What the deck claims: "Summary." "1,200 DAU, 13K MAU (organic, word of mouth)"; "3,700+ students are learning Mandarin Chinese with Laoshi"; "290+ teachers with 5 month retention: >40%"; "200+ paying subscribers"; "Active user engagement: all – 5 days a week, paying – 6.5 days"; "Average time spent of active users in the app — 6 hours per week".
Presentation choice: Retention is the supply measure most decks leave out, and this one gives it.
When it does not fit: A retention figure with no cohort or definition.
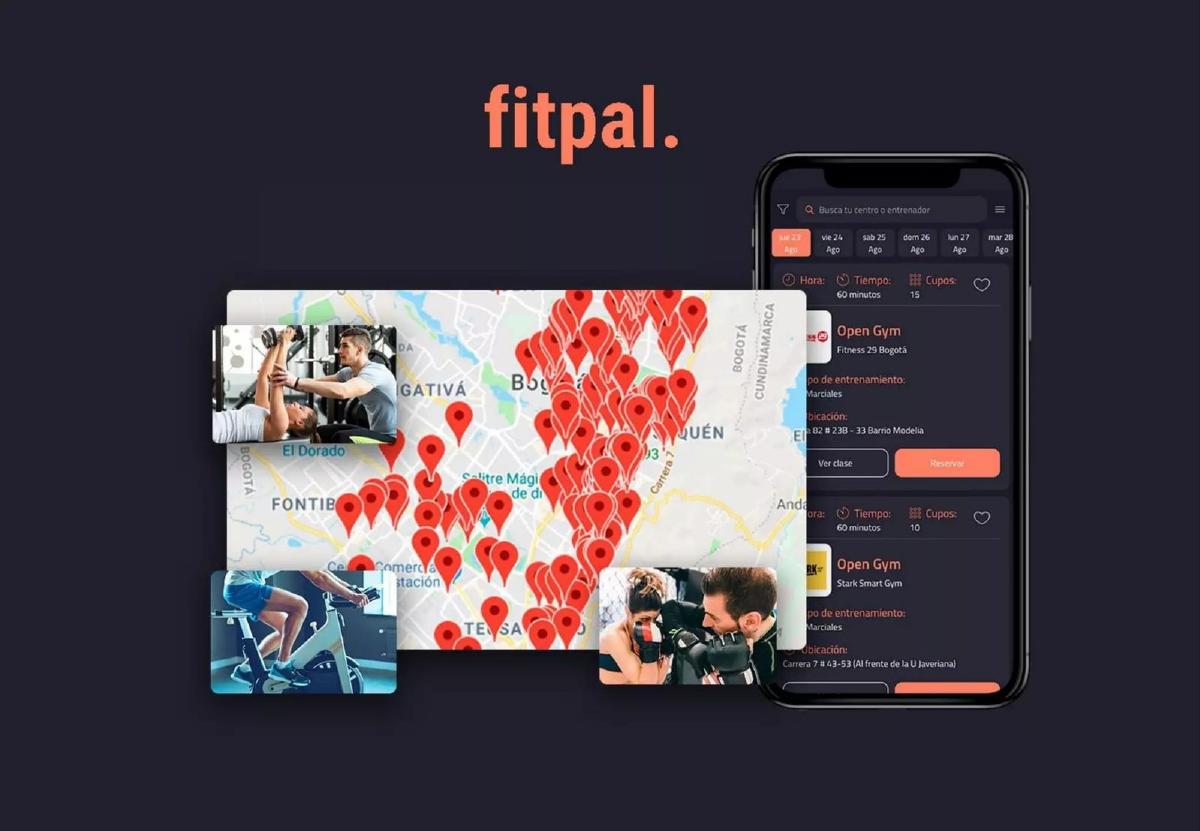
Gym and class pass app in Colombia; the map shows Bogotá.
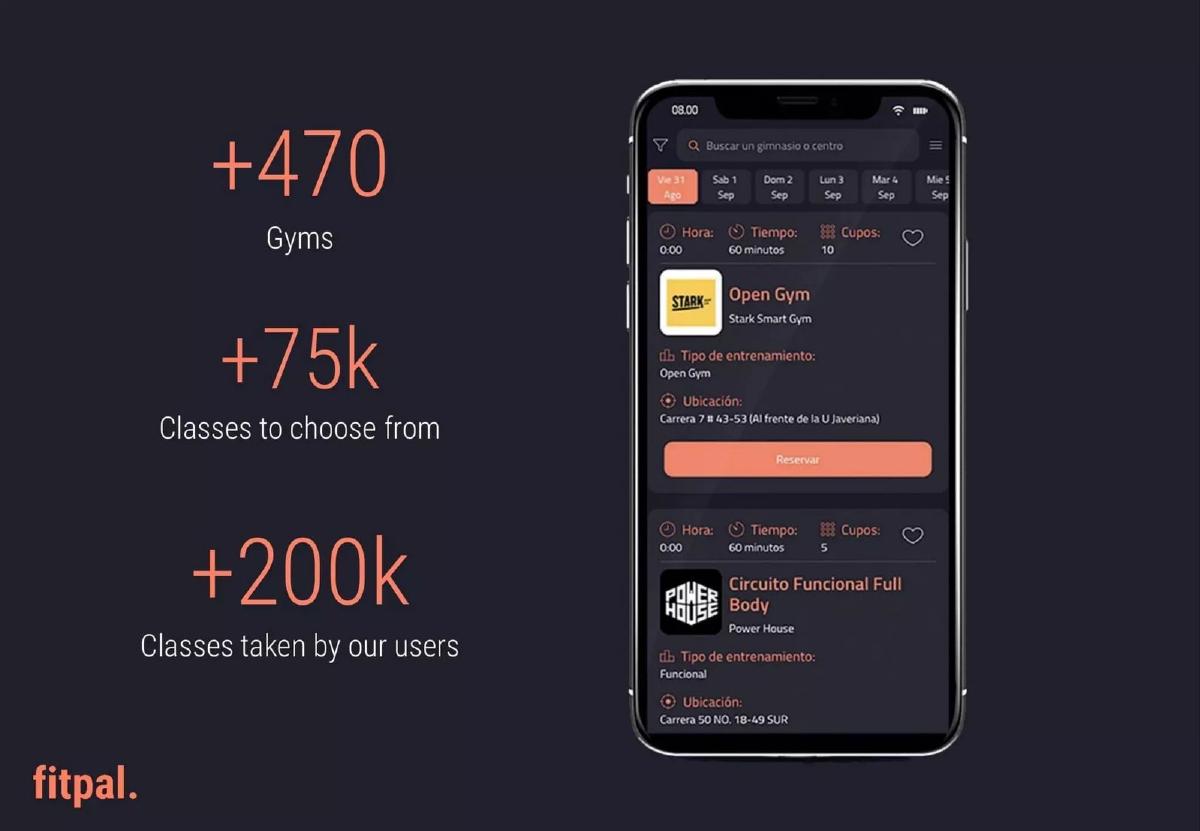
Fitpal deck, slide 6. Exact stored slide matched to this analysis.Fitpal deck, slide 8. Exact stored slide matched to this analysis.
Our analysis: Supply count, density and usage together.
Evidence and limitation: The map shows density in one city, which is what a local marketplace needs. 200,000 classes over 470 gyms is roughly 425 per gym, but the slide doesn't say over what period, so it's not clear whether that is a month or all time. "75k classes to choose from" also has no period. No split between Bogotá and other cities.
What a founder can adapt: "470 gyms, [N] in Bogotá ([date]); [X] classes booked per gym per month".
Supporting analysis
What the deck claims: Slide 6: a map of the city covered in pins, next to the app. Slide 8: "+470 Gyms"; "+75k Classes to choose from"; "+200k Classes taken by our users".
Presentation choice: It pairs the supply count with demand (classes taken), so the count means something.
When it does not fit: Cumulative totals with no period.
AceUp deck, slide 9. Exact stored slide matched to this analysis.
Our analysis: Quality as the main supply claim, which suits a buyer paying for expertise.
Evidence and limitation: A count with two quality measures and named certifications, which is what a corporate buyer checks. "Best & largest network in the US" has no comparison or source. No figures on how many coaches are active or booked.
What a founder can adapt: "500 coaches, [N] with at least one client this quarter; [X]% repeat bookings".
Supporting analysis
What the deck claims: "Our +500 coaches have a proven track record in their field, with decades of experience." "+80% hold a PhD, MSc or MBA degree"; "+90% have managerial experience at Fortune 500 companies." "The Best & Largest Network in the US." "Our coaches have worked for": Google, GE, Sanofi, IBM, MIT, Deloitte, Harvard Business School. "And are certified by": ICF, iPEC, Korn Ferry, William James College, and others.
Presentation choice: It gives specific quality shares rather than adjectives.
When it does not fit: "Best and largest" without a comparison.
Restaurant ordering software planning a consumer marketplace. A different page of this deck appears in the product-by-stage guide.
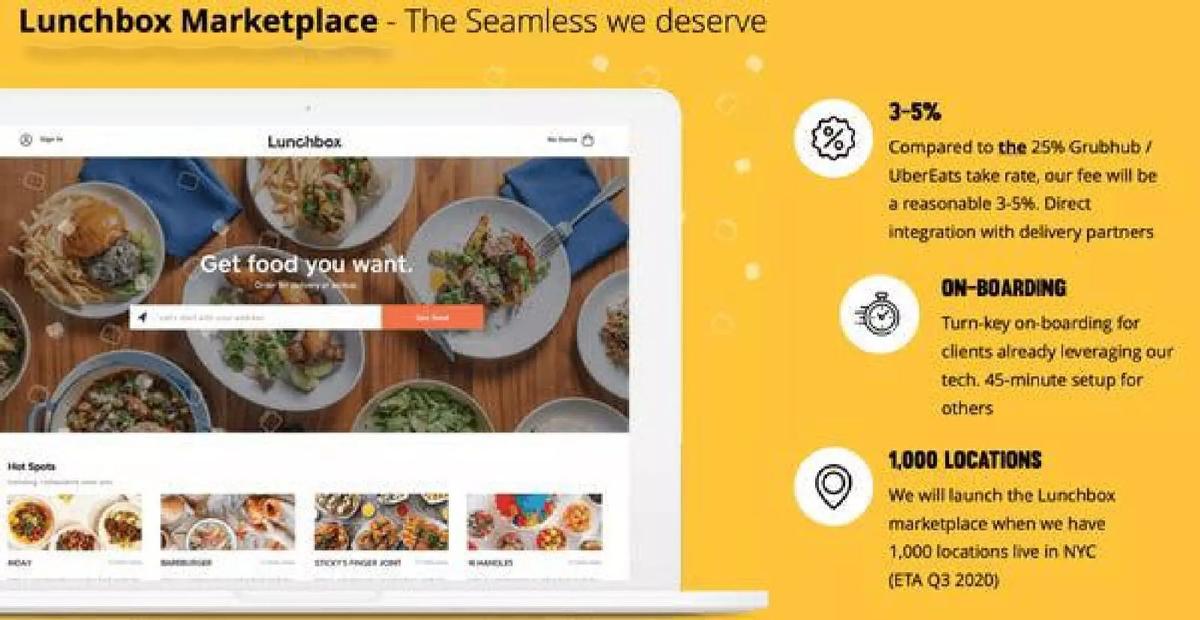
Lunchbox deck, slide 8. Exact stored slide matched to this analysis.
Our analysis: Supply-first launch, recruited from an existing customer base.
Evidence and limitation: A supply threshold before opening to buyers, in one city, with a date: the plainest answer to the chicken-and-egg problem in this set. The supply comes from existing software clients, and the lower fee is the recruiting pitch. The slide doesn't say how many locations are live now or how many existing clients are in New York.
What a founder can adapt: Add the base: "[N] of 1,000 NYC locations already on our software ([date])".
Supporting analysis
What the deck claims: "Lunchbox Marketplace – The Seamless we deserve." "3–5%: Compared to the 25% Grubhub / UberEats take rate, our fee will be a reasonable 3–5%. Direct integration with delivery partners." "On-boarding: Turn-key on-boarding for clients already leveraging our tech. 45-minute setup for others." "1,000 locations: We will launch the Lunchbox marketplace when we have 1,000 locations live in NYC (ETA Q3 2020)."
Presentation choice: It states when the marketplace is liquid enough to launch, and where supply will come from.
When it does not fit: A threshold with no current progress toward it.
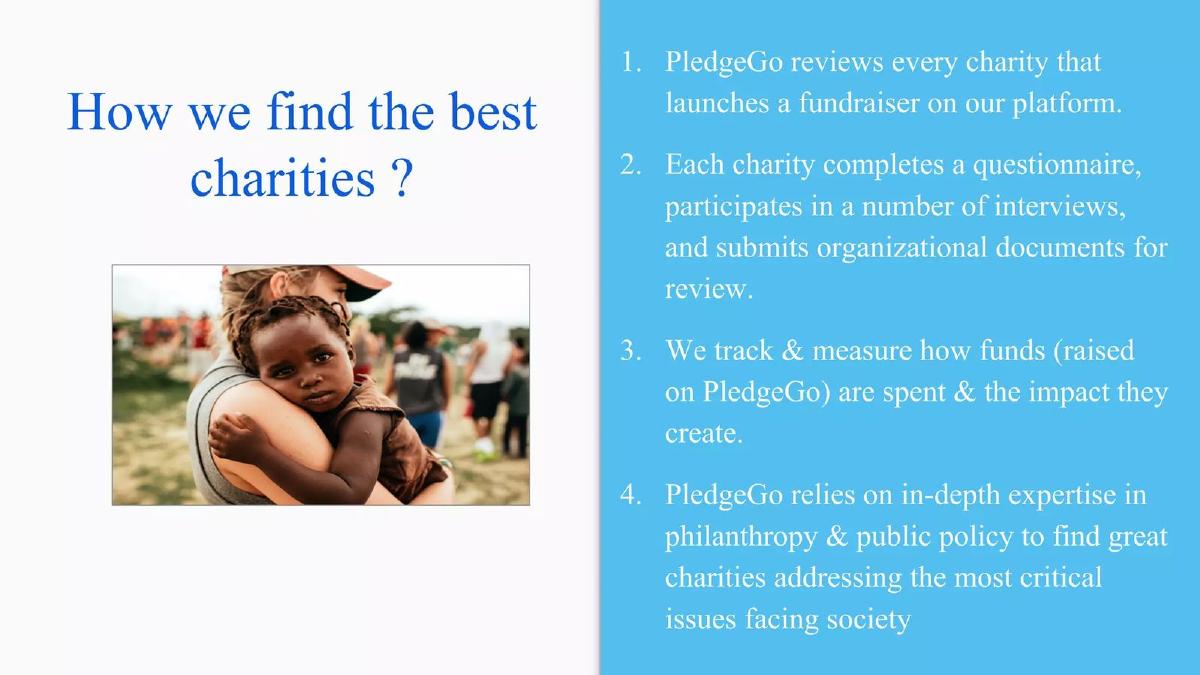
PledgeGo deck, slide 5. Exact stored slide matched to this analysis.
Our analysis: Supply quality through screening rather than numbers.
Evidence and limitation: A vetting process, which is the quality measure donors care about. No count of charities, approval rate or example of impact tracked.
What a founder can adapt: "[N] charities applied, [M] approved ([X]%); [K] live fundraisers".
Supporting analysis
What the deck claims: "How we find the best charities?" "1. PledgeGo reviews every charity that launches a fundraiser on our platform. 2. Each charity completes a questionnaire, participates in a number of interviews, and submits organizational documents for review. 3. We track & measure how funds (raised on PledgeGo) are spent & the impact they create. 4. PledgeGo relies on in-depth expertise in philanthropy & public policy to find great charities addressing the most critical issues facing society."
Presentation choice: It explains the screening step, which a donor-side marketplace needs for trust.
When it does not fit: Process without outcome figures.
Online game platform seeking content from outside developers. Included as a weaker example.
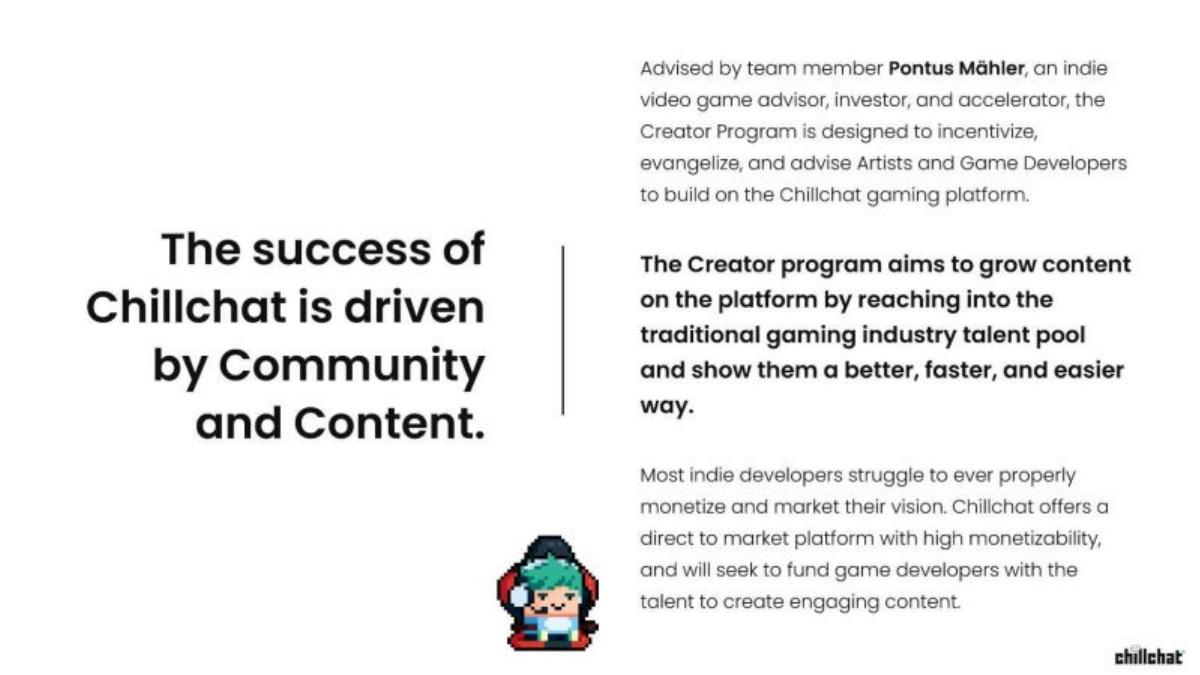
Chillchat deck, slide 10. Exact stored slide matched to this analysis.
Our analysis: A cold-start plan for content supply.
Evidence and limitation: A recruiting plan for the supply side (developers), with a named adviser and a funding incentive. No count of developers signed, budget or target.
What a founder can adapt: "Creator Program: [N] developers applied, [M] building; $[X] fund, [K] games live by [date]".
Supporting analysis
What the deck claims: "The success of Chillchat is driven by Community and Content." "Advised by team member Pontus Mähler, an indie video game advisor, investor, and accelerator, the Creator Program is designed to incentivize, evangelize, and advise Artists and Game Developers to build on the Chillchat gaming platform." "The Creator program aims to grow content on the platform by reaching into the traditional gaming industry talent pool…" "…will seek to fund game developers with the talent to create engaging content."
Presentation choice: Included to show a supply recruiting plan with no measure of progress.
When it does not fit: A recruiting programme with no target.
Augmented reality app for placing furniture in a room. Another page of this deck appears in the consumer app traction and churn guides. Included as a weaker example.
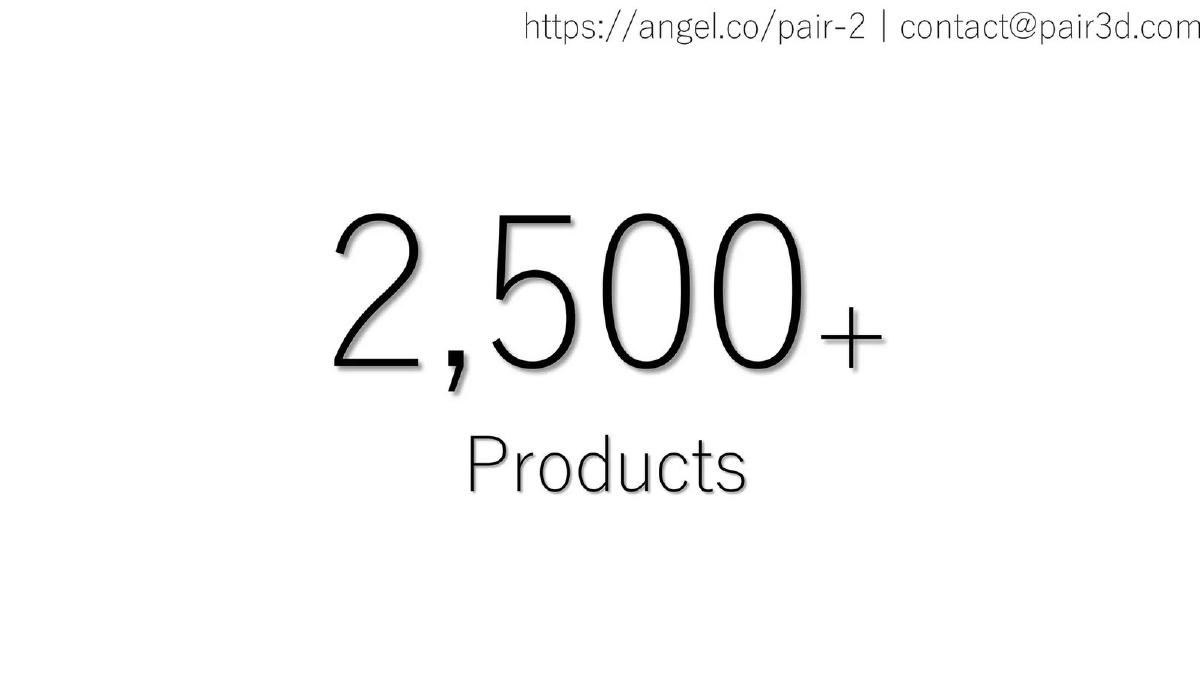
Pair deck, slide 4. Exact stored slide matched to this analysis.
Our analysis: Supply breadth as a single figure.
Evidence and limitation: A catalogue count and nothing else: no date, number of brands, share of products used, or whether it covers what buyers search for.
What a founder can adapt: "2,500 products from [N] brands ([date]); [X]% of searches find a match".
Supporting analysis
What the deck claims: "2,500+ Products."
Presentation choice: Included to show a supply count that gives an investor nothing to judge it by.
When it does not fit: A bare count on its own slide.
Which of the five supply questions each slide answers.
Example
Count
Quality
Density or usage
Retention
Recruiting
Laoshi
290+ teachers
No
~13 students per teacher
>40% at 5 months
No
Fitpal
470+ gyms
No
Map; 200k classes taken
No
No
AceUp
500+ coaches
Degrees, experience
No
No
No
Lunchbox
Target 1,000
No
One city
No
Existing clients
PledgeGo
No
Vetting process
No
No
No
Chillchat
No
No
No
No
Creator Program
Pair
2,500+ products
No
No
No
No
Key Takeaways
Date the supply count and say where it is.
Show density in the area you serve, not just a national total.
Give one quality measure buyers care about.
Show whether providers stay: retention after a set number of months.
Show usage per provider, so the count means something.
Say how you recruit supply and what it costs.
Build your supply slide
Answer as many of the five questions as your data allows.
Count. How many providers, where, on what date?
Quality. What quality measure do buyers care about?
Usage. Bookings or sales per provider per month?
Retention. Share of a joining cohort still active after N months, and what counts as active?
Recruiting. Where does new supply come from, how fast, at what cost?
Copyable framework: [N] [providers] in [area] ([date]); [X]% [quality measure]; [Y] bookings per provider per month; [Z]% of the [month] cohort active at month [K]; recruited via [channel] at $[cost] each.
Illustrative example 1 — written by us
Before: 2,500+ products.
After: [N] products from [M] brands ([date]); [X]% of searches return a match.
What improved: Our illustrative rewrite; bracketed figures are placeholders, not company facts. It turns a bare count into evidence of coverage.
What this guide adds
The marketplace traction guide covers transactions, GMV and take rate, and includes supply growth and supplier earnings (Vinterior, Smatbeba) as part of traction. The marketplace business model guide covers what the platform charges. This guide looks at the supply side on its own, adding questions that guide doesn't compare across slides: supplier quality, density, retention and recruiting — the evidence that there is enough, good enough, reliable supply for buyers to find what they want.
Five questions about supply
How much, and where: a count with a date and area. Density matters more than totals for local marketplaces.
How good: a quality measure relevant to buyers (qualifications, ratings, vetting).
Is it used: transactions or bookings per provider.
Does it stay: the share of providers still active after a set period.
How is it added: recruiting channel, time to onboard, cost per provider.
How we read each slide
We quote the text on the slide images and redid any arithmetic we mention. We have not checked company claims. None of these pages was in our stored image set, so we rendered each from the original deck file in our library; the pages shown are the ones quoted.
Common mistakes
Bare count. Add a date, an area and a usage figure.
National totals for a local market. Show density where buyers are.
Quality claims without measures. Give shares, ratings or vetting results.
No retention. Show whether providers stay.
Cumulative totals without a period. Per month is more useful than all time.
Recruiting plans without targets. State the target and progress.
Diagnostic checklist
Supply count is dated and located.
At least one quality measure.
Usage per provider.
Retention of providers over a stated period.
Recruiting channel and progress.
Frequently asked questions
How do I show the supply side of a marketplace in a pitch deck?
Give the count with a date and area, one quality measure, usage per provider, retention and how you recruit. Laoshi reports 290+ teachers with more than 40% still active after five months.
How do I handle the chicken-and-egg problem on a slide?
State the supply threshold you need before launching to buyers and where supply will come from. Lunchbox planned to launch once 1,000 New York restaurant locations were live, recruited from its existing software clients.
How we chose these examples
Corpus: published pitch deck teardowns on StartupFundraising.com. Founder-uploaded private decks are excluded.
Selection (2026-09-26): we searched teardowns for supply side, demand side, chicken-and-egg, cold start, onboarding providers and liquidity. We rendered 17 pages from 10 decks, including neighbouring pages, and read each.
Kept seven. Excluded: ArtStaq p2–3 and Azumi p5–6 (market problem and direct-to-fan context, not the company's supply), Hot Hotels p4–6 (problem and product pages), Chillchat p11 (an NFT minting and auction plan), Laoshi p9 (a teacher retention chart with unreadable axes; the same retention figure is stated on p10). One deck file (Bucketplace) was not in the library.
None of the chosen pages was in our stored image set; we rendered them from the original deck PDFs in our library and stored them with the existing slide-image workflow. All seven decks were confirmed as published teardowns on 2026-09-26.
Review: slide images were checked on 2026-09-26 and matched to company, deck and page (editorial model review). No person has yet completed an editorial review of this page. We make no claim that any slide caused a fundraising outcome.