Lunchbox presents a compelling case for a unified restaurant operating system by directly attacking the high fees and fragmented nature of existing third-party delivery and ordering platforms. The deck successfully uses a 'Shopify for Restaurants' narrative, supported by a stark financial comparison between building a custom stack ($1.2M onboarding) versus using Lunchbox ($35k onboarding). While the deck is strong on product features and competitive positioning, it relies heavily on projected market share and future marketplace launches rather than deep historical financial performance. The i…
Key takeaways
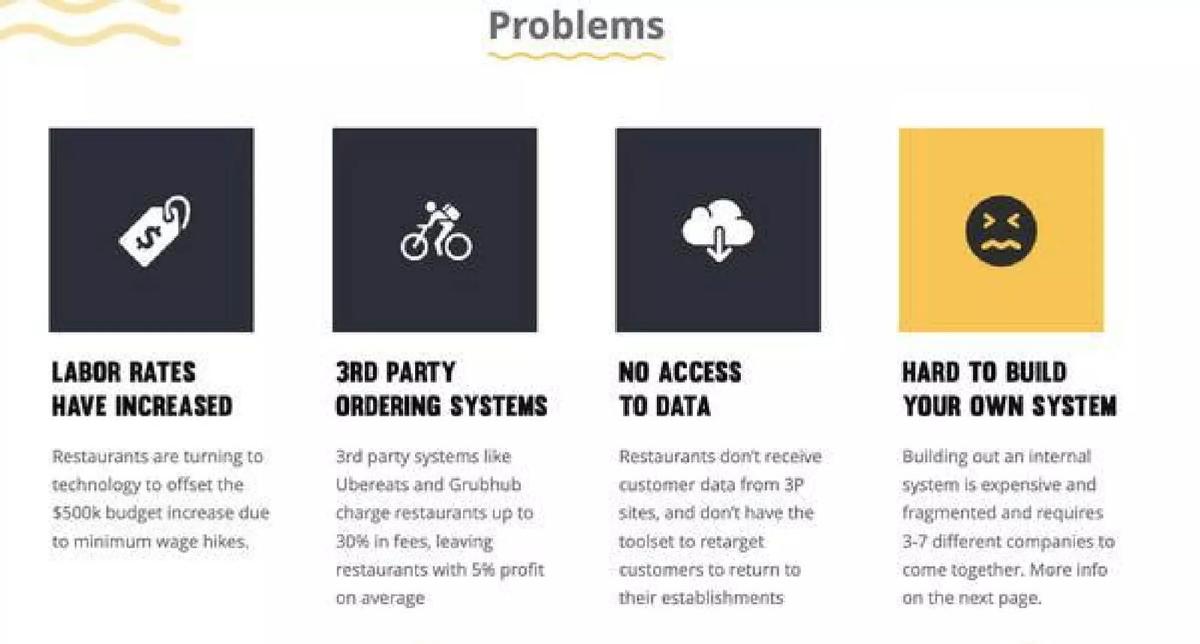
- The deck identifies a $500k budget increase for restaurants due to minimum wage hikes as a primary driver for tech adoption on slide 2.
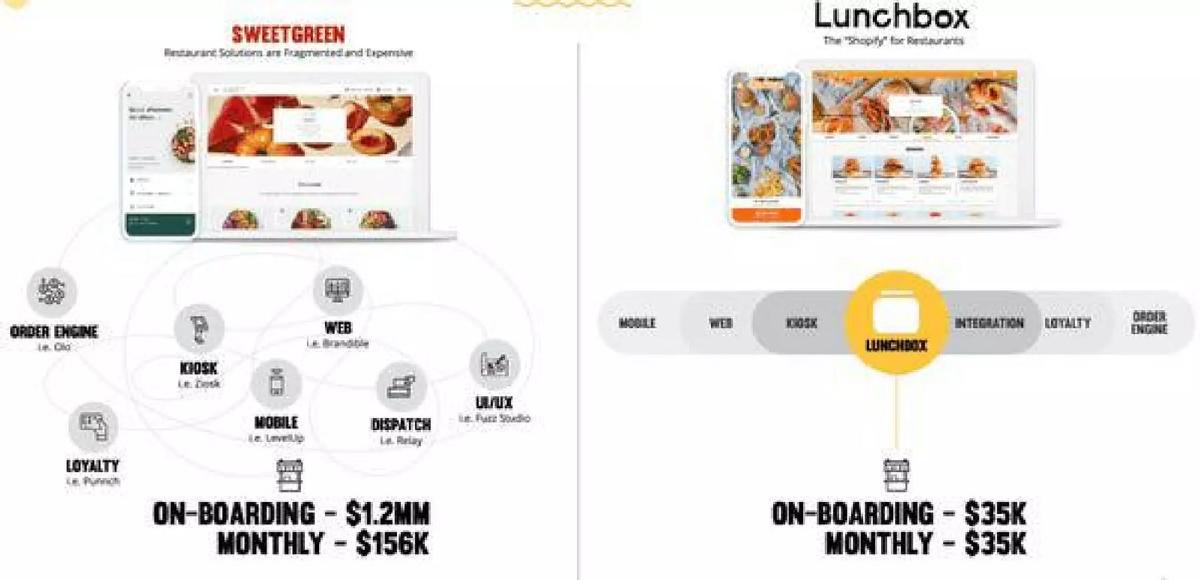
- Lunchbox claims to reduce onboarding costs from $1.2 million for a fragmented stack to just $35,000 on slide 3.
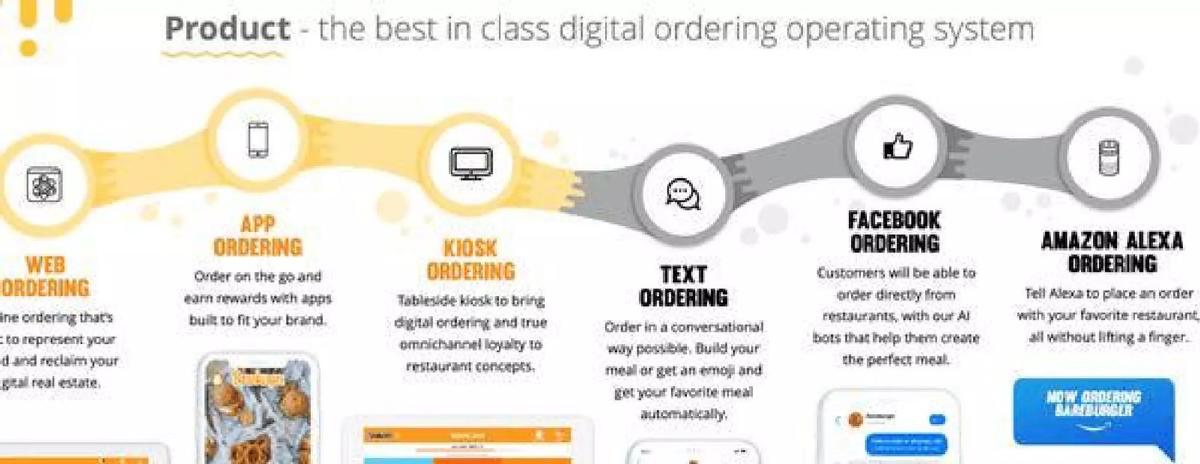
- The product roadmap includes expansion into text, Facebook, and Amazon Alexa ordering on slide 4.
- A planned marketplace launch was set for Q3 2020 once the company reached 1,000 locations in NYC, per slide 8.
- The company lists Bareburger, 16 Handles, and Sticky's as 'Live' clients with over 55 locations on slide 10.
- Lunchbox positions itself as the only 'Affordable' provider offering 'Multiple Channels' in a competitive matrix on slide 12.
- The founders emphasize their history, noting this is their third startup together over the last 5 years on slide 16.
- The business model relies on flat monthly fees: $300 for App, $200 for Web, and $500 + 5% for In-Store on slide 18.
Introduction
Lunchbox Technologies entered the market in 2019 with a clear mission: to provide a unified digital operating system for restaurants. This teardown examines the 18-slide deck that helped the company secure significant funding, eventually totaling over $72 million according to catalogue data. The deck focuses on the pain points of high third-party fees and the high cost of building internal tech stacks, positioning Lunchbox as a cost-effective, all-in-one solution.
The Problem and Value Proposition (Slides 1-3)
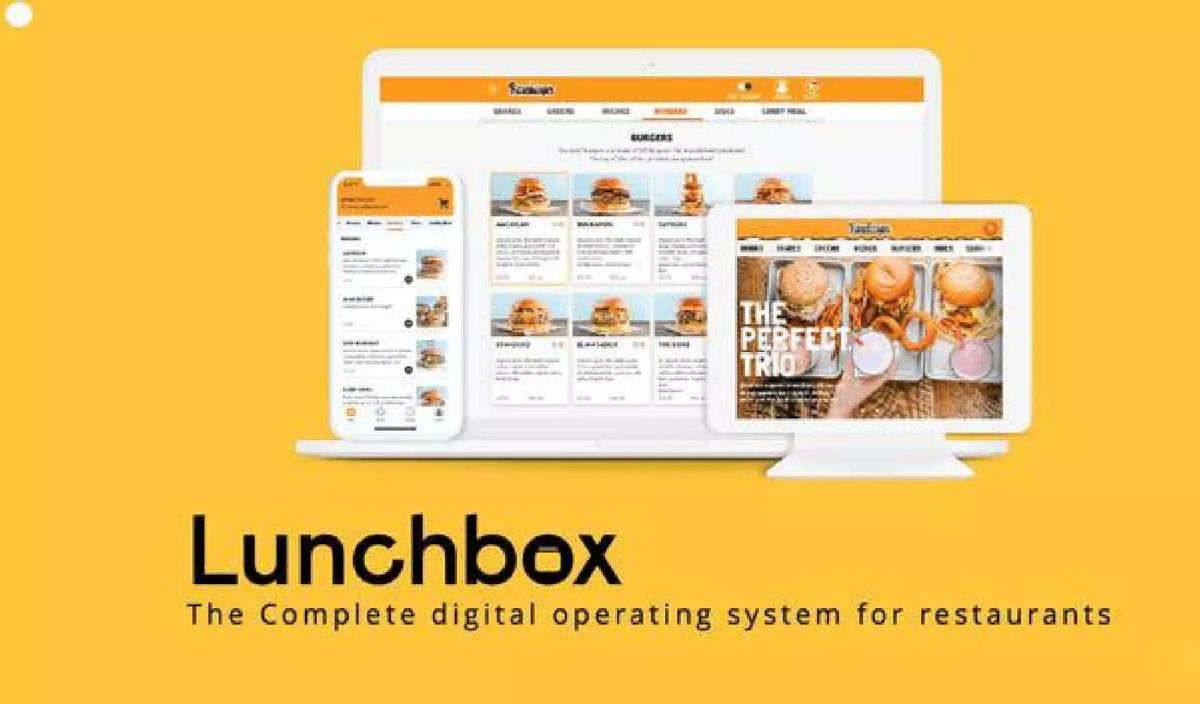
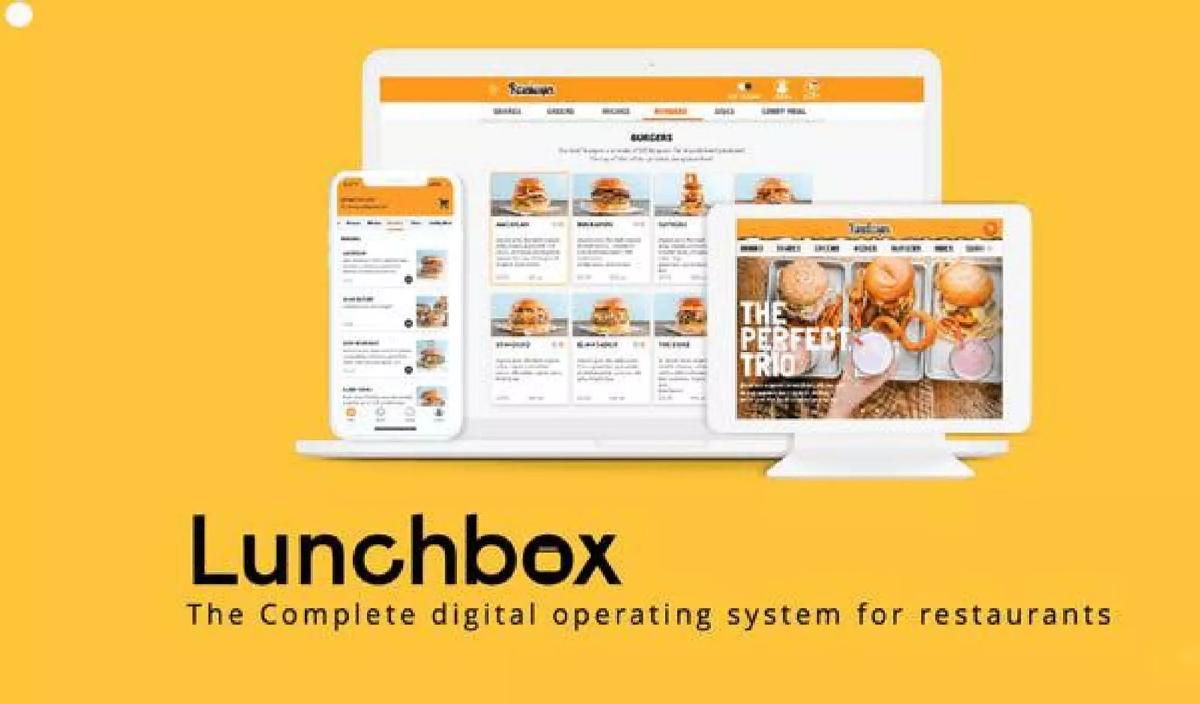
Slide 1 serves as the title page, establishing the brand identity with a bright yellow theme and the tagline: "The Complete digital operating system for restaurants." It features a mockup of the software across desktop, tablet, and mobile devices.
Slide 2 outlines four primary problems facing restaurants: increasing labor rates (citing a $500k budget increase due to minimum wage hikes), high fees from 3rd party ordering systems (up to 30%), lack of access to customer data, and the difficulty of building internal systems. It notes that building an internal system typically requires 3-7 different companies to work together.
Slide 3 is a critical comparison slide. It pits a fragmented solution (using Sweetgreen as a hypothetical example) against Lunchbox. The fragmented approach lists various providers like Olo, Punchh, and LevelUp, totaling $1.2 million in onboarding costs and $156k in monthly fees. In contrast, Lunchbox claims an onboarding cost of only $35k and a monthly fee of $35k. This 97% reduction in onboarding costs is the deck's strongest financial hook.
Product Capabilities and Roadmap (Slides 4-7)
Slide 4 introduces the "best in class" ordering system, showing a progression from web and app ordering to future-looking channels like text, Facebook AI bots, and Amazon Alexa integration. This suggests a roadmap aimed at capturing every possible customer touchpoint.
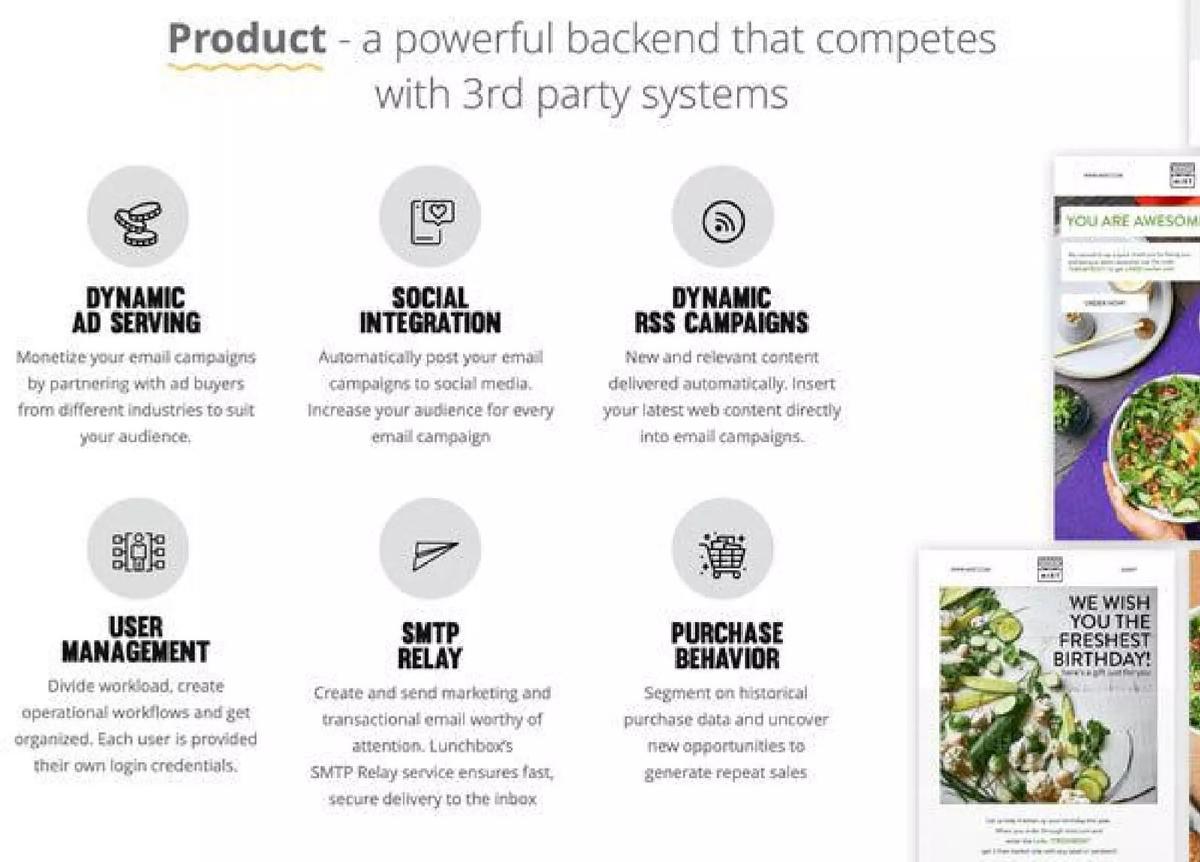
Slide 5 focuses on the backend features designed to compete with third-party systems. It lists dynamic ad serving, social integration, dynamic RSS campaigns, user management, SMTP relay for marketing emails, and purchase behavior segmentation. The goal here is to show that Lunchbox isn't just an ordering tool, but a marketing engine.
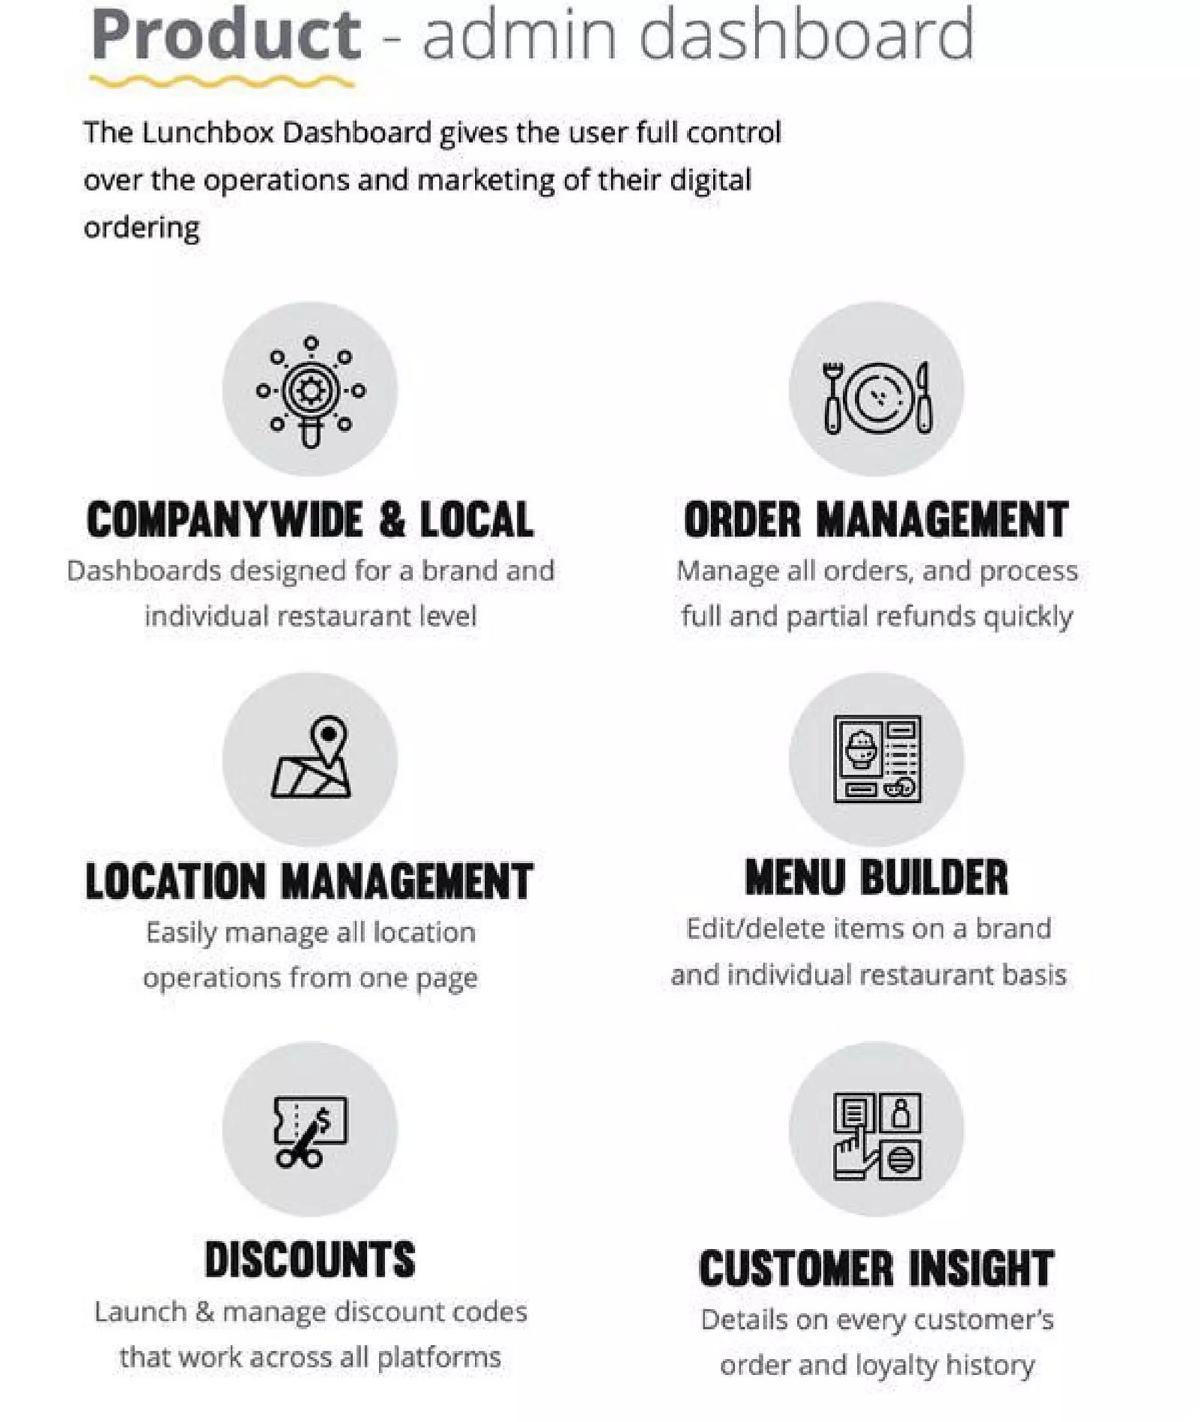
Slides 6 and 7 are identical in the provided set, detailing the admin dashboard. Features include company-wide and local dashboards, order management (including refunds), location management, a menu builder, discount code management, and customer insights. This emphasizes the operational control given back to the restaurant owner.
Expansion and Marketplace Strategy (Slides 8-9)
Slide 8 introduces the "Lunchbox Marketplace," described as "The Seamless we deserve." It targets a 3-5% take rate, significantly lower than the 25% charged by Grubhub or UberEats. The slide sets a milestone: launching the marketplace once they have 1,000 locations live in NYC, with an ETA of Q3 2020.
Slide 9 shows a vertical expansion into liquor. It illustrates a mobile interface for ordering champagne and a wheel of features including customer identity validation, 2FA, and customer loyalty specifically for the liquor vertical. This demonstrates the platform's versatility beyond standard food service.
Traction, Partners, and Competition (Slides 10-12)
Slide 10 displays the company's "Opportunity" through a pipeline view. It lists major partners like Toast, Square, and Stripe. The "Live" section features Bareburger, 16 Handles, and Sticky's, accounting for over 55 locations. The "Signed" and "In Talks" columns include recognizable names like Fuku and Zaxby's, suggesting a strong sales momentum.
Slide 11 is a standard competitive matrix. Lunchbox checks every box (App, Web, Kiosk, No Upfront Cost, White-Label, Omni-channel Loyalty, UI/UX), while competitors like Olo, LevelUp, and Ziosk only check one or two. It also claims a cost advantage, labeling Lunchbox as "1x" cost compared to Olo at "3x" and LevelUp at "7x."
Slide 12 uses a quadrant map to position Lunchbox in the top-right corner: "Multiple Channels" and "Affordable." It places competitors like Fuzz and Presto in the "Expensive" category and Toast and Brandibble in the "One Channel" or lower-channel categories.
Market Size and Exit Strategy (Slides 13-14)
Slide 13 provides a valuation comparable for OLO. It tracks OLO's journey from a $1.5M seed round to an $80M+ total raise with a $500M estimated valuation. This gives investors a clear benchmark for what a successful company in this space looks like.
Slide 14 lists "Recent Similar 2019 Exits" to prove liquidity in the sector. It cites LevelUp ($390M), Dynamic Yield ($300M), and Grubhub ($200M investment from Yum Brands). This slide is designed to de-risk the investment by showing that major players (Grubhub, McDonalds, Yum Brands) are actively acquiring or investing in restaurant tech.
Team and Business Model (Slides 15-18)
Slide 15 introduces the team and advisors. Co-founders Andrew Boryk and Nabeel Alamgir highlight their history of working together. The slide also lists logos of former employers, including Google, Apple, and Johnson & Johnson, to establish professional credibility.
Slide 16 summarizes "Our Edge," reiterating that this is the team's third startup together and that they are "industry insiders" who understand their customers' needs intimately.
Slide 17 breaks down the Total Addressable Market (TAM) from 2019 to 2021. It projects growth from $1.9B to $5.5B, driven by five revenue streams: Core SaaS, Marketplace, Wine/Spirits/Beer, CC Processing, and Services. The Marketplace is shown as the largest potential revenue driver in the 2021 projection.
Slide 18 concludes with the business model. It is a transparent breakdown of monthly fees ($200-$500) and setup fees. Most importantly, it includes a "savings" row, claiming that using Lunchbox saves a restaurant $1,300 per month compared to LevelUp on the app side and $850 per month compared to Bite Kiosk for in-store hardware.
What Works Well in This Deck
The deck excels at direct financial comparison . By quantifying the savings on slide 3 and slide 18, Lunchbox moves the conversation from "features" to "bottom-line impact." For a restaurant industry struggling with thin margins, this is the most persuasive argument possible.
The pipeline transparency on slide 10 is also highly effective. Distinguishing between "In Talks," "Signed," and "Live" builds trust with investors by showing exactly where the company stands in the sales cycle rather than just listing a wall of logos.
Finally, the exit strategy slides (13 and 14) are well-researched. Providing specific dollar amounts for recent acquisitions and following the valuation trajectory of a direct competitor (OLO) makes the potential return on investment feel tangible rather than theoretical.
What Is Missing From This Deck
The most notable omission is historical financial performance . While the deck is heavy on projections (TAM on slide 17) and pricing models (slide 18), it does not show a month-over-month growth chart of actual revenue or user acquisition. For a Series A deck, investors usually expect to see a "hockey stick" graph of past performance.
There is also a lack of unit economics . While the deck mentions the price charged to restaurants, it does not disclose the Customer Acquisition Cost (CAC) or the Lifetime Value (LTV). Without these metrics, it is difficult to judge the long-term sustainability of the low-price strategy Lunchbox is pursuing.
Lastly, the marketplace launch on slide 8 is presented as a future goal with an ETA, but the deck doesn't explain the strategy for overcoming the "chicken and egg" problem of attracting diners to a new marketplace once the restaurant tech is installed.
What a Founder Should Copy
Founders should emulate the "Shopify for X" narrative used here. By positioning themselves as the infrastructure that allows businesses to own their brand and data, Lunchbox taps into a powerful trend of decentralization against "taxing" platforms like Grubhub.
The competitive positioning on slide 12 is also a great template. Instead of just saying they are "better," they use two specific axes (Affordability and Channel Count) that highlight their unique value proposition in a crowded market.
Finally, the clear call-out of industry macro-trends (slide 2) is a smart way to frame the problem. Linking their product to a specific external pressure—like minimum wage hikes—makes the adoption of their technology feel like an inevitability rather than a luxury.
Company: Lunchbox Sector: Restaurant Technology / SaaS Stage: Series A Year: 2019 Slides: 18 Deck Type: Fundraising Pitch Deck Outcome: Raised $72,100,000 in total funding history HQ: New York, NY
Frequently asked questions
- How does Lunchbox differentiate itself from third-party delivery apps?
- According to slide 2, third-party systems like UberEats and Grubhub charge up to 30% in fees, leaving restaurants with only 5% profit. Lunchbox positions itself as a white-label alternative that allows restaurants to reclaim their data and brand. Slide 8 further highlights that Lunchbox's marketplace fee is only 3-5%, compared to the 25% take rate of major competitors.
- What is the core pricing structure for the Lunchbox platform?
- Slide 18 details a flat-fee business model. The App channel costs $300 per restaurant per month, the Web channel is $200 per month, and In-Store (kiosk) is $500 per month plus a 5% fee per device. Each channel has a one-time setup fee ranging from $200 to $300. The deck claims these rates save restaurants between $350 and $1,300 per month compared to competitors like LevelUp or GoParrot.
- What specific product features are highlighted in the deck?
- The deck emphasizes a wide range of ordering channels on slide 4, including web, app, kiosk, text, Facebook, and Amazon Alexa. Slides 5, 6, and 7 detail the backend capabilities, such as dynamic ad serving, social integration, SMTP relay for marketing emails, and an admin dashboard for company-wide menu and location management. There is also a specific mention of a liquor vertical expansion on slide 9.
- Who is the team behind Lunchbox and what is their experience?
- Slide 15 introduces co-founders Andrew Boryk and Nabeel Alamgir, noting they have worked together on two previous startups. The team claims over 20 years of collective experience in technology and restaurants, with past employment at companies like Google, Apple, and Merrill Lynch. Slide 16 reinforces their 'Edge' as industry insiders who are their own customers.
- What evidence of market traction does the deck provide?
- Slide 10 provides a snapshot of the sales pipeline. It lists three 'Live' clients (Bareburger, 16 Handles, Sticky's) covering over 55 locations. It also identifies 11 companies as 'Signed' (including Westville and Fuku) and a large list of prospects 'In Talks,' such as Clean Juice, Zaxby's, and Le Pain Quotidien. Additionally, slide 10 lists integrations with partners like Toast, Square, and Stripe.