Setup and Implementation Fees on a Pitch Deck: Size Them
One-time setup fees can help or confuse a business model slide. Four real decks show how to price them, keep them out of ARR and margin.
Setup and Implementation Fees on a Pitch Deck: Size Them, Keep Them Separate, Say What They Pay For
Many software and service companies charge a one-time fee when a customer starts: a setup fee, an onboarding fee or an implementation fee. On a pitch deck that fee raises three questions at once. Is it a real source of income or a cost recovery? Is it mixed into recurring revenue, gross margin or market size, where it would flatter the numbers? And does it slow customers down? This guide looks at four real decks that show a one-time fee and explains what each does well and what it leaves out: one keeps fees out of its gross margin and says so, one prices the fee next to the monthly price, one shows the fee as small next to the licence, and one counts setup fees as part of its market size.
TL;DR
Show the one-time fee next to the recurring price so its size is obvious, keep it out of ARR and say whether gross margin includes it, explain what the fee pays for (integration, configuration, training) and how long setup takes, and never add one-off fees to recurring market size without labelling them. Northspyre does the separation well: its '91% gross margins' carries the note 'Excluding one-time cost such as implementation and one-time fees such as implementation fees', though it doesn't give the margin with them included. Lunchbox lists 'One time setup fee: $300/restaurant' under a '$300 per restaurant per month' price, with '5 weeks' to go live, so the fee equals one month's subscription and the reader can see the trade. Moonhub's '£350 implementation fee' sits beside '£10+/user/month' with '50 users min', about 6% of the minimum first-year licence by our calculation. Optii's market slide shows 'One-off setup fees $96 million' beside 'Annual Recurring Revenue $118 million'; it keeps the two apart, but setup money is earned once per customer and recurring money every year, so the two bars are not comparable.
Four slides that show a one-time customer fee
Each slide is read at full size. Quotes are exact.
Northspyre business model slide — slide 8
Real-estate development software. Series B financials slide.
Northspyre deck, slide 8. Exact stored slide matched to this analysis.
Our analysis: A clean recurring margin with its exclusions disclosed.
Evidence and limitation: Margin definition stated; implementation revenue and blended margin not given.
What a founder can adapt: Add implementation share of revenue and the blended margin.
Supporting analysis
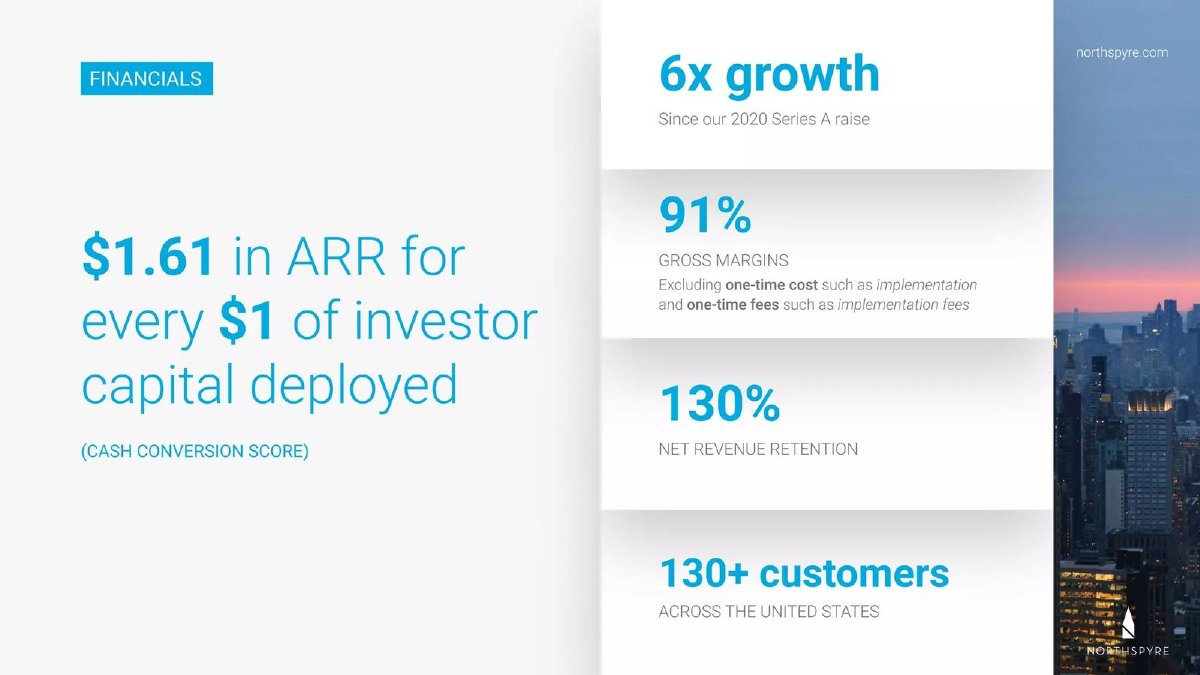
What the deck claims: "91% GROSS MARGINS Excluding one-time cost such as implementation and one-time fees such as implementation fees"; "130% NET REVENUE RETENTION"; "130+ customers".
Presentation choice: Shows how to keep fees and their cost out of a margin figure, openly.
When it does not fit: Excluding fees without saying so.
Lunchbox deck, slide 18. Exact stored slide matched to this analysis.
Our analysis: A modest fee shown beside the work it pays for.
Evidence and limitation: Fee equals one month's price for App and Web (our reading); weeks row unlabelled.
What a founder can adapt: Label the timing row and state setup cost.
Supporting analysis
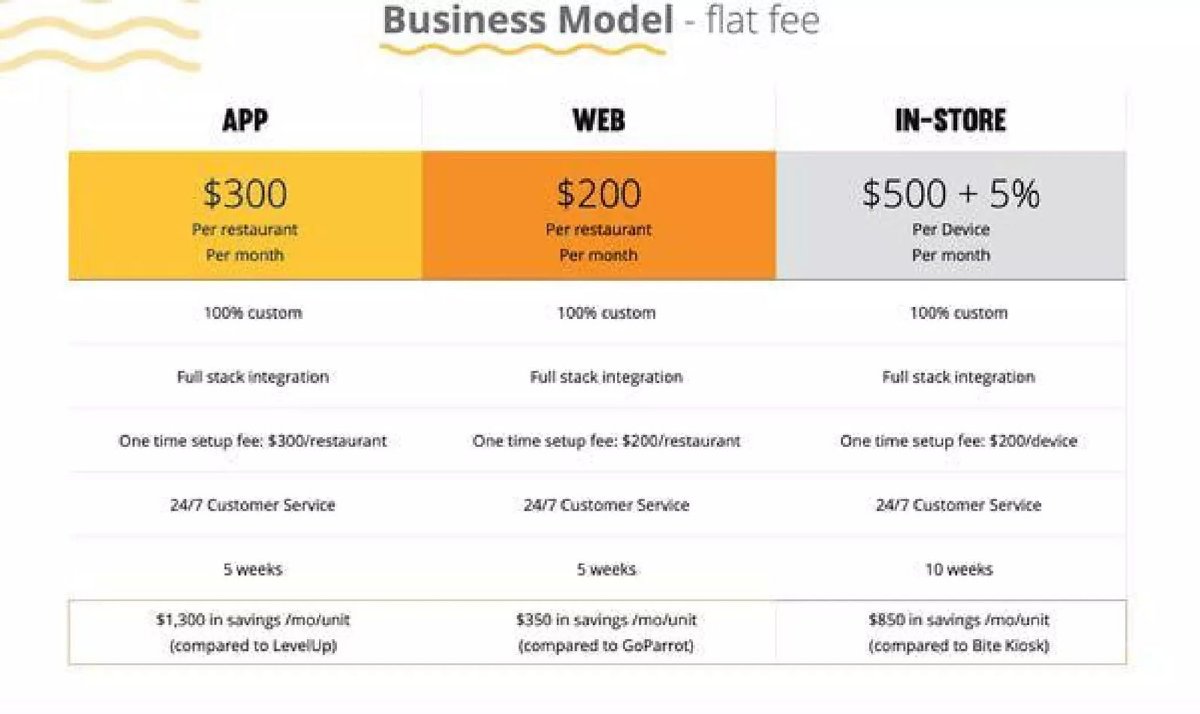
What the deck claims: "$300 Per restaurant Per month"; "One time setup fee: $300/restaurant"; Web $200 and $200; In-store "$500 + 5% Per Device Per month" and "$200/device"; "5 weeks", "10 weeks".
Presentation choice: Shows the fee and the recurring price in one table.
When it does not fit: '100% custom' for a small fee with no cost shown.
Optii deck, slide 10. Exact stored slide matched to this analysis.
Our analysis: Kept separate, but visually compared as if alike.
Evidence and limitation: About $229k setup vs $282k a year per company (our calculation); one-off and annual drawn side by side.
What a founder can adapt: Label setup as one-time and show recurring over time.
Supporting analysis
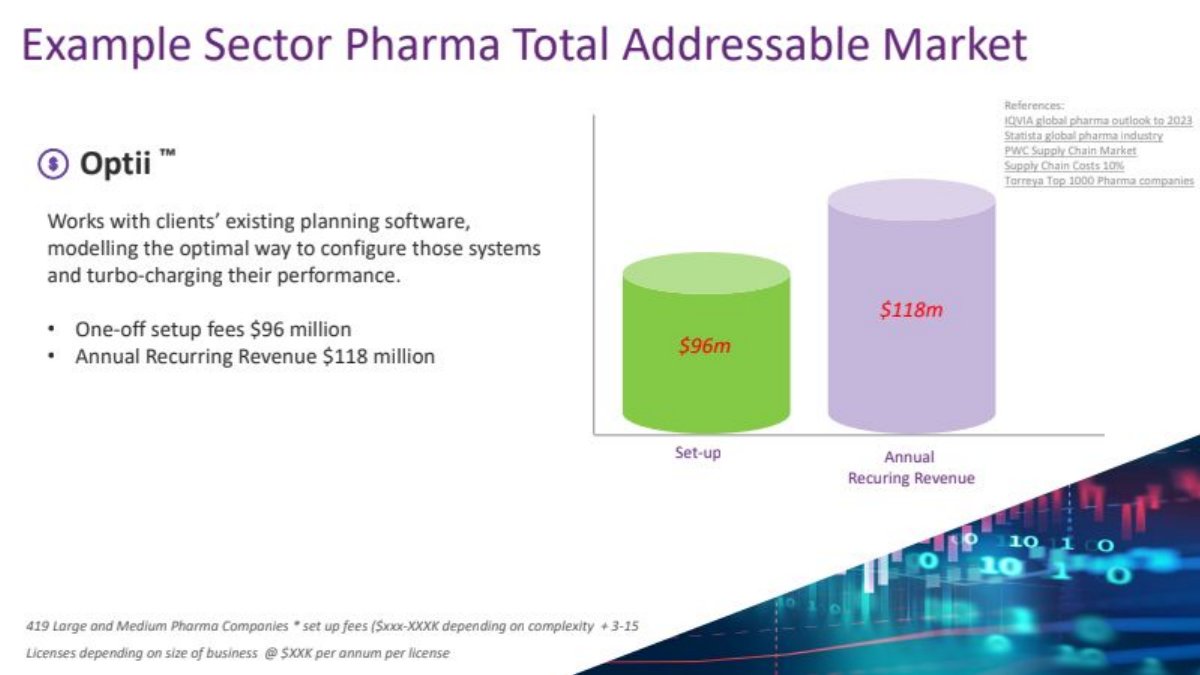
What the deck claims: "One-off setup fees $96 million"; "Annual Recurring Revenue $118 million"; "419 Large and Medium Pharma Companies"; unit prices redacted.
Presentation choice: Shows setup fees as a large share of value, and the risk in charting them.
When it does not fit: Bars that compare a one-off total with an annual figure.
After: "Recurring: $118M a year across 419 companies. One-time: $96M total, collected once at onboarding."
What improved: Our illustrative rewrite of Optii's figures. The wording is ours; the numbers are the slide's.
The question this guide answers
This guide answers one founder question: if my company charges a one-time setup or implementation fee, how should I show it on the deck so that investors read it correctly?
Our pricing guide covers how to present price tiers. Our revenue-mix guide covers how to split income by product or channel. Our time-to-value guide covers how long customers wait for a result, and our run-rate guide warns against calling one-off revenue ARR. Our contract-length draft covers billing terms such as annual prepayment. None takes the one-time fee as its subject: how big it should look against the recurring price, how it should be kept out of recurring metrics and margin, what it should be explained as, and how it should be treated in market sizing.
How we chose and read the examples
We searched extracted text across the library for 'setup fee', 'set-up fee', 'implementation fee' and 'onboarding fee'. Many matches were fund costs, start-up expenses, real-estate fees or listed companies. We kept four private-company slides where a company shows its own one-time customer fee in a different way: a financial summary that excludes fees from margin, a pricing table, a business model slide with two products, and a market sizing slide. We set aside Optii's own pricing slide (page 5) because its figures are redacted ('Set-up Fee: $XXk - $XXXk'), and a health-data deck whose issuer was a corporation of uncertain status.
Each slide was rendered from the source deck and read at full size. Ratios such as fee as a share of first-year licence are our calculations from the slides' own figures. All four companies were private when these decks were made. We did not check any figure against outside sources.
Why investors look closely at one-time fees
They can inflate recurring metrics. If setup fees are counted in monthly revenue and then annualised, ARR includes money that will not come again. Investors who find this later stop trusting the other numbers.
They can distort margin. Implementation is often people-heavy work done at a low margin or a loss. Including it can pull gross margin down; excluding the fees but not the cost can do the opposite. Either way, the reader needs to know what is in the figure.
They say something about the product. A large implementation fee suggests the product needs significant work for each customer. That can be fine in enterprise software, but it affects how fast the company can grow and how much it costs to add a customer.
They affect the sale. A fee is a hurdle at the moment of signing. Some companies use it to filter out unserious buyers; others waive it to close deals. An investor wants to know which, and whether the fee is actually collected.
Fees kept out of margin, with a note: Northspyre
Northspyre, a real-estate development software company, has a financials slide in its Series B deck with four tiles: '6x growth Since our 2020 Series A raise', '91% GROSS MARGINS Excluding one-time cost such as implementation and one-time fees such as implementation fees', '130% NET REVENUE RETENTION' and '130+ customers ACROSS THE UNITED STATES'. A large headline on the left reads '$1.61 in ARR for every $1 of investor capital deployed (CASH CONVERSION SCORE)'.
The note under the margin is the lesson. It tells the reader that both sides of implementation, the cost and the fee, are removed from the 91%. That makes the figure a margin on the recurring software, which is what an investor comparing software companies wants, and it prevents the reader from wondering whether services work has been hidden. It also signals that implementation exists as a separate activity.
What it leaves out is size. The slide doesn't say how much revenue implementation brings in, whether it makes or loses money, or what the blended gross margin would be. If implementation runs at a loss, the company's real margin is below 91%. One added line would answer it: 'Implementation: [x]% of revenue at [y]% margin; blended gross margin [z]%.' Keep the recurring margin as the headline, and give the blended figure nearby.
Fee priced against the monthly price: Lunchbox
Lunchbox, a restaurant ordering technology company, has a slide titled 'Business Model - flat fee' with three columns. App: '$300 Per restaurant Per month'. Web: '$200 Per restaurant Per month'. In-store: '$500 + 5% Per Device Per month'. Rows below give '100% custom', 'Full stack integration', 'One time setup fee: $300/restaurant' (App), '$200/restaurant' (Web) and '$200/device' (In-store), '24/7 Customer Service', a time row of '5 weeks', '5 weeks' and '10 weeks', and savings such as '$1,300 in savings /mo/unit (compared to LevelUp)'.
Placing the fee in the same table as the monthly price makes its size easy to judge. For App and Web the setup fee equals exactly one month's subscription; for In-store it is less than one month's base fee. A reader immediately sees that the fee is modest and is likely to cover some of the custom integration work, not to be a separate income stream. The '5 weeks' and '10 weeks' rows, which we read as time to go live, connect the fee to the work it pays for.
The gaps: the slide doesn't label the weeks row, so a reader has to infer what it measures, and it doesn't say whether the fee covers the cost of a fully custom build in five weeks. 'Full stack integration' and '100% custom' for $300 invites the question of how much each setup costs the company. A label and one figure would help: 'Go-live: 5 weeks; setup cost to us ~$[x] per restaurant, fee recovers [y]%.'
Fee shown as small next to the licence: Moonhub
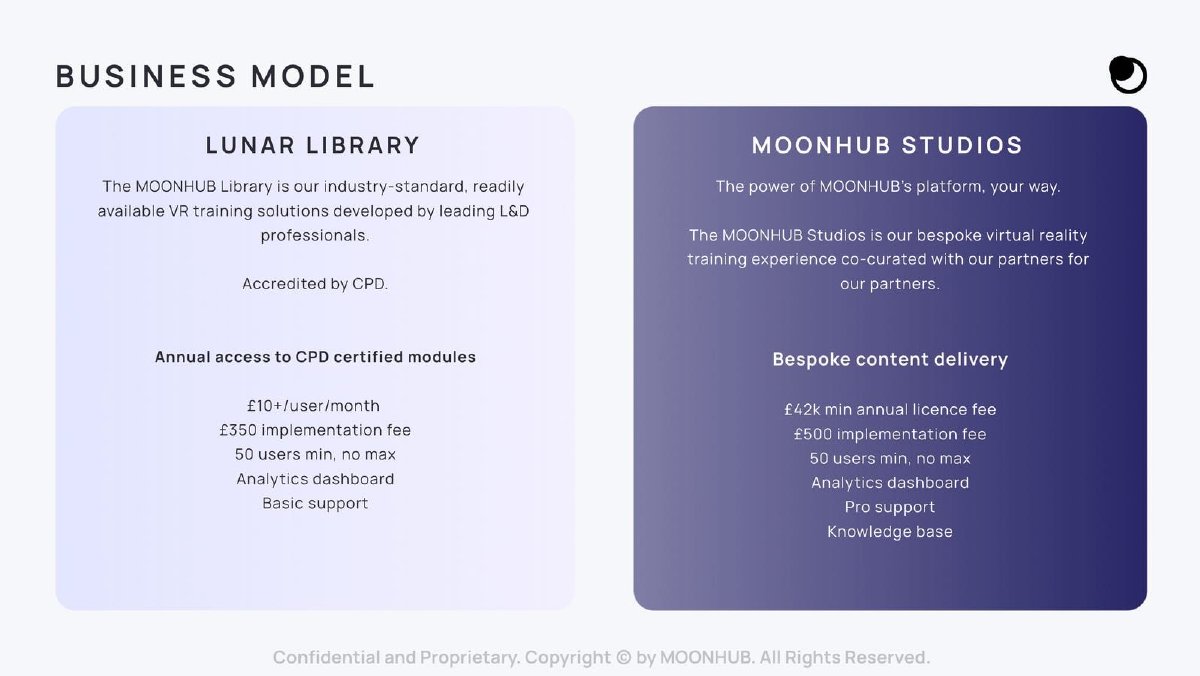
Moonhub, a virtual reality training company, has a business model slide with two products. 'LUNAR LIBRARY', its ready-made courses: 'Annual access to CPD certified modules', '£10+/user/month', '£350 implementation fee', '50 users min, no max', 'Analytics dashboard', 'Basic support'. 'MOONHUB STUDIOS', bespoke content: '£42k min annual licence fee', '£500 implementation fee', '50 users min, no max', 'Analytics dashboard', 'Pro support', 'Knowledge base'.
The minimum Library contract is 50 users at £10 a month, or £6,000 a year, so the £350 fee is about 6% of minimum first-year value. On the Studios side, £500 against a £42,000 minimum licence is about 1.2% (both our calculations). The fees are clearly small, and the slide lets the reader work that out because the minimums are stated beside them. That tells an investor that implementation is not a meaningful revenue line and probably not a hurdle in the sale.
The slide raises one question it doesn't answer. Bespoke content 'co-curated with our partners' sounds like significant work, yet its implementation fee is only £150 more than the ready-made library's. Either the bespoke work is priced into the £42k licence, or the fee doesn't cover the effort. A short line would resolve it: 'Content production included in the Studios licence; implementation fee covers device setup and training only.'
Setup fees inside market size: Optii
Optii, a supply chain planning software company, has a slide titled 'Example Sector Pharma Total Addressable Market'. Text on the left: 'One-off setup fees $96 million' and 'Annual Recurring Revenue $118 million'. Two cylinders show '$96m' (Set-up) and '$118m' (Annual Recuring Revenue). A footnote reads '419 Large and Medium Pharma Companies * set up fees ($xxx-XXXK depending on complexity + 3-15 Licenses depending on size of business @ $XXK per annum per license'. Sources listed top right include IQVIA, Statista and PWC.
The slide does keep the two kinds of money apart, which is better than adding them into one 'market' number. Dividing by the 419 companies gives about $229,000 of setup and $282,000 of annual licence per company (our calculation), so setup is about 81% of one year's recurring value. That tells the reader that, in this model, implementation is a large part of what each customer pays, much larger than at Lunchbox or Moonhub.
The problem is the side-by-side bars. $96M is collected once, when each of the 419 companies signs; $118M is collected every year. Drawn at similar heights, they look like two comparable streams. Over five years the recurring market would be about $590M against the same $96M of setup. The per-client fee and licence price are also redacted in our copy, so the reader can't check the multiplication. A clearer version: 'Recurring: $118M a year (419 companies × [n] licences × $[x]). One-time: $96M total, collected at onboarding.'
What to put on the slide
The fee beside the price. Show the one-time fee in the same table or line as the recurring price and the minimum contract, as Lunchbox and Moonhub do, so the reader can judge its size at a glance.
The ratio. Say what the fee is as a share of first-year contract value. Under about 10% reads as cost recovery; close to or above a year's licence means implementation is a business of its own and should be explained.
What it pays for. Name the work: integration, data migration, configuration, training, hardware installation. Add how long setup takes, labelled clearly.
The separation. Keep one-time fees out of MRR and ARR. Say whether gross margin includes implementation, as Northspyre does, and give the blended figure if the difference is material.
The policy. Say whether you waive the fee for pilots, annual prepay or larger customers, and how often it is actually collected.
The market treatment. If one-off fees appear in market sizing, label them as one-time and don't stack or compare them with annual figures.
Where the fee goes in the deck
On the business model or pricing slide, beside the recurring price. In the financials, as a separate revenue line with its own margin if it is material. In the go-to-market or time-to-value slide, if setup length affects how quickly customers go live.
Keep it consistent. If the business model slide shows a $300 fee and the forecast shows services revenue growing to 30% of total, the reader will ask which picture is right.
Templates
Price line: '$[x] per [unit] per month + one-time setup $[y] ([z]% of first-year value).'
What it covers: 'Setup covers [integration, migration, training]; live in [n] weeks.'
Market sizing: 'Recurring $[x]M a year; one-time setup $[y]M total, collected at onboarding.'
What these examples can and cannot show
These four slides show how founders have presented one-time fees. They can't show whether the fees were collected, waived, profitable or a drag on sales, or how implementation cost compared with the fee. Our ratios use the slides' minimum or stated figures and would change for larger contracts. Optii's per-company averages are our division of its totals by its stated company count; its actual price inputs are redacted. Lunchbox's weeks row is unlabelled and our reading of it as time to go live is an interpretation.
Treat them as patterns. Northspyre separates fees from margin and says so but gives no size. Lunchbox prices the fee against the monthly price. Moonhub shows the fee as small against a stated minimum. Optii keeps one-off and recurring money apart but draws them as if they were comparable.
Common mistakes
Fees in ARR. One-time revenue annualised as if it recurs.
Silent margin. Gross margin with no note on whether implementation is in it.
Unsized fee. A fee with no recurring price or minimum beside it.
No explanation. Nothing on what the fee pays for or how long setup takes.
Stacked market. One-off fees added to or compared with annual market size.
Diagnostic checklist
Fee shown beside the recurring price and minimum.
Fee as a share of first-year value known.
Work covered and setup time stated.
Excluded from ARR; margin treatment stated.
Waiver policy known.
One-time fees labelled in any market sizing.
Frequently asked questions
Should I charge a setup fee at all?
That is a pricing decision, not a deck decision. If you charge one, show it plainly; if you waive it, say so, because investors will ask whether the fee is real.
Can implementation revenue be in my total revenue?
Yes, but report it on its own line and keep it out of ARR and recurring metrics.
How we chose these examples
Corpus: published pitch deck teardowns on StartupFundraising.com. Founder-uploaded private decks are excluded.
Selection (2026-10-01): we searched extracted text for setup, set-up, implementation and onboarding fees, set aside fund, property and listed-company uses, a redacted pricing slide and a deck of uncertain issuer status, and kept four private-company slides each treating a one-time fee differently.
Review: the four slides were rendered from the source decks on 2026-10-01 and read in full at full size against company, deck and slide number (editorial model review, with AI assistance in drafting; not human-reviewed). Ratios and per-company averages were calculated from the slides' stated figures. No figure was checked against outside sources.