Pricing Slide Examples: How Pitch Decks Show What Customers
How real pitch decks explain what the customer pays for: per transaction, per lead, per seat, a flat monthly fee or a price that moves.
Pricing Slide Examples: How Pitch Decks Show What Customers Pay
Eleven pricing slides from real pitch decks, shown in full, compare what each company charges for and whether the slide explains why it chose that unit.
TL;DR
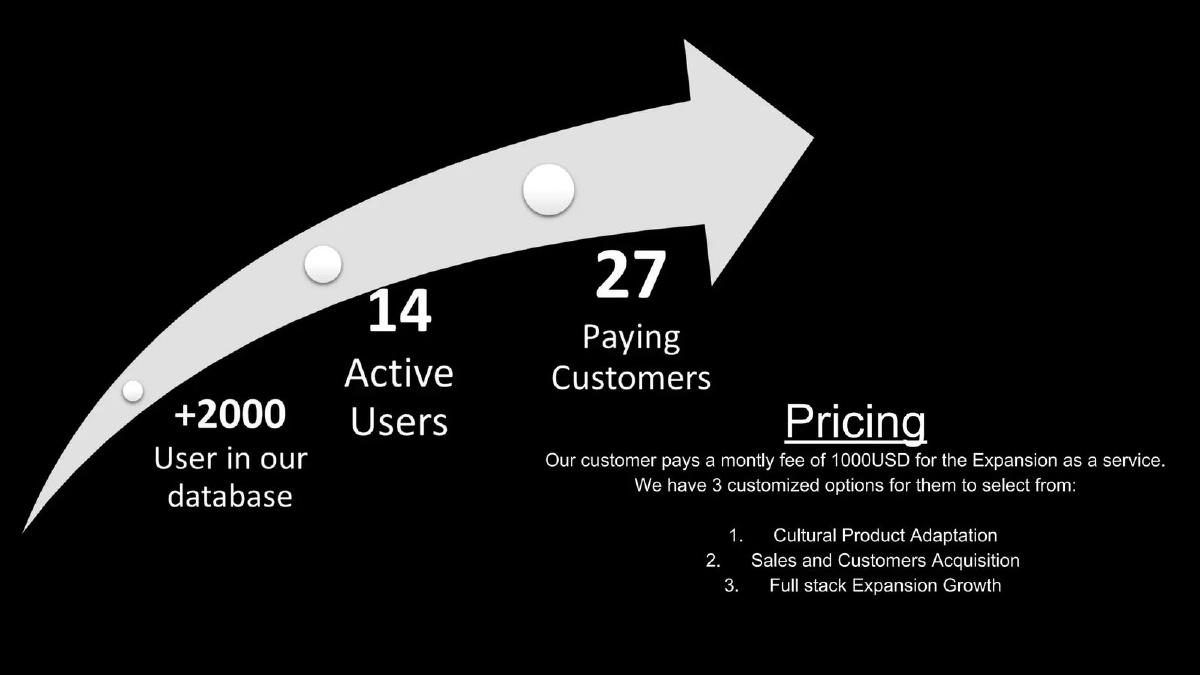
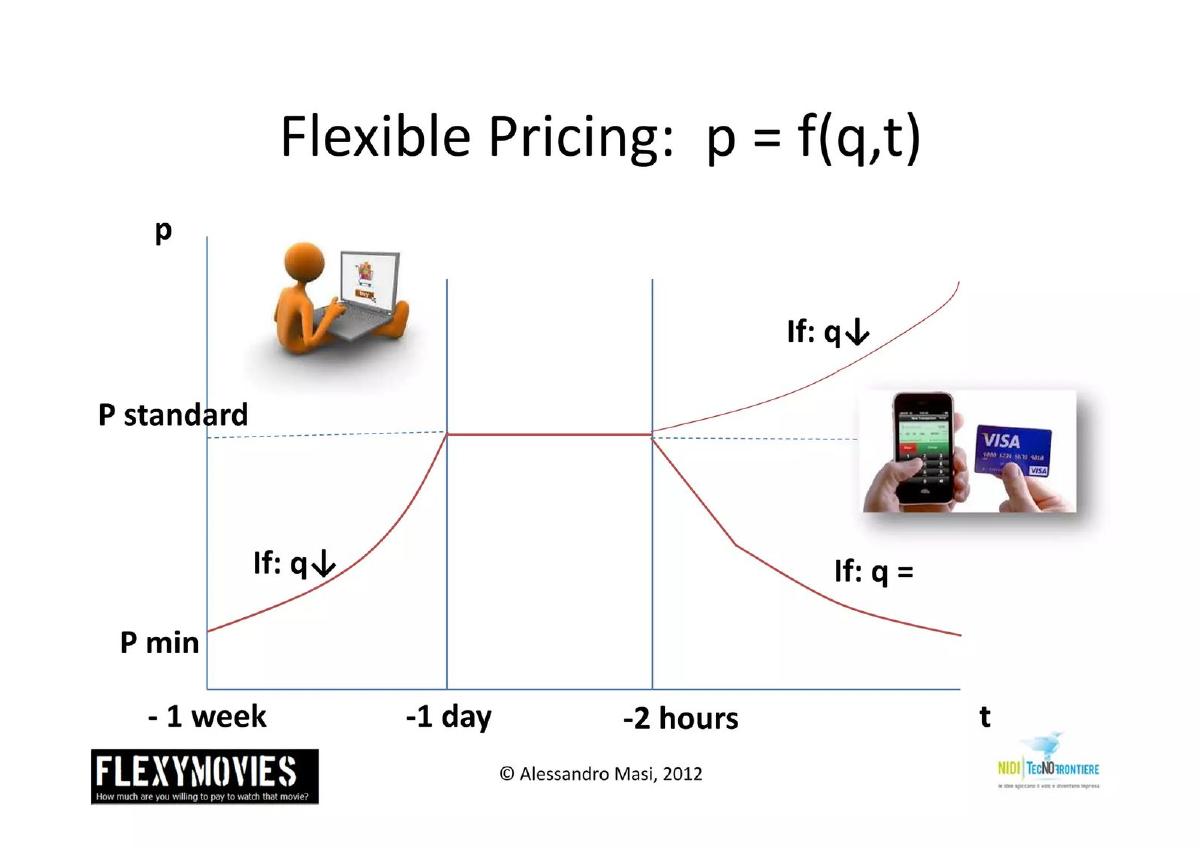
A pricing slide should say what the customer pays for (a transaction, a lead, a seat, a month of service) and why that unit fits the business. Carta (then eShares) is the clearest example here: "We charge $20 per transaction", followed by three stated reasons for choosing transaction pricing, and a second slide saying "everything else is free" to bring companies onto the platform. Bouncehelp charges "$1,99 per lead" and only for leads delivered. Anima puts "$400/year/seat" next to the number of designers and developers it could sell to. Archgroup states a $1,000 monthly fee but lists three options without saying whether they cost different amounts. FlexyMovies draws a price curve but gives no actual prices.
Pricing slides from real pitch decks
Each example shows the exact stored slide above its analysis and links to the full teardown. Prices are as shown in the deck at the time it was made, not current prices. Stage and year are given only where the deck or its record states them.
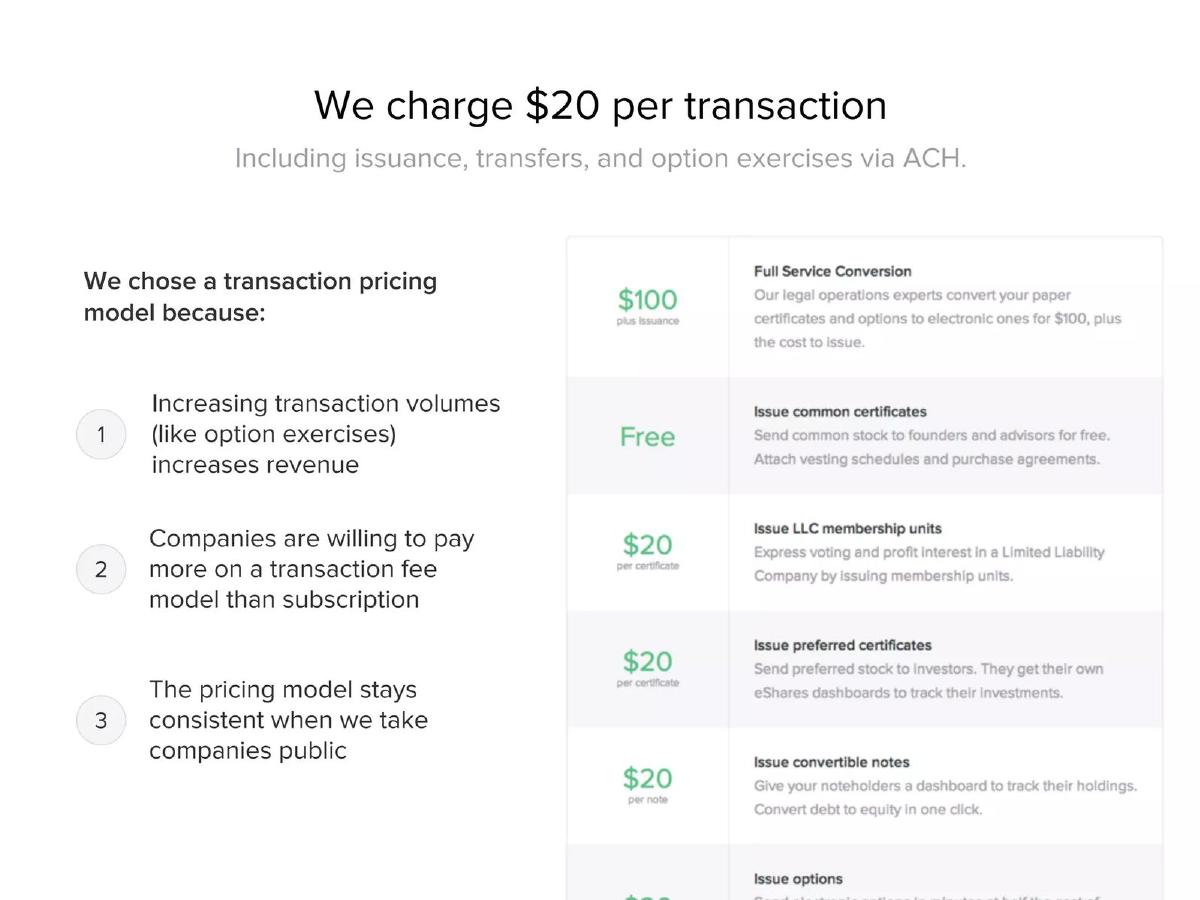
Carta (then eShares) business model slide — slide 9
Cap table software and electronic share issuance. 2015 Series A deck (41 pages); the round raised about $6.8M. Pages 9 and 10 are shown together because they make one argument.
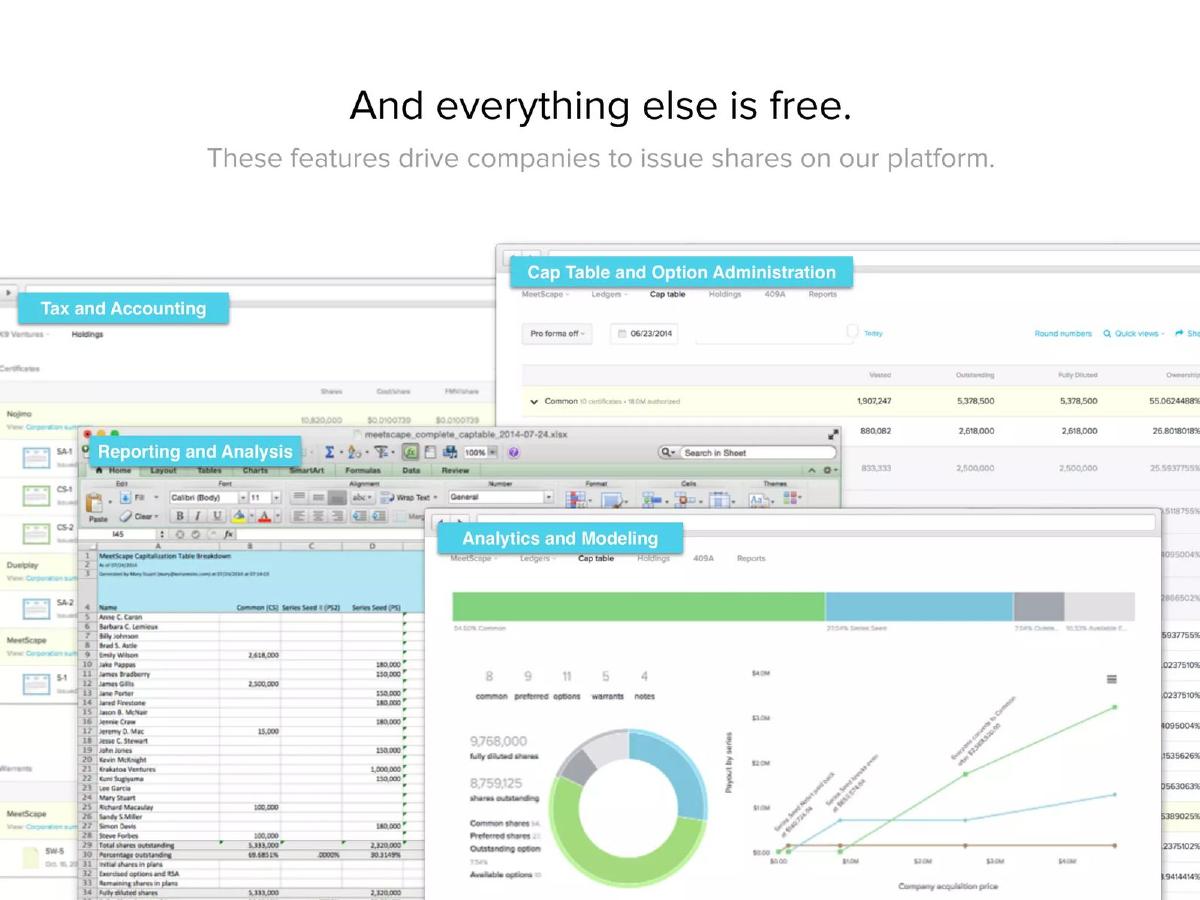
Carta deck, slide 9. Exact stored slide matched to this analysis.Carta deck, slide 10. Exact stored slide matched to this analysis.
Our analysis: It is the only slide here that explains why it chose its pricing unit, and each reason links price to growth: more option exercises mean more revenue, and the same price still works after a company goes public. Page 10 explains what the free product is for.
Evidence and limitation: Reason 2 (companies pay more per transaction than by subscription) is stated, not shown. Back a claim like this with what customers actually pay per year, and add what each transaction costs you to deliver.
What a founder can adapt: State your unit, then give one or two reasons it fits how your customers grow. If some of the product is free, say what the free part leads to.
Supporting analysis
What the deck claims: Page 9: "We charge $20 per transaction. Including issuance, transfers, and option exercises via ACH." "We chose a transaction pricing model because: 1. Increasing transaction volumes (like option exercises) increases revenue. 2. Companies are willing to pay more on a transaction fee model than subscription. 3. The pricing model stays consistent when we take companies public." Price list: Full Service Conversion $100 plus issuance; issue common certificates Free; LLC membership units, preferred certificates and convertible notes $20 each. Page 10: "And everything else is free. These features drive companies to issue shares on our platform."
Presentation choice: It is the only slide here that explains why it chose its pricing unit, and each reason links price to growth: more option exercises mean more revenue, and the same price still works after a company goes public. Page 10 explains what the free product is for.
When it does not fit: Reason 2 (companies pay more per transaction than by subscription) is stated, not shown. Back a claim like this with what customers actually pay per year, and add what each transaction costs you to deliver.
Lead generation for sales teams. 8-slide deck; stage and year not stated.
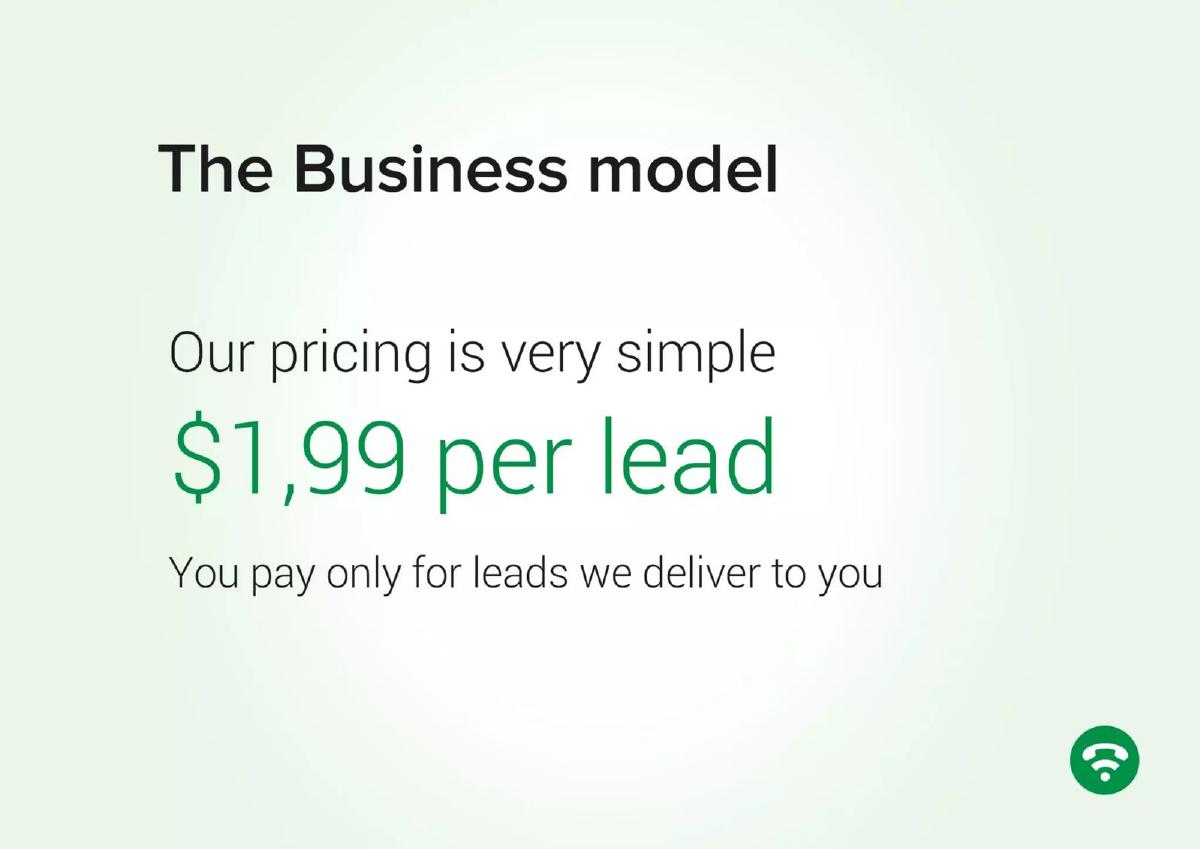
Bouncehelp deck, slide 4. Exact stored slide matched to this analysis.
Our analysis: The unit is the result the customer wants, and "only for leads we deliver" removes the buyer's risk. An investor can see at once that revenue depends on lead volume.
Evidence and limitation: The slide doesn't say what counts as a lead, what a lead costs Bouncehelp to produce, or how many leads a typical customer buys. Without cost per lead, the margin is unknown.
What a founder can adapt: If you can charge for the outcome, say so in one line and state the price per outcome.
Supporting analysis
What the deck claims: "The Business model. Our pricing is very simple. $1,99 per lead. You pay only for leads we deliver to you."
Presentation choice: The unit is the result the customer wants, and "only for leads we deliver" removes the buyer's risk. An investor can see at once that revenue depends on lead volume.
When it does not fit: The slide doesn't say what counts as a lead, what a lead costs Bouncehelp to produce, or how many leads a typical customer buys. Without cost per lead, the margin is unknown.
Design-to-code software. 2017 deck, 11 slides; the company's record lists $12.6M raised. The bottom-up market sizing guide uses this same slide for its market arithmetic; here it is used only for the choice of pricing unit.
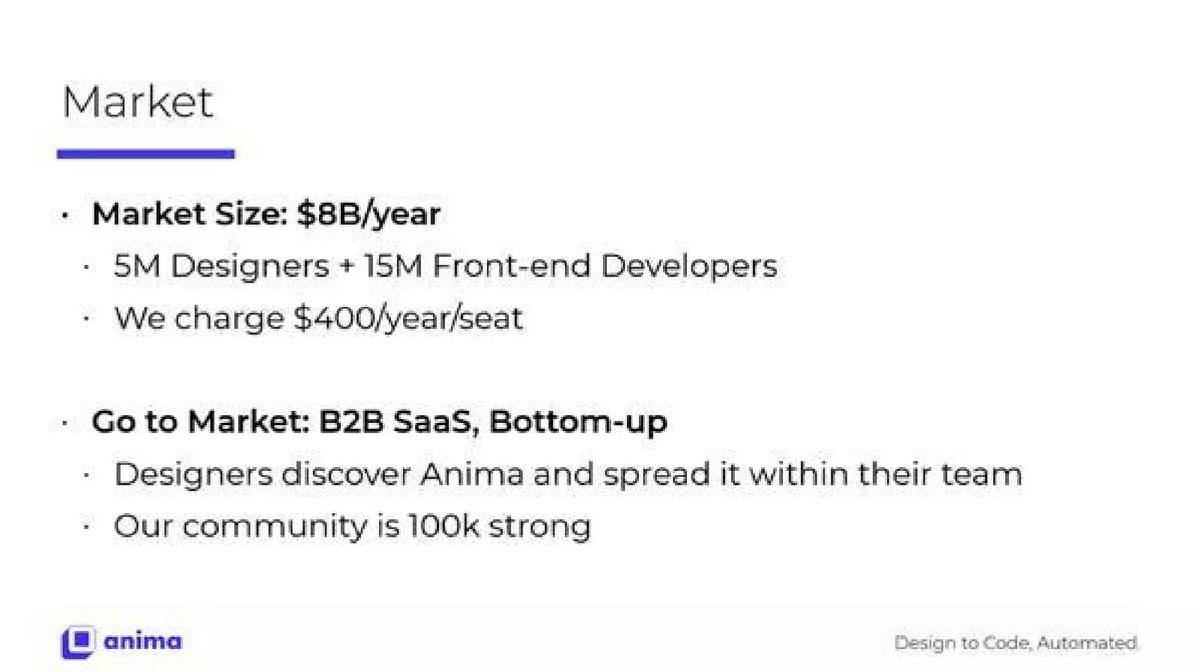
Anima deck, slide 5. Exact stored slide matched to this analysis.
Our analysis: The per-seat price is the link between the market size and the sales approach: each designer or developer is a seat, and the product spreads within a team one seat at a time. The figures check: 20M × $400 = $8B.
Evidence and limitation: Not every designer or developer will pay. Add paying seats today or seats per paying team, so the $8B isn't read as reachable revenue.
What a founder can adapt: If you price per user, put the price next to the number of users you could sell to and how new users arrive.
Supporting analysis
What the deck claims: "Market Size: $8B/year. 5M Designers + 15M Front-end Developers. We charge $400/year/seat." "Go to Market: B2B SaaS, Bottom-up. Designers discover Anima and spread it within their team. Our community is 100k strong."
Presentation choice: The per-seat price is the link between the market size and the sales approach: each designer or developer is a seat, and the product spreads within a team one seat at a time. The figures check: 20M × $400 = $8B.
When it does not fit: Not every designer or developer will pay. Add paying seats today or seats per paying team, so the $8B isn't read as reachable revenue.
"Expansion as a service" for companies entering new markets. 10-slide deck; stage and year not stated.
Archgroup deck, slide 5. Exact stored slide matched to this analysis.
Our analysis: A flat monthly fee is easy to model, and the slide puts it next to its customer count.
Evidence and limitation: Three options with different scope appear to share one price; the slide doesn't say. "27 paying" is shown as larger than "14 active", which needs explaining. Give each option its price and define the customer counts.
What a founder can adapt: If you charge a flat fee, state it plainly and put it next to paying customers so revenue can be estimated.
Supporting analysis
What the deck claims: "Pricing: Our customer pays a montly fee of 1000USD for the Expansion as a service. We have 3 customized options for them to select from: 1. Cultural Product Adaptation 2. Sales and Customers Acquisition 3. Full stack Expansion Growth." Beside it: "+2000 User in our database", "14 Active Users", "27 Paying Customers".
Presentation choice: A flat monthly fee is easy to model, and the slide puts it next to its customer count.
When it does not fit: Three options with different scope appear to share one price; the slide doesn't say. "27 paying" is shown as larger than "14 active", which needs explaining. Give each option its price and define the customer counts.
FlexyMovies deck, slide 4. Exact stored slide matched to this analysis.
Our analysis: It shows a pricing rule, not just a price, and makes clear the price depends on seats left and time before the film.
Evidence and limitation: There are no figures on the axes, so an investor can't tell the price range or the average ticket. Label P min and P standard with real prices, and say who sets the curve (the cinema or you) and what you earn per ticket.
What a founder can adapt: If your price changes, show the rule in one simple chart.
Supporting analysis
What the deck claims: "Flexible Pricing: p = f(q,t)". A chart of ticket price against time before the showing (−1 week, −1 day, −2 hours): price rises from "P min" to "P standard" in the last week, holds until two hours before, then either rises ("If: q↓", seats running out) or falls ("If: q =", seats unsold).
Presentation choice: It shows a pricing rule, not just a price, and makes clear the price depends on seats left and time before the film.
When it does not fit: There are no figures on the axes, so an investor can't tell the price range or the average ticket. Label P min and P standard with real prices, and say who sets the curve (the cinema or you) and what you earn per ticket.
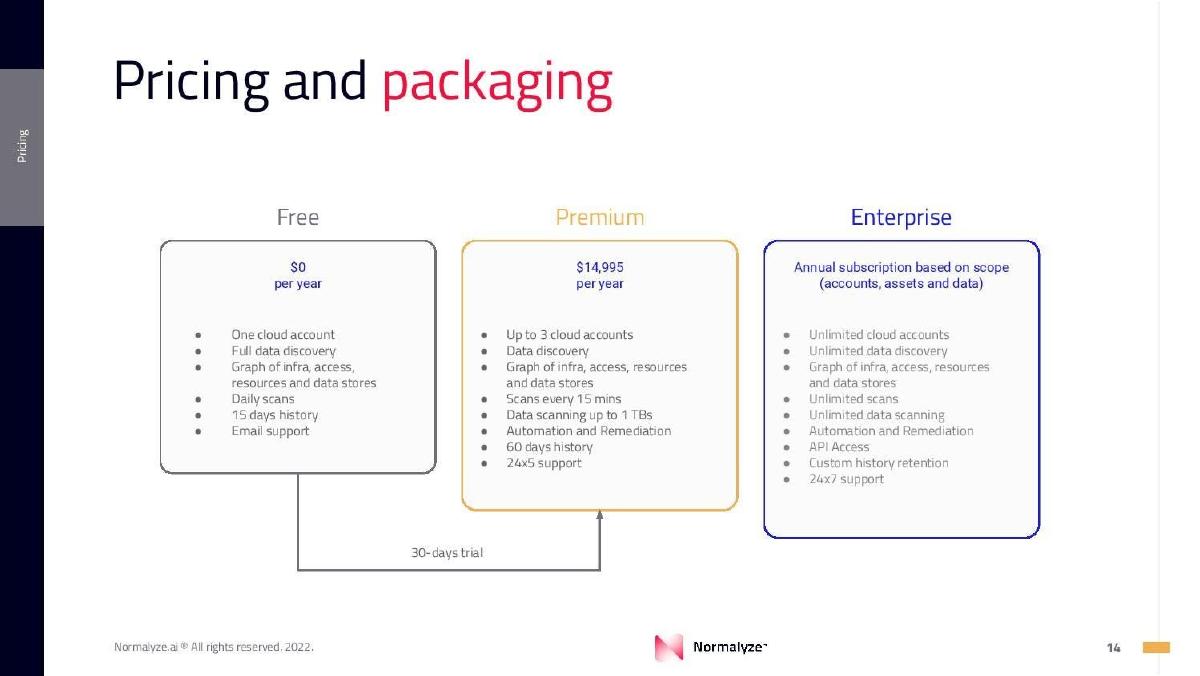
Data security software for cloud accounts. Footer dated 2022.
Normalyze deck, slide 14. Exact stored slide matched to this analysis.
Our analysis: The tiers differ on things the buyer can measure (accounts, scan frequency, data volume), and the trial arrow shows how free users are meant to convert.
Evidence and limitation: Leaving the enterprise tier, usually the largest revenue source, without any figure.
What a founder can adapt: Show how many free users have converted to Premium, and a typical enterprise contract size.
Supporting analysis
What the deck claims: "Pricing and packaging." Free: "$0 per year", one cloud account, daily scans, 15 days history, email support. Premium: "$14,995 per year", up to 3 cloud accounts, scans every 15 minutes, data scanning up to 1 TB, automation and remediation, 60 days history, 24x5 support. Enterprise: "Annual subscription based on scope (accounts, assets and data)", unlimited accounts and scanning, API access, 24x7 support. An arrow marked "30-days trial" runs from Free to Premium.
Presentation choice: The tiers differ on things the buyer can measure (accounts, scan frequency, data volume), and the trial arrow shows how free users are meant to convert.
When it does not fit: Leaving the enterprise tier, usually the largest revenue source, without any figure.
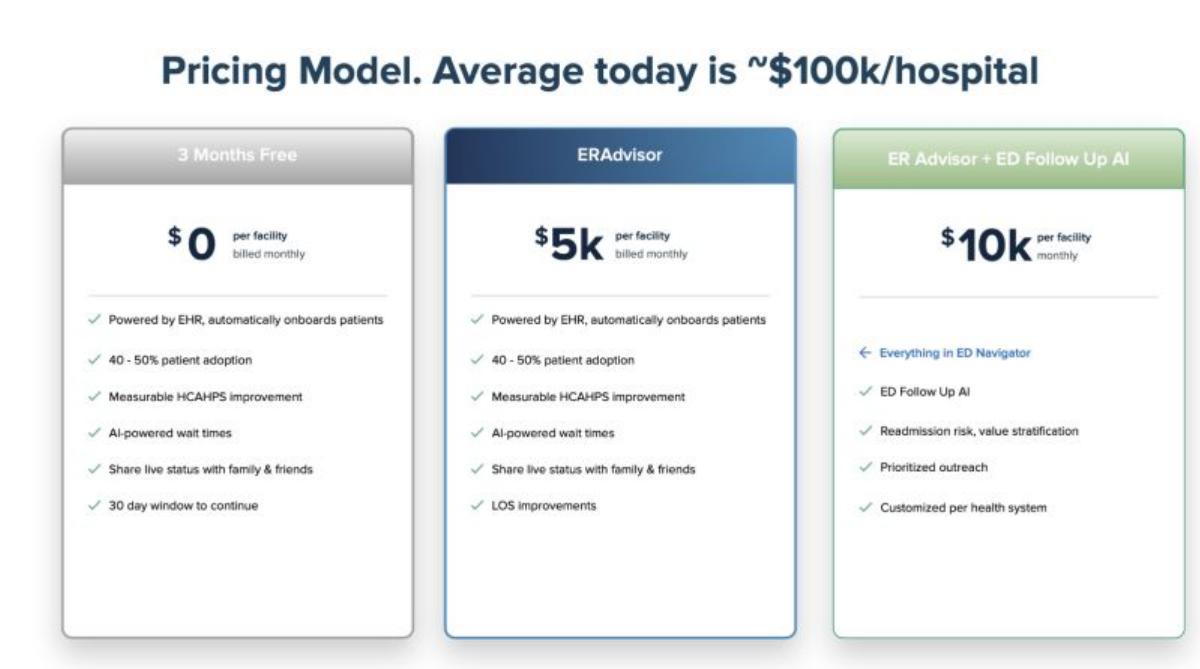
Patient experience software for hospital emergency departments.
Vital deck, slide 17. Exact stored slide matched to this analysis.
Our analysis: It puts a claimed average customer value next to the list prices, so the reader can check one against the other.
Evidence and limitation: Listing outcomes such as "40 - 50% patient adoption" as tier features without saying where they were measured.
What a founder can adapt: Say how many hospitals the ~$100k average covers and how many facilities a typical hospital has.
Supporting analysis
What the deck claims: "Pricing Model. Average today is ~$100k/hospital." "3 Months Free": "$0 per facility billed monthly". ERAdvisor: "$5k per facility billed monthly". ER Advisor + ED Follow Up AI: "$10k per facility monthly". Features listed include "40 - 50% patient adoption" and "Measurable HCAHPS improvement".
Presentation choice: It puts a claimed average customer value next to the list prices, so the reader can check one against the other.
When it does not fit: Listing outcomes such as "40 - 50% patient adoption" as tier features without saying where they were measured.
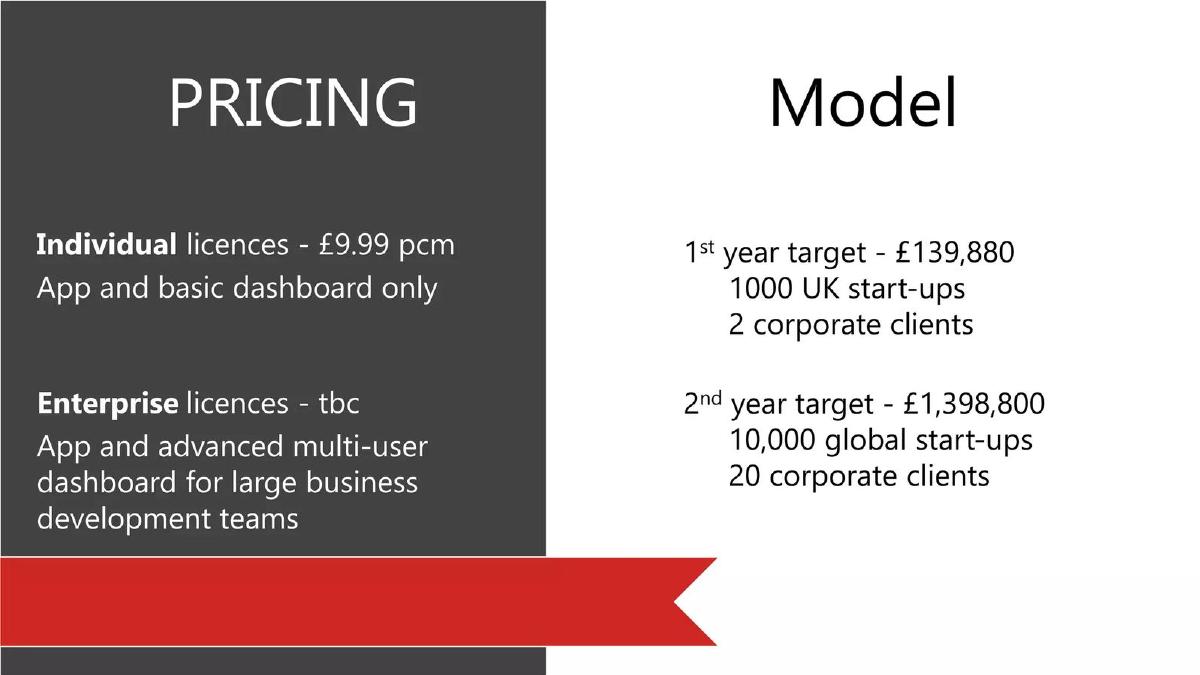
App and dashboard for startup business development. October 2018 deck.
Mimir deck, slide 8. Exact stored slide matched to this analysis.
Our analysis: Price and revenue plan sit side by side, so the targets can be rebuilt from the inputs.
Evidence and limitation: Marking a price "tbc" while building revenue targets that depend on it.
What a founder can adapt: Write down the enterprise price your targets already assume (our calculation: about £10,000 a year each).
Supporting analysis
What the deck claims: "Pricing" / "Model." "Individual licences - £9.99 pcm. App and basic dashboard only." "Enterprise licences - tbc. App and advanced multi-user dashboard for large business development teams." "1st year target - £139,880: 1000 UK start-ups, 2 corporate clients." "2nd year target - £1,398,800: 10,000 global start-ups, 20 corporate clients."
Presentation choice: Price and revenue plan sit side by side, so the targets can be rebuilt from the inputs.
When it does not fit: Marking a price "tbc" while building revenue targets that depend on it.
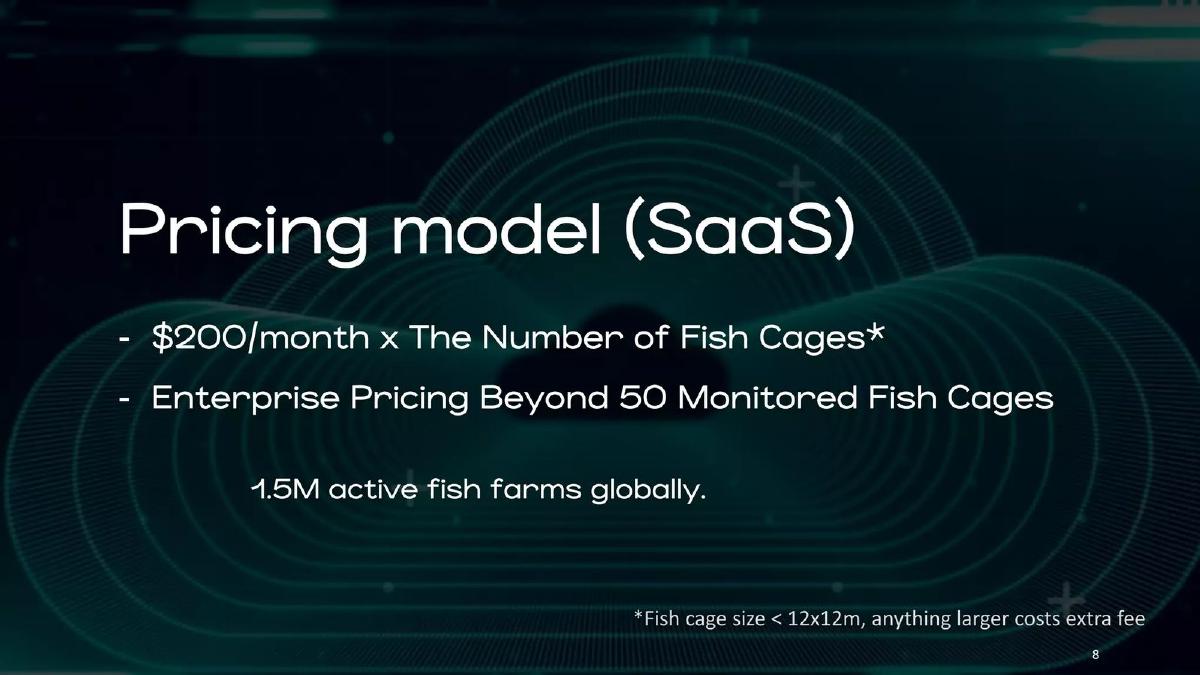
Monitoring software for fish farms. The AI solution and food product guides use other slides from this deck.
Nereus deck, slide 8. Exact stored slide matched to this analysis.
Our analysis: The unit (fish cages) is something every farm already counts, and the footnote closes the obvious loophole of one oversized cage.
Evidence and limitation: Putting a global farm count beside a per-cage price when the two can't be multiplied.
What a founder can adapt: Add the typical number of cages per farm so the price can be turned into revenue per customer.
Supporting analysis
What the deck claims: "Pricing model (SaaS)." "$200/month x The Number of Fish Cages*." "Enterprise Pricing Beyond 50 Monitored Fish Cages." "1.5M active fish farms globally." Footnote: "*Fish cage size < 12x12m, anything larger costs extra fee."
Presentation choice: The unit (fish cages) is something every farm already counts, and the footnote closes the obvious loophole of one oversized cage.
When it does not fit: Putting a global farm count beside a per-cage price when the two can't be multiplied.
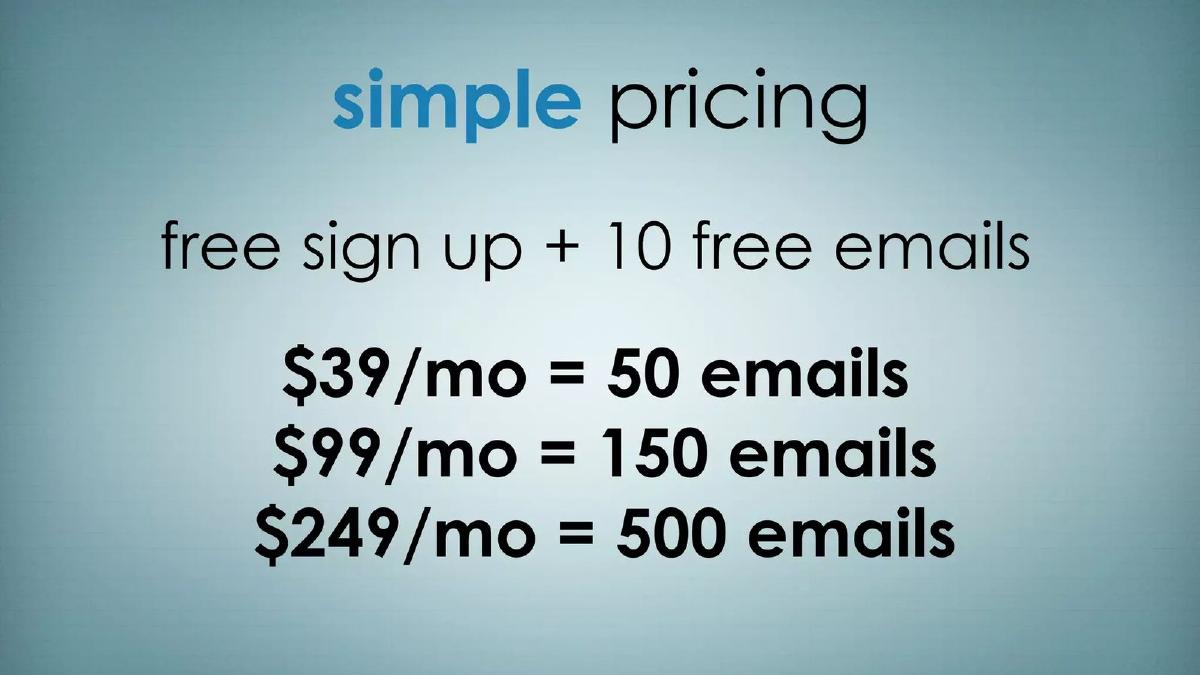
Contact Us Plus deck, slide 10. Exact stored slide matched to this analysis.
Our analysis: Three prices and three volumes on one slide: a reader can see the plans in seconds. Our calculation: about $0.78, $0.66 and $0.50 per email.
Evidence and limitation: Volume tiers without saying which tier most customers choose.
What a founder can adapt: Say what one "email" covers in the product and how many a typical customer sends a month.
Supporting analysis
What the deck claims: "simple pricing." "free sign up + 10 free emails." "$39/mo = 50 emails." "$99/mo = 150 emails." "$249/mo = 500 emails."
Presentation choice: Three prices and three volumes on one slide: a reader can see the plans in seconds. Our calculation: about $0.78, $0.66 and $0.50 per email.
When it does not fit: Volume tiers without saying which tier most customers choose.
The unit, the price and the reason together tell an investor what has to grow for revenue to grow.
Example
Unit charged
Price shown
Reason for the unit given
Free part explained
Carta
Transaction
$20; $100 conversion
Yes (three reasons)
Yes
Bouncehelp
Delivered lead
$1.99
Partly (pay only on delivery)
No free part
Anima
Seat per year
$400
Implied by bottom-up sales
Not stated
Archgroup
Month of service
$1,000
No
Not stated
FlexyMovies
Ticket, varying price
No figures
Shows the rule, not why
Not stated
Key Takeaways
Name the unit you charge for. A transaction, a lead and a seat each tell an investor what has to grow for revenue to grow.
Say why you picked that unit. Carta gives three reasons; the other four slides give none.
Say what's free as clearly as what's paid. Carta's free features exist to drive the paid ones.
If you offer options, give each one a price. Archgroup's three options sit under a single fee.
A pricing rule needs real numbers. FlexyMovies' curve has no minimum, standard or maximum price.
Build your pricing slide
Fill in each line before designing the slide.
Unit. What exactly does the customer pay for: a transaction, a result, a seat, a month?
Price. What is the price per unit, and does it differ by option?
Why this unit. Why does this unit fit how your customers grow?
Free part. What is free, and what does it lead customers to pay for?
Link to traction. Does your traction slide count the same unit you charge for?
Copyable framework: We charge [price] per [unit]. We chose [unit] because [reason linked to customer growth]. [Free part] is free because it leads customers to [paid action].
Illustrative example 1 — written by us
Before: Our pricing is very simple. $1,99 per lead.
After: $1.99 per qualified lead, where a lead is [definition]; customers pay only for leads delivered. A typical customer buys [number] leads a month.
What improved: Our illustrative rewrite, not Bouncehelp's text. Bracketed parts are placeholders, not company facts. It adds the lead definition and typical volume.
What this guide adds to the business model guides
The main business model guide covers every way startups make money, and the SaaS business model guide covers how subscription prices and tiers are shown. This guide is about one decision that sits underneath both: which unit the customer pays for, and whether the slide explains that choice. The unit matters because it links pricing to traction. If you charge per transaction, investors will look for transaction volume on the traction slide. If you charge per seat, they will look for seats.
Tier tables: show what moves a customer up
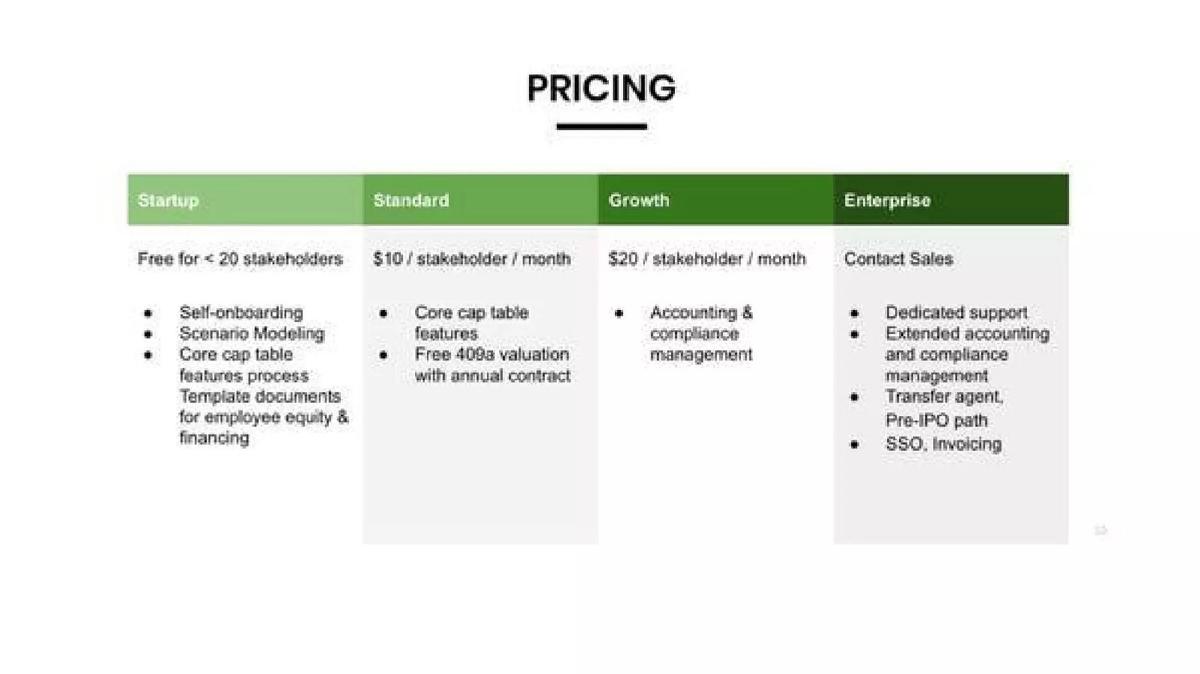
Three of the new slides use a tier table. Pulley offers Startup ("Free for < 20 stakeholders"), Standard ("$10 / stakeholder / month"), Growth ("$20 / stakeholder / month") and Enterprise ("Contact Sales"). Normalyze offers Free ("$0 per year", one cloud account), Premium ("$14,995 per year", up to three cloud accounts and 1 TB of scanning) and Enterprise ("Annual subscription based on scope (accounts, assets and data)"), with an arrow labelled "30-days trial" from Free to Premium. Vital offers "3 Months Free", ERAdvisor at "$5k per facility billed monthly" and ER Advisor plus ED Follow Up AI at "$10k per facility monthly".
The useful tables make the upgrade trigger visible. Pulley's is the number of stakeholders on the cap table: a company crosses 20 and starts paying, and the price grows as it adds employees and investors. Normalyze's is the number of cloud accounts and the amount of data scanned. Both triggers grow with the customer, which is what an investor wants to see.
What the tables leave out is how customers are actually spread across the tiers. A free tier with thousands of users and a handful of paying accounts is a very different business from one where most users pay. Vital is the only one of the three to put a real-world figure next to its list prices: "Average today is ~$100k/hospital."
Check list prices against what you say customers pay
Vital's list prices let a reader test its headline. Our calculation: $5k a month is $60k a year per facility, and $10k a month is $120k a year. An average of about $100k per hospital sits between the two, which fits a mix of tiers or hospitals with more than one facility. The slide doesn't say which, or how many hospitals the average covers. It reads as a claim about current customers, so an investor will ask for the count.
Mimir's slide puts the price and the plan on the same page: "Individual licences - £9.99 pcm" and "Enterprise licences - tbc", then "1st year target - £139,880" from "1000 UK start-ups" and "2 corporate clients", and "2nd year target - £1,398,800" from 10,000 global start-ups and 20 corporate clients. Our calculation: 1,000 × £9.99 × 12 = £119,880, leaving £20,000 for two corporate clients, about £10,000 each. Year two is the same sum times ten. So the plan quietly assumes an enterprise price of about £10,000 a year, even though the slide calls that price "tbc". Writing the assumed price down would make the target easier to trust.
Both slides teach the same lesson: if a reader can multiply your prices by your customer numbers, do the multiplication yourself and show it. If the result doesn't match your headline, explain the gap before an investor finds it.
Usage pricing: name the unit and the cap
Nereus charges "$200/month x The Number of Fish Cages", with "Enterprise Pricing Beyond 50 Monitored Fish Cages" and a footnote: "Fish cage size < 12x12m, anything larger costs extra fee." Contact Us Plus offers "free sign up + 10 free emails", then "$39/mo = 50 emails", "$99/mo = 150 emails" and "$249/mo = 500 emails".
Nereus's unit is the strongest kind: it is a physical thing the customer already counts, it grows with the farm, and the footnote closes the obvious loophole (one giant cage). Our calculation: a farm with 50 cages, the largest size before enterprise pricing, would pay $10,000 a month, or $120,000 a year. The "1.5M active fish farms globally" line on the same slide is market context with no source and no count of cages per farm, so it can't be multiplied by the price.
Contact Us Plus shows the price per email falling as volume rises. Our calculation: $0.78 per email on the $39 plan, $0.66 on the $99 plan and about $0.50 on the $249 plan. That is a clear volume discount, but the slide doesn't say what an "email" is in this product or how many a typical customer sends, so a reader can't tell which plan most customers would need.
What investors check on a pricing slide
Is the unit something the customer already counts? Stakeholders, cloud accounts, facilities, fish cages and emails all pass. A unit the customer has to learn makes the price harder to accept.
Does the price grow as the customer grows? Per-stakeholder and per-cage pricing do; a flat fee does not.
Is there a real price at the top? "Contact Sales" and "tbc" are common for enterprise tiers, but a typical contract size or an assumed price, as Mimir's arithmetic reveals, helps an investor model revenue.
Are list prices tied to what customers actually pay? Vital's average per hospital is the only figure of that kind among the new slides. Without it, a tier table shows what the company hopes to charge, not what it earns.
Common mistakes
No unit. Say what the customer pays for, not only how much.
No reason. One line on why the unit fits your customers is enough.
One price, several options. Give each option its price, or say they cost the same.
A rule without numbers. Label a pricing curve with real prices.
Unit doesn't match traction. Count the same unit on the traction slide.
Diagnostic checklist
The unit the customer pays for is named.
The price per unit is shown.
There is a reason for choosing this unit.
Any free part is explained.
The traction slide counts the same unit.
Frequently asked questions
How we chose these examples
Corpus: published pitch deck teardowns on StartupFundraising.com. Founder-uploaded private decks are excluded.
Selection (2026-09-28): we searched extracted slide text for pricing language ("pricing" at the start of a slide, and prices per month, seat, user, lead or transaction). Update (2026-10-01): a second search for pricing slides with prices added Pulley p10, Normalyze p14, Vital p17, Mimir p8, Nereus p8 and Contact Us Plus p10; each image was rendered from the original deck file and viewed. Arithmetic marked as our calculation is ours. Candidates inspected: Archgroup, Bouncehelp, FlexyMovies, CulturePulse, Marshmallow, Carta, Anima, Akmazio and CalYoga. Excluded: Akmazio p6 and CulturePulse p4 (the SaaS business model guide uses them for the same lesson), CalYoga p5 (an introductory offer, a marketing tactic), and Marshmallow p5 (describes how it prices insurance risk, not what customers pay).
Carta: the teardown text calls these slides 5 and 6, but they are pages 9 and 10 of the 41-page PDF. The images were rendered from the original public PDF and matched to those pages.
Overlap check: the main business model guide covers all revenue models; the SaaS business model guide covers subscription prices and tiers; the marketplace guide covers commissions. Anima p5 also appears in the bottom-up market sizing guide, for its market arithmetic; this guide uses it only for the pricing unit.
Review: the original six slide images were inspected on 2026-09-28 and the six new ones on 2026-10-01, each matched to company, deck and page number (editorial model review). No person has yet completed an editorial review of this page.
Prices are as shown on the slides. We make no claim that any slide caused a fundraising outcome.