The 2015 eShares (Carta) Series A deck is a masterclass in demonstrating product-market fit through aggressive growth and clear competitive differentiation. Raising $6.8M on the premise of moving from a 'private company service' to a 'public market infrastructure,' the deck highlights a 40% month-over-month revenue growth rate achieved with zero sales staff. By positioning themselves against legacy incumbents like Solium and Computershare, Carta argued that the digitization of the stock certificate was merely the entry point into a much larger financial ecosystem. The deck successfully balanc…
Key takeaways
- The company reported growing revenue at 40% month-over-month as of August 2014 (Slide 7).
- Carta operated with zero sales people at the time of the Series A, relying on organic growth and law firm referrals (Slide 11).
- The business model utilized a transaction-based pricing strategy, charging $20 per certificate issuance or note (Slide 5).
- The deck identifies a 'sweet spot' for customers as companies in Series A through Series D stages (Slide 9).
- A core competitive advantage cited is the failure of competitors like Solium to provide a product ready for private companies (Slide 10).
- The 'Ownership Map' in the appendix visualizes the network effects of funds and companies as nodes and investments as edges (Slide 14).
- The fundraising ask was specifically $6M-$8M to 'converge the private market' (Slide 12).
- The deck explicitly lists 'Systemic market downturn in tech' as a primary risk factor (Slide 15).
Introduction: The Digitization of Ownership
In 2015, the company then known as eShares (now Carta) set out to raise its Series A. At the time, cap table management was a fragmented, paper-heavy process managed by law firms and legacy software providers. This 41-slide deck (of which 21 key slides are analyzed here) served as the catalyst for a $6.8M round. It is a document that prioritizes transparency, traction, and a clear-eyed view of the competitive landscape.
The Vision and Product (Slides 1-4)
Slide 1 is a minimalist title slide featuring the original eShares logo—a padlock combined with a pie chart, symbolizing secure ownership. It establishes the deck as the 'Series A Investor Deck.'
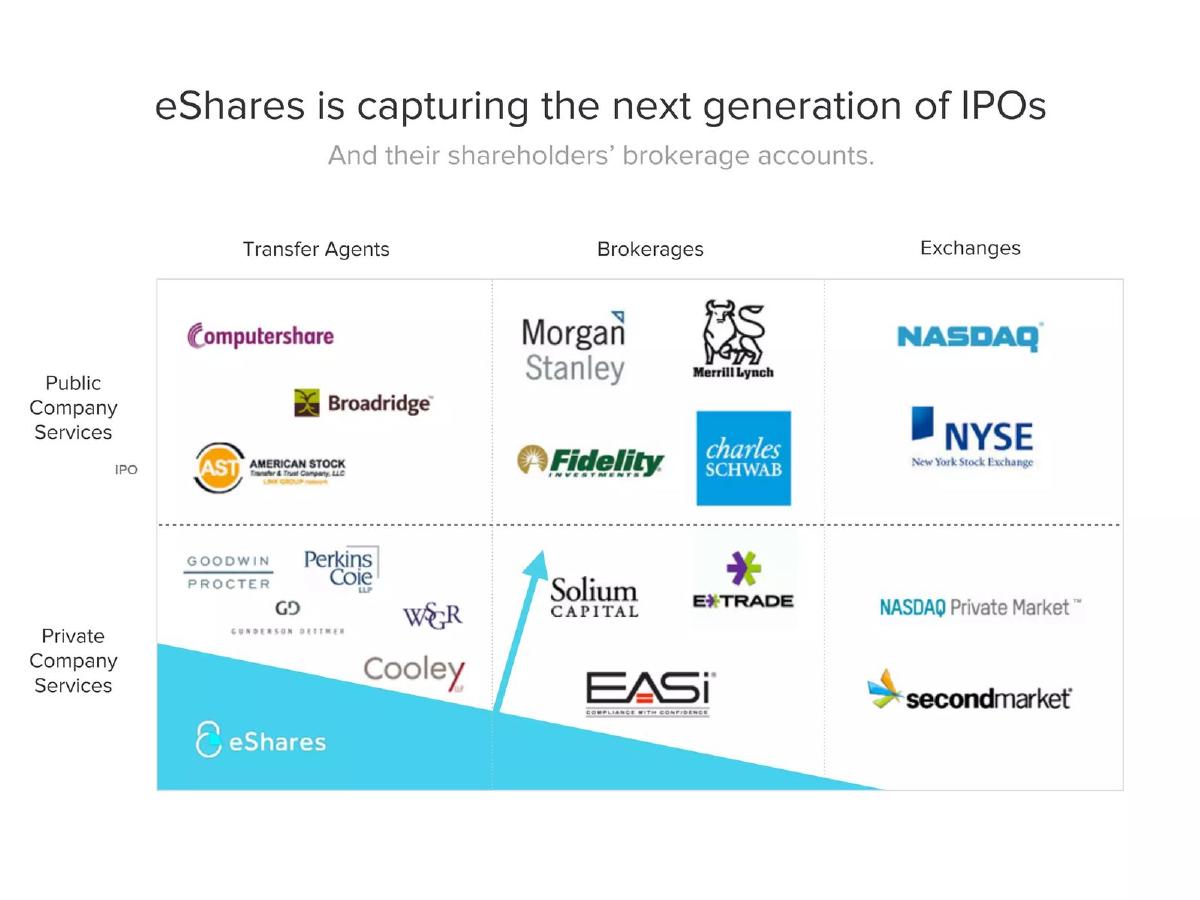
Slide 2 immediately frames the company's ambition. It positions eShares at the bottom of a quadrant, moving upward from 'Private Company Services' toward 'Public Company Services.' The slide claims eShares is 'capturing the next generation of IPOs' and their shareholders' brokerage accounts. This is a crucial framing: they aren't just a startup tool; they are a future competitor to NASDAQ and the NYSE.
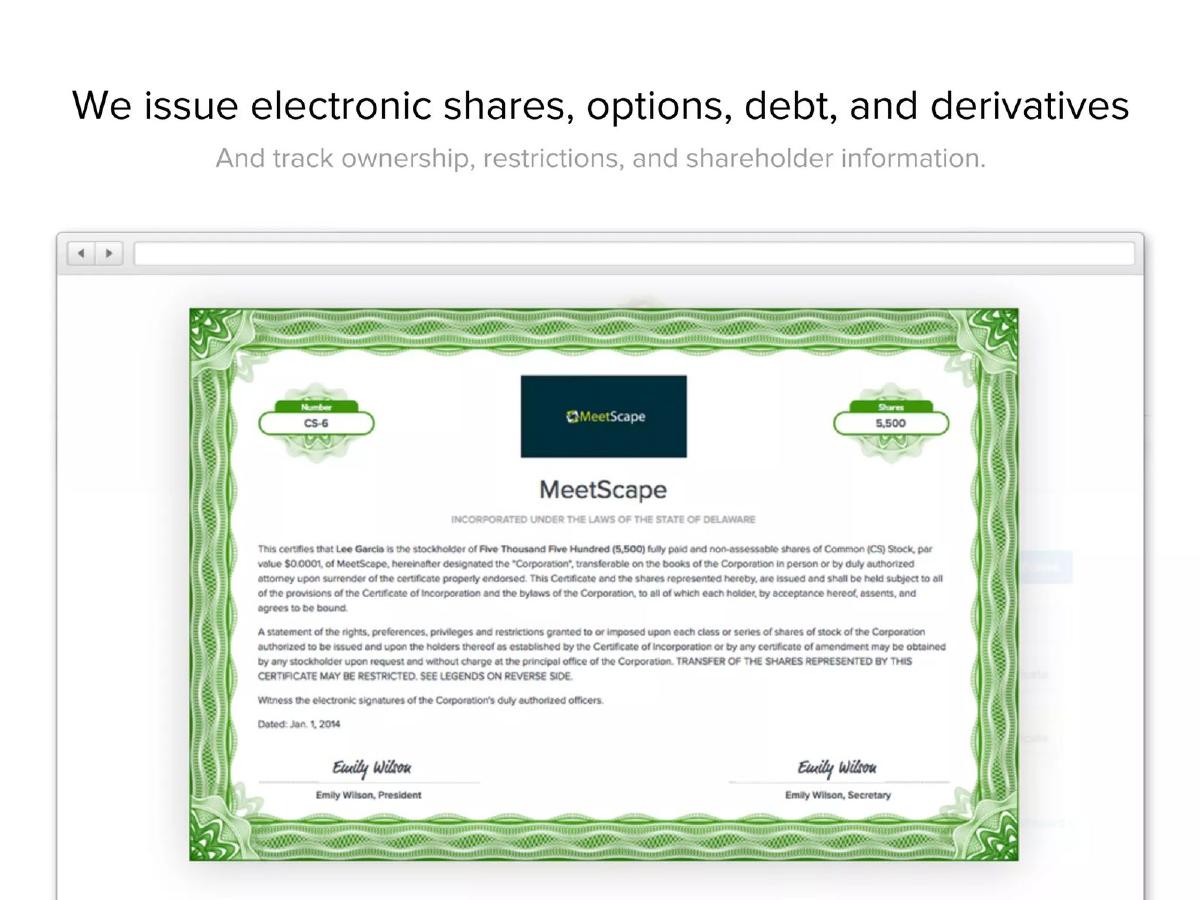
Slide 3 and Slide 4 focus on the core product. Slide 3 shows a digital version of a traditional green-bordered stock certificate for a fictional company, 'MeetScape.' The headline states they issue 'electronic shares, options, debt, and derivatives.' Slide 4 showcases the user interface for 'Cap Tables' and 'Portfolios,' emphasizing the ability to track the shareholder registry and individual holdings in a clean, SaaS-native environment.
The Business Model (Slides 5-6)
Slide 5 breaks down the pricing strategy, which was unconventional for SaaS at the time. They charge '$20 per transaction.' The slide lists three reasons for this: increasing transaction volumes (like option exercises) drive revenue, companies prefer transaction fees over subscriptions, and the model remains consistent when companies go public. Specific prices listed include $100 for 'Full Service Conversion' and $20 for issuing LLC units, preferred certificates, or convertible notes. Common certificates for founders are listed as 'Free.'
Slide 6 introduces 'add-on services.' This is where the company began to expand its Average Revenue Per User (ARPU). They list 409A Compliance-as-a-Service at $159/month, FAS123R accounting at $500/year, and SPV Formation at $25,000/fund. This slide demonstrates that the cap table is the 'hook' for more lucrative financial services.
Traction and Social Proof (Slides 7-9)
Slide 7 is the 'money slide.' It shows a bar chart of revenue growth from January to August. Total revenue grew from $820 in Jan to an estimated $71,532 in August. The headline boldly states: 'We are growing revenue 40% month/month.' It also tracks the number of paying companies, which grew from 8 in January to an estimated 60 in August, out of a total pool of 100+ new companies joining monthly.
Slide 8 uses a 'Twitter stream' to provide social proof. It features tweets from users like Bilal Zuberi and Scott Miller. One tweet from Daniel A. Chen reads: 'Holy crap. I just chked out eshares and as a founder up to my eyeballs in options paperwork. I want.' This replaces a traditional 'Testimonials' slide with raw, unedited market validation.
Slide 9 displays a logo wall of customers, including Life360, Sprout Social, and Blue Bottle Coffee. The subtitle, 'Our sweet spot is Series A through D,' indicates that they were successfully moving up-market from the seed stage.
Competition and Efficiency (Slides 10-11)
Slide 10 is an aggressive competitive teardown. It compares eShares to 'CapMx' (a Solium product). eShares checks every box, including 'Electronic issuance of SAFE instruments' and 'Autosaving of draft certificates,' while CapMx fails on nearly all counts. The slide pulls no punches, stating: 'Their product is weak and their customers hate them.'
Slide 11 highlights the company's capital efficiency. Titled 'We are lean and mean,' it notes that in one year and with only $1.2M, they built the 'best cap table product,' reached $70K/month in revenue, and acquired 360+ paying companies. Most impressively, they did this with 'Zero sales people,' a testament to the product's virality among law firms and founders.
The Ask and Future Milestones (Slides 12-13)
Slide 12 repeats the quadrant from Slide 2 but adds the fundraising goal: 'Raising $6-$8M Series A to converge private market.' It defines the Series A as the 'base camp' required to eventually take companies public.
The Appendix and Data Play (Slides 14-17)
Slide 14 reveals the long-term 'moat.' The 'eShares Ownership Map' shows a complex network of nodes (funds/companies) and edges (investments). This suggests that eShares isn't just a ledger; it is a data company that understands the interconnectedness of the venture ecosystem better than any bank or exchange.
Slide 15 lists 'Risk Factors.' This level of transparency is rare in pitch decks. They identify four risks: transaction revenue volatility, a tech market downturn, failure to win over law firms, and security breaches. Acknowledging these risks builds significant credibility with sophisticated investors.
Slide 16 shows the 'food chain' they intend to climb. It lists incumbents like Computershare ($2.0B revenue) and Broadridge ($2.4B revenue), showing the massive TAM (Total Addressable Market) available if eShares can successfully transition to the public markets.
Slide 17 and Slide 18 (implied by the case studies) provide specific examples of non-traditional customers. Slide 17 details 'La Cortez Holdings,' a public company that delisted and moved to eShares. Slide 18 features 'Black Oaks Wind Farm,' a $30M project using eShares to manage 1,000-2,000 debt investors. These case studies prove the platform's versatility beyond just 'Silicon Valley startups.'
Strategic Roadmap (Slides 19-21)
Slide 19 outlines the 24-month plan: capture 10,000 corporations, eliminate competition like CorporateFocus, and manage 100,000 portfolios. It sets clear, measurable KPIs for the Series A capital.
Slide 20 and Slide 21 explain the 'Valuation Consolidation' strategy. Slide 21 is particularly effective, showing how eShares can value a company once and then sell 'views' of that data to multiple funds. By charging the corporation $500 and each of 20 funds $100, they generate $2,500 from a single data set. This illustrates the high-margin scalability of their data-centric model.
What Works in This Deck
The 'Zero Sales' Flex: Highlighting that they reached $70k MRR with no sales team is the ultimate proof of product-market fit. It tells investors that the capital will be used to pour gasoline on an already burning fire, rather than trying to spark one.
The Transactional Pricing Logic: By explaining why they chose transaction fees over subscriptions (Slide 5), they answer a major 'Why?' question before it is asked. It aligns their revenue with the success and activity of their customers.
The Network Effect Visualization: The Ownership Map (Slide 14) transforms the business from a 'utility' to a 'platform.' It suggests that as more companies join, the data becomes exponentially more valuable to investors and LPs.
What is Missing
Team Slide: In the 21 slides provided, there is no dedicated team slide. While the 'lean and mean' slide mentions the lack of sales staff, investors usually want to see the pedigree of the engineering and product leadership in a Series A deck.
Unit Economics: While revenue growth is clear, the deck lacks a deep dive into Customer Acquisition Cost (CAC) and Lifetime Value (LTV). Given they had no sales team, the CAC was likely negligible, but formalizing this would have strengthened the 'lean and mean' argument.
Detailed Use of Funds: The deck asks for $6M-$8M but doesn't provide a line-item breakdown of how that capital will be allocated (e.g., % to engineering, % to sales, % to legal/compliance).
What a Founder Should Copy
The Competitive Comparison: Slide 10 is a perfect example of how to do a 'Checklist' comparison. It doesn't just say 'we are better'; it lists specific technical features that the incumbent lacks, making the superiority objective rather than subjective.
Risk Transparency: Including a 'Risk Factors' slide (Slide 15) is a bold move that signals maturity. It shows you have thought through the 'bear case' for your business, which actually makes the 'bull case' more believable.
The 'Food Chain' Slide: Slide 16 is an excellent way to show TAM. Instead of a vague 'Trillion Dollar Market' circle, it lists actual companies with their tickers, revenues, and market caps. This gives investors a concrete sense of what 'winning' looks like in terms of valuation and scale.
Frequently asked questions
- What was Carta's revenue at the time of this deck?
- According to Slide 7, the company reached approximately $71,532 in total monthly revenue by August 2014. This was split between roughly $60,000 in transaction revenue and $15,000 in subscription revenue. The slide notes that they were growing this revenue at a rate of 40% month-over-month.
- How did Carta differentiate itself from legacy competitors?
- Slide 10 provides a head-to-head comparison with Solium's CapMx. Carta claimed superiority in electronic issuance of shares, warrants, and SAFE instruments—features CapMx lacked. They also highlighted a significant price advantage, noting that CapMx charged $3,000 just for a company to access its own cap table.
- What was the primary goal of the Series A funding?
- As stated on Slide 12, the $6M-$8M target was intended to 'converge the private market' and establish a 'base camp' for taking companies public. Slide 18 further clarifies the 24-month milestone: capturing 10,000 corporations and managing 100,000 shareholder portfolios.
- Who were Carta's early customers mentioned in the deck?
- Slide 9 features logos of several notable early adopters, including Life360, Sprout Social, Blue Bottle Coffee Co, Codecademy, and FullContact. The deck notes that their customer profile was trending toward larger companies in the Series A to Series D range.
- What was the 'Ownership Map' mentioned in the appendix?
- Slide 14 introduces the 'eShares Ownership Map,' a visualization where nodes represent funds and companies, and edges represent investments. This slide suggests that Carta viewed its data not just as a ledger, but as a proprietary graph of the entire venture capital ecosystem.