CaterSquad is a B2B marketplace designed to streamline team catering for corporate clients, specifically targeting tech companies where employee perks are used to combat high turnover. The deck outlines a dual-revenue model consisting of a 7% commission from vendors and a flat $10 convenience fee for companies. While the deck provides specific Year 1 metrics—such as a $103 Customer Acquisition Cost (CAC) and a $4,100 monthly burn rate—it relies heavily on aggressive projections, forecasting a jump from $1.04M in Year 1 to $24.15M by Year 5. The presentation excels at identifying competitor we…
Key takeaways
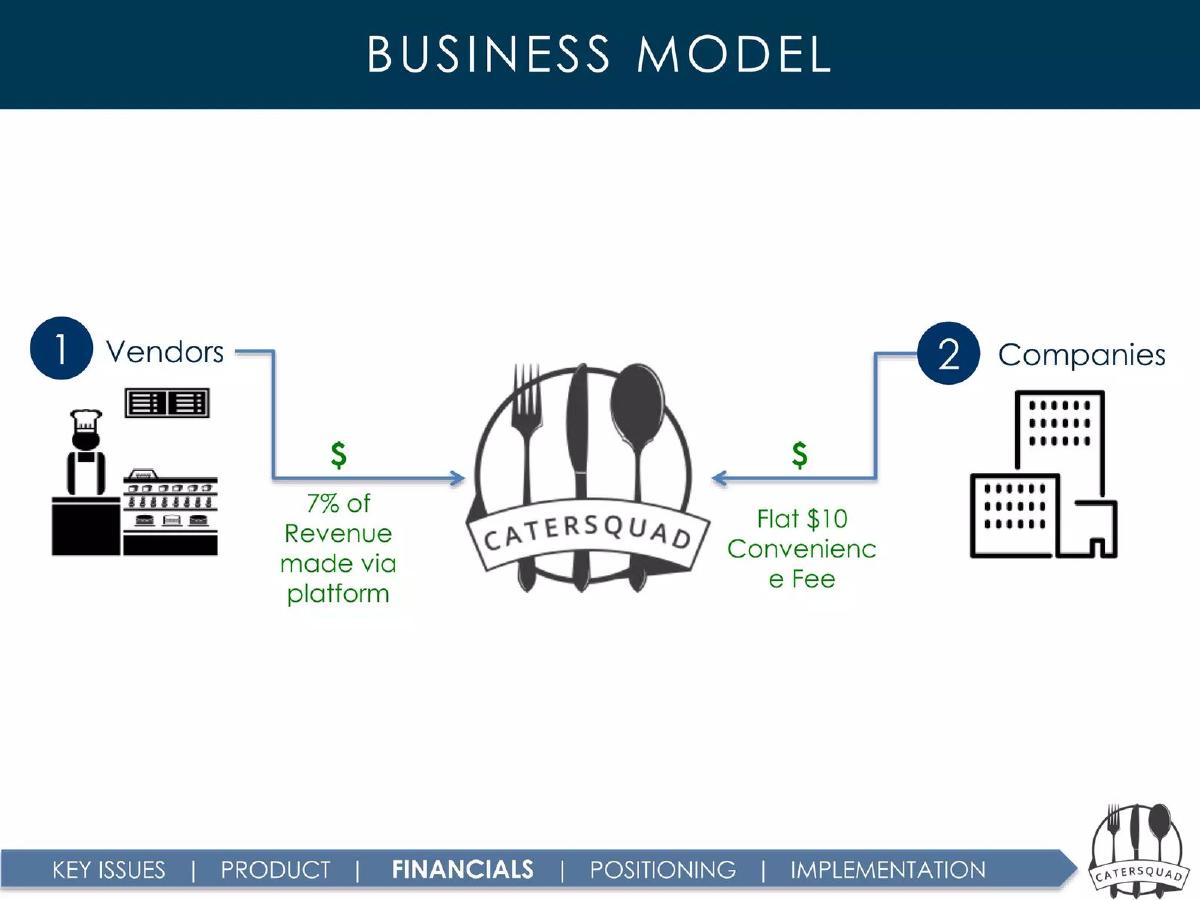
- The business model relies on a 7% revenue share from vendors and a flat $10 convenience fee per order from companies (Slide 4).
- Financial projections are extremely aggressive, forecasting growth from $288,000 in Year 0 to $24.15 million by Year 5 (Slide 7).
- The company identifies a Year 1 Customer Acquisition Cost (CAC) of $103 and a monthly burn rate of $4,100 (Slide 7).
- CaterSquad positions itself as a lower-cost alternative to competitors, citing an average price per meal of $12 compared to ZeroCater's $17 (Slide 16).
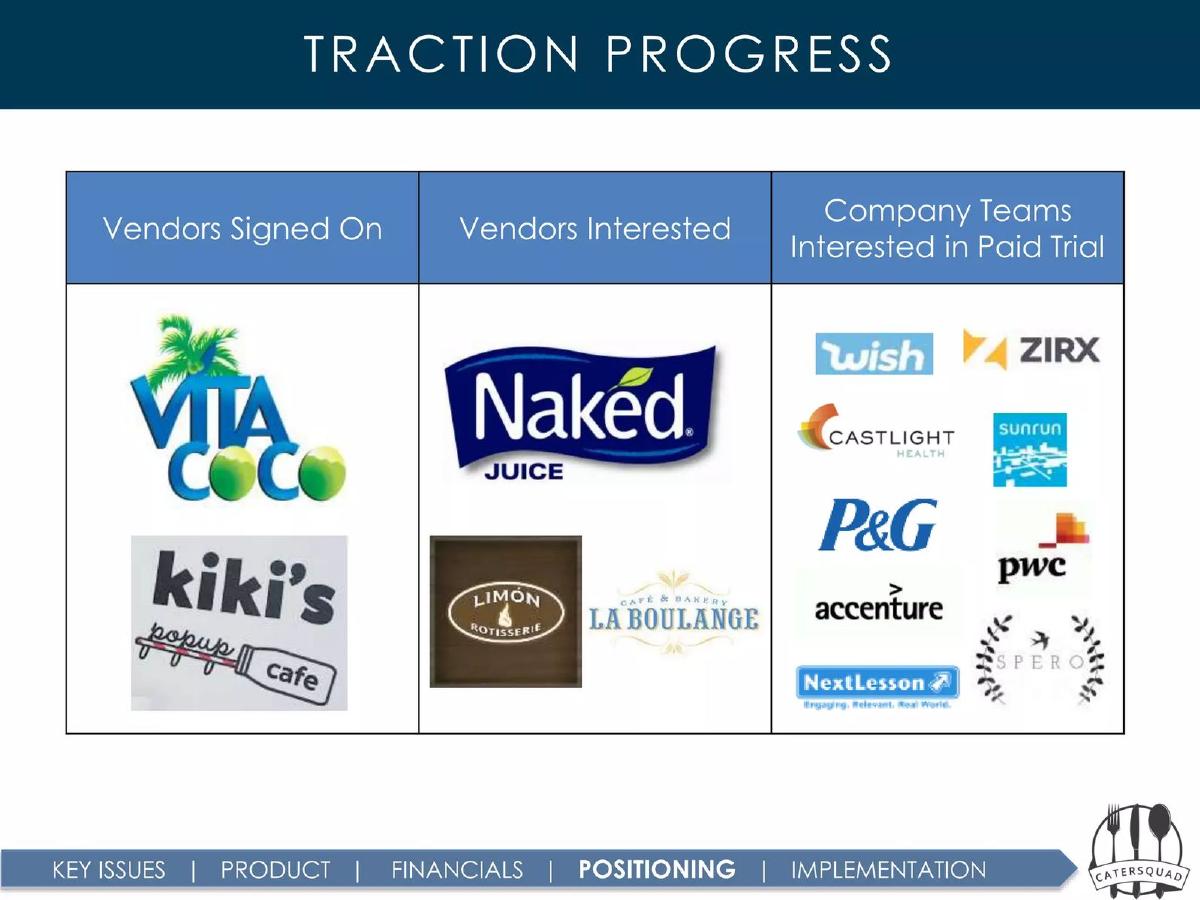
- Traction is demonstrated through interest from major brands including P&G, Accenture, and PwC for paid trials (Slide 5).
- The deck utilizes direct negative feedback about competitors like ZeroCater to justify its focus on delivery accuracy and quality control (Slide 12).
- The founding team consists of five members, including a CEO, CFO, CDO, CMO, and CTO, though their specific backgrounds are not detailed (Slide 8).
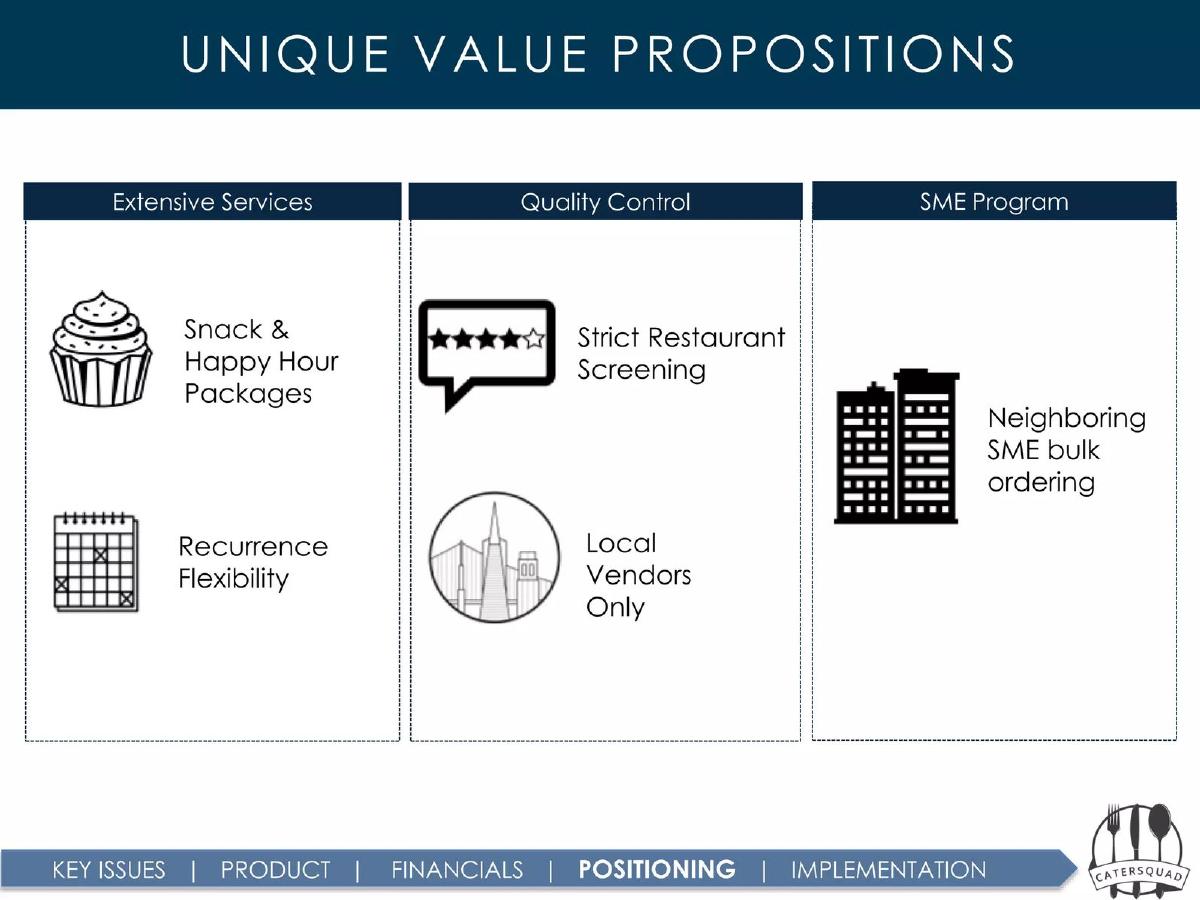
- A 'SME Program' is highlighted as a unique value proposition, allowing neighboring small-to-medium enterprises to participate in bulk ordering (Slide 6).
Executive Summary and Value Proposition
CaterSquad positions itself as a logistics and marketplace solution for the corporate catering industry. The deck, consisting of 16 slides, follows a logical progression from problem identification to financial forecasting. The central theme is 'Team catering done easy,' as stated on the title slide. The company targets the tech industry specifically, citing high turnover rates and the need for employee perks like shared meals to foster collaboration and reduce stress.
Slide 1: Title Slide
The cover slide features the CaterSquad logo—a fork, knife, and spoon inside a circular crest—over a blurred image of a busy city street. The tagline 'Team catering done easy' clearly defines the company's mission. It establishes a professional, if somewhat generic, brand identity for a service-oriented startup.
Slide 2: Our Solution
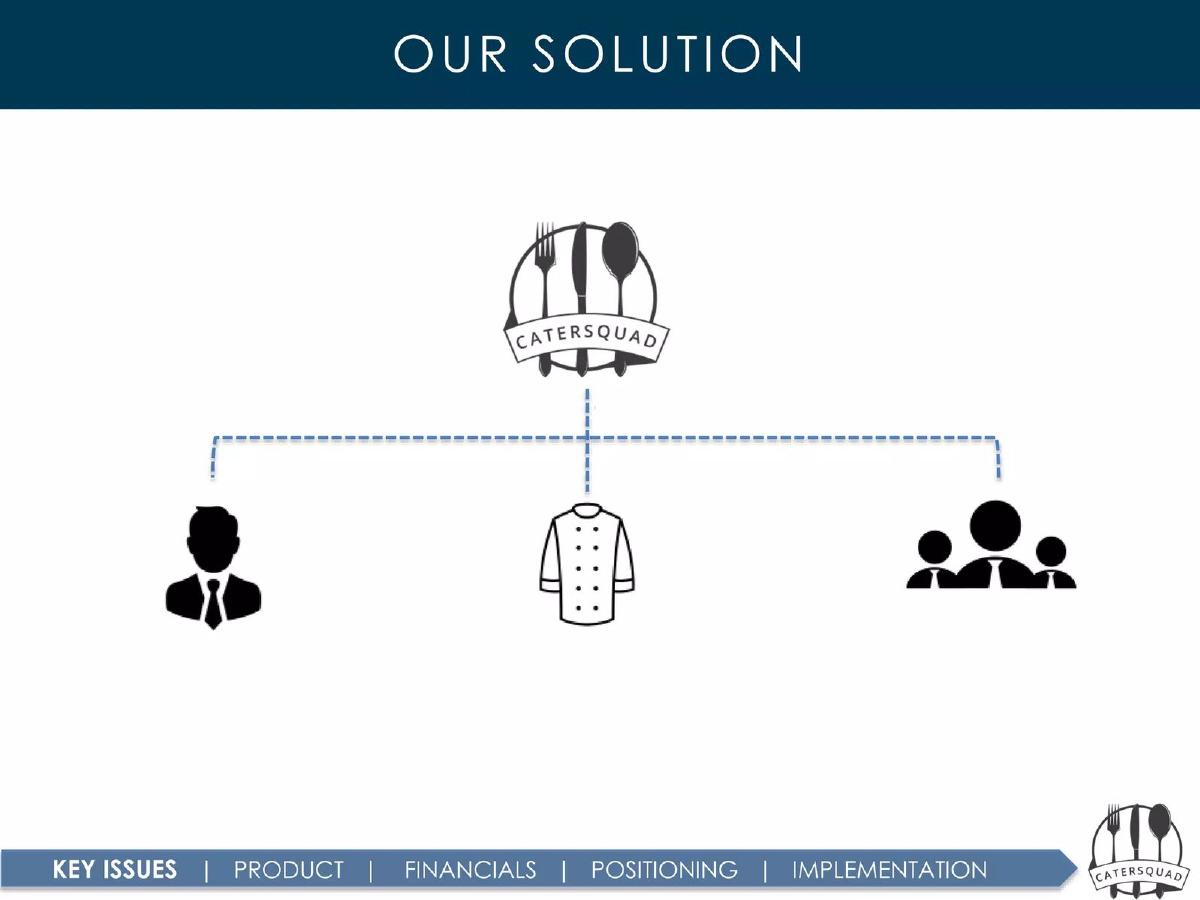
This slide uses a simple flowchart to show CaterSquad acting as the central hub connecting three entities: a corporate representative (the buyer), the chef/vendor (the provider), and the team (the end consumers). It effectively illustrates the marketplace nature of the business without overcomplicating the technical aspects of the platform.
Slide 3: Our Product
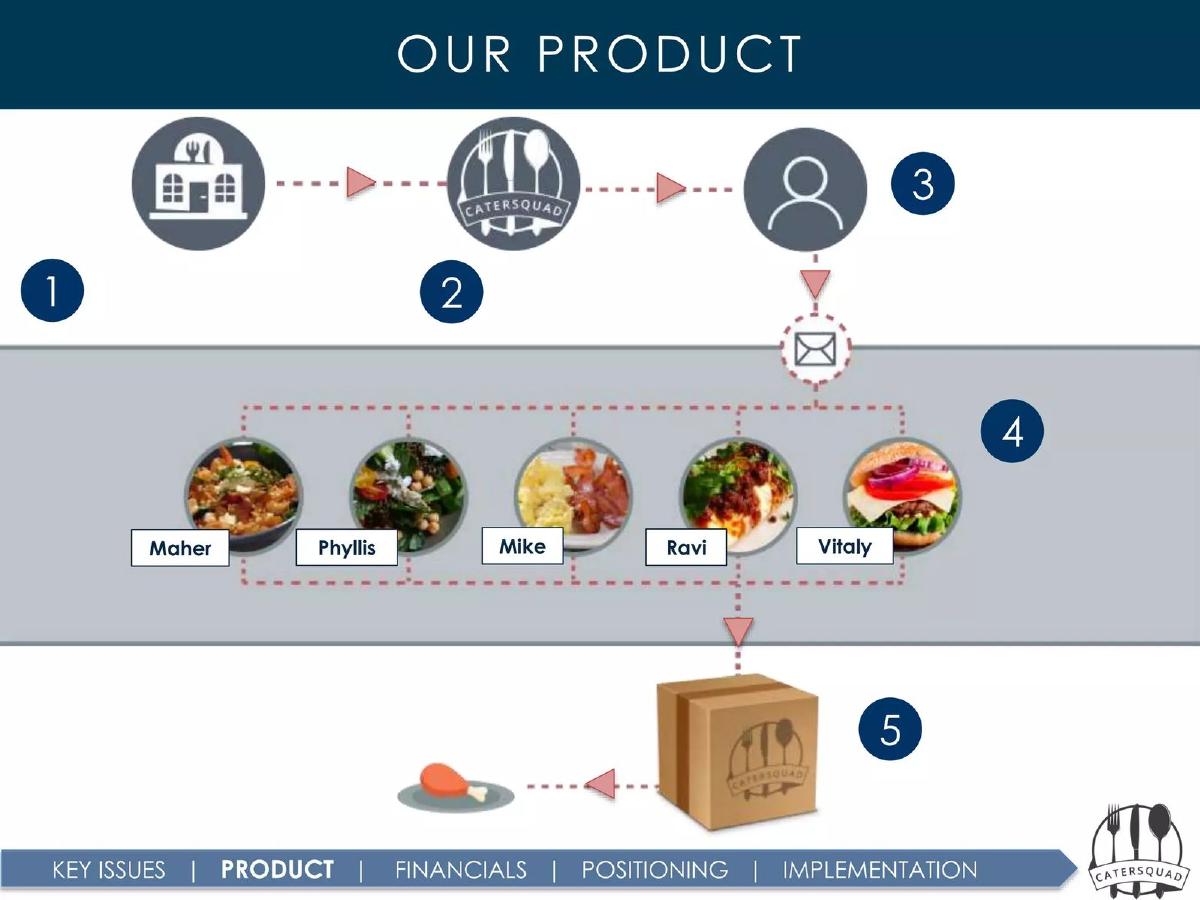
Slide 3 breaks down the user journey into five steps. 1) The vendor joins the platform. 2) CaterSquad integrates the vendor. 3) The corporate user accesses the system. 4) Individual team members (named Maher, Phyllis, Mike, Ravi, and Vitaly in the graphic) select their specific meals. 5) The consolidated order is delivered. This highlights a key feature: individual meal choice within a bulk corporate order, which addresses the 'no nuts' or 'no garlic' complaints mentioned later in the deck.
Slide 4: Business Model
The revenue model is transparently displayed on slide 4. CaterSquad generates income from both sides of the transaction. Vendors pay 7% of the revenue made via the platform. Companies pay a flat $10 convenience fee. This low-percentage take rate suggests a strategy focused on high-volume enterprise accounts rather than high-margin boutique catering.
Slide 5: Traction Progress
This slide categorizes traction into three buckets: Vendors Signed On, Vendors Interested, and Company Teams Interested in Paid Trial. Notable logos include Vita Coco and Kiki’s (Signed), Naked Juice and La Boulange (Interested), and a significant list of corporate prospects including Wish, P&G, Accenture, PwC, and Fitbit. Citing these large corporations as 'interested' provides social proof, though it does not confirm active revenue-generating contracts.
Slide 6: Unique Value Propositions
CaterSquad identifies three pillars of differentiation: Extensive Services (Snack and Happy Hour packages, recurrence flexibility), Quality Control (Strict restaurant screening, local vendors only), and a SME Program (Neighboring small-to-medium enterprise bulk ordering). The SME program is a particularly interesting strategic move, as it allows the company to aggregate demand from smaller offices that might otherwise be ignored by large-scale caterers.
Slide 7: Financial Growth
The financial slide is the most data-dense part of the deck. It projects a steep revenue curve: $288K in Year 0, $1.04M in Year 1, $2.04M in Year 2, and eventually $24.15M in Year 5. The slide notes that they expect to become cash flow positive during Year 2. Key Year 1 estimations include a 23% gross margin, a $4,100 monthly burn rate, and a $103 Customer Acquisition Cost (CAC). These specific figures give investors concrete numbers to stress-test.
Slide 8: Meet the Squad
The team slide introduces five members: Vi Tran (CEO), Joshua Wong (CFO), Andreas Hammer (CDO), Hasnain Bukhari (CMO), and Rasmus Lunding (CTO). While the slide includes photos and titles, it is notably missing any information regarding their professional backgrounds, education, or previous startup experience. This is a significant weakness, as investors typically bet on the team's ability to execute.
Slide 9 & 10: Q&A and Appendix
These are transition slides. Slide 9 is a simple 'Q&A' placeholder, and Slide 10 marks the beginning of the 'Appendix' section. The inclusion of an appendix suggests the founders were prepared for deeper due diligence during a live presentation.
Slide 11: Customer Traction (Appendix)
This slide provides qualitative evidence of demand. It features screenshots of four emails. Tri Nguyen from BlackRock confirms Kiki’s Popup Cafe will join the program. Nicholas Han from Vita Coco expresses interest in providing complementary products. Jonathan Kim from Fitbit and Elsie Cheang from Wish both send inquiries about hiring CaterSquad for events. These emails validate that the founders are actively communicating with high-value targets.
Slide 12: Complaints about Competitors (Appendix)
This slide is a strategic 'de-positioning' tool. It lists specific, negative feedback regarding a competitor, ZeroCater. Complaints include vendors forgetting utensils, deliveries going to the wrong address, late arrivals, and failure to honor dietary restrictions (e.g., 'no garlic'). By highlighting these specific failures, CaterSquad justifies its own focus on 'Strict Restaurant Screening' and 'Accuracy Delivery Window Time.'
Slide 13: Industry Quotes (Appendix)
Using data from PayScale, this slide builds the macro-case for the business. It notes that tech companies have the highest turnover rates and that 60% of employees feel company-provided lunches encourage collaboration. It also claims 51% of employees spend more than 10 minutes a day picking up lunch outside the office, framing CaterSquad as a productivity tool for the employer.
Slide 14: Website Snapshots (Appendix)
This slide shows the user interface (UI) for 'Create your event' and 'Choose restaurant.' The interface appears clean and functional, allowing users to set budgets, participant counts, and view menu items like 'Turkey Chorizo' or 'Napa Waldorf Chicken' with associated prices. This proves that a working prototype or MVP (Minimum Viable Product) exists.
Slide 15: Go-To-Market Strategy (Appendix)
The GTM strategy focuses on three channels: Yelp (for vendor sourcing), Startup Conferences (specifically naming 'Angel Launch'), and Food Vendor Conferences (naming 'Bon Appétech'). This is a very narrow GTM strategy that focuses heavily on physical events, which may be difficult to scale compared to digital lead generation.
Slide 16: Competitor Analysis (Appendix)
The final slide is a comparison matrix against Eat Club, ZeroCater, and Caviar. CaterSquad claims the lowest average price per meal ($12) and the most flexible requirements ('All Sizes' for minimum orders). They also claim a 4/5 average vendor rating and a ±5 minute delivery window, positioning themselves as the most reliable and cost-effective option in the market.
What Works Well
Specific Unit Economics: The inclusion of a $103 CAC and a $4,100 burn rate on Slide 7 shows the founders have a grasp on their current operational costs. · Direct Competitor Critique: Slide 12 is a powerful way to demonstrate market gaps. Instead of just saying they are 'better,' they show exactly where the market leader is failing. · Clear Revenue Model: The 7% + $10 fee structure on Slide 4 is easy to understand and allows for quick calculations of potential profitability per account. · Social Proof: The email screenshots on Slide 11 are much more convincing than a simple list of logos, as they show actual engagement from decision-makers at BlackRock and Fitbit.
What Is Missing
The Ask: There is no slide indicating how much money the company is raising, what the valuation is, or what milestones the funding will help them achieve. · Team Pedigree: Slide 8 is essentially just a photo gallery. Without knowing if these founders have experience in logistics, food service, or software, it is hard to assess execution risk. · Market Size (TAM/SAM/SOM): While they mention the tech industry has high turnover, they never quantify the total addressable market in dollars. · Detailed Use of Funds: Even if the 'Ask' was present, there is no breakdown of how the capital would be allocated between engineering, sales, and operations.
Founder Takeaways
Leverage Competitor Weakness: If you are entering a crowded market, do what CaterSquad did on Slide 12—find actual customer complaints about the incumbents and build your value prop around solving those specific pain points. · Be Specific with Metrics: Don't just project revenue. Include CAC, LTV (if available), and burn rate. It shows you are running the business by the numbers. · Show the UI: For marketplace startups, showing the actual product (Slide 14) helps demystify how the two sides of the market interact. · Don't Forget the Ask: A pitch deck is a fundraising tool. Never leave an investor wondering what you actually want from them. Always include a clear slide detailing the amount you are raising and your primary objectives for that capital.
Frequently asked questions
- What is CaterSquad's primary revenue driver?
- According to slide 4, CaterSquad operates a two-sided marketplace revenue model. They take a 7% commission on all revenue generated by vendors through the platform. Additionally, they charge corporate clients a flat $10 'convenience fee' per order. This suggests the company is prioritizing volume and vendor partnerships over high per-meal markups.
- How does CaterSquad differentiate itself from established competitors like ZeroCater?
- Slide 16 provides a direct comparison, showing CaterSquad has a lower average meal price ($12 vs. $17) and no minimum meal requirement, whereas ZeroCater requires more than 15 meals. They also highlight a ±5 minute delivery window accuracy and broader service offerings including snacks and 'Happy Hour' (HH) packages.
- What are the company's short-term financial goals?
- As stated on slide 7, by the end of Year 2, CaterSquad aims to reach $2.04 million in revenue and become cash flow positive. Their operational goals for this period include securing 170 weekly daily corporate customers and expanding their vendor network to over 200 providers.
- What evidence of market demand does the deck provide?
- Slide 11 includes screenshots of emails from employees at BlackRock, Fitbit, and Wish expressing interest in the service. Slide 5 lists several high-profile companies 'interested in a paid trial,' including Accenture, PwC, and Sunrun, suggesting significant enterprise-level interest despite the early stage of the startup.
- What is missing from the CaterSquad pitch deck?
- The deck lacks a formal 'Ask' slide, meaning there is no information on how much capital they are seeking or the intended use of funds. Furthermore, while slide 8 introduces the team, it lacks professional biographies or past company experience, which is a critical omission for investors evaluating execution risk.