Campus Crest Communities (CCG) uses this 2011 investor presentation to position itself as a dominant player in the student housing sector, leveraging a vertically integrated operating platform. The deck relies heavily on macroeconomic trends, such as the 'Echo Boom' driving college enrollment, and the obsolescence of traditional on-campus dormitories. By showcasing a portfolio that grew from 10 to 27 properties between 2007 and 2011, CCG demonstrates scalability and operational consistency. Key metrics like RevPOB (Revenue Per Occupied Bed) and Same-store NOI (Net Operating Income) are used t…
Key takeaways
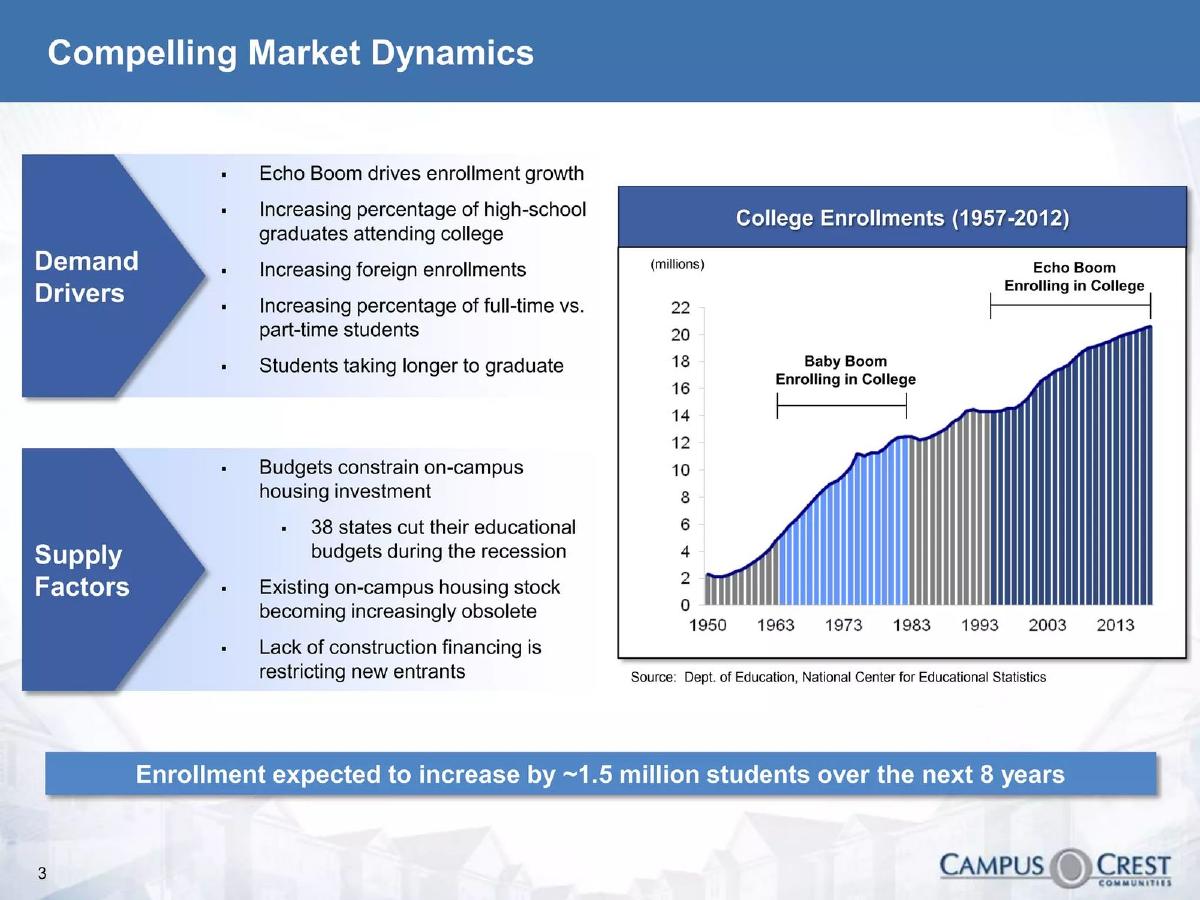
- College enrollment is projected to increase by approximately 1.5 million students over the eight years following 2011 (Slide 3).
- The company identifies a supply gap caused by 38 states cutting educational budgets during the recession, limiting on-campus housing investment (Slide 3).
- Campus Crest differentiates its product by offering 'bed-bath parity' and resort-style amenities like swimming pools and fitness centers (Slide 9).
- The company maintains a vertically integrated platform covering property management, development, construction, and wholesale supply (Slide 12).
- CCG has a proven track record of developing approximately $500 million of student housing properties (Slide 12).
- Historical weighted average occupancy reached 89% in the first half of 2011, up from 88% in 2007 (Slide 15).
- RevPOB (Revenue Per Occupied Bed) grew from $448 in 2007 to $477 in the first half of 2011 (Slide 15).
- Same-store Net Operating Income (NOI) increased 12.1% year-over-year, reaching $6.7 million in Q2 2011 (Slide 18).
Campus Crest Communities: The Shift to Modern Student Living
The September 2011 Investor Presentation for Campus Crest Communities (CCG) serves as a comprehensive look at the student housing Real Estate Investment Trust (REIT) sector during a period of significant transition. The deck is structured to move from macro-market dynamics to specific property-level advantages and finally to hard financial performance metrics. It positions the company not just as a landlord, but as a developer and operator capable of scaling a 'prototypical' model across the United States.
Slide 1: Title Slide
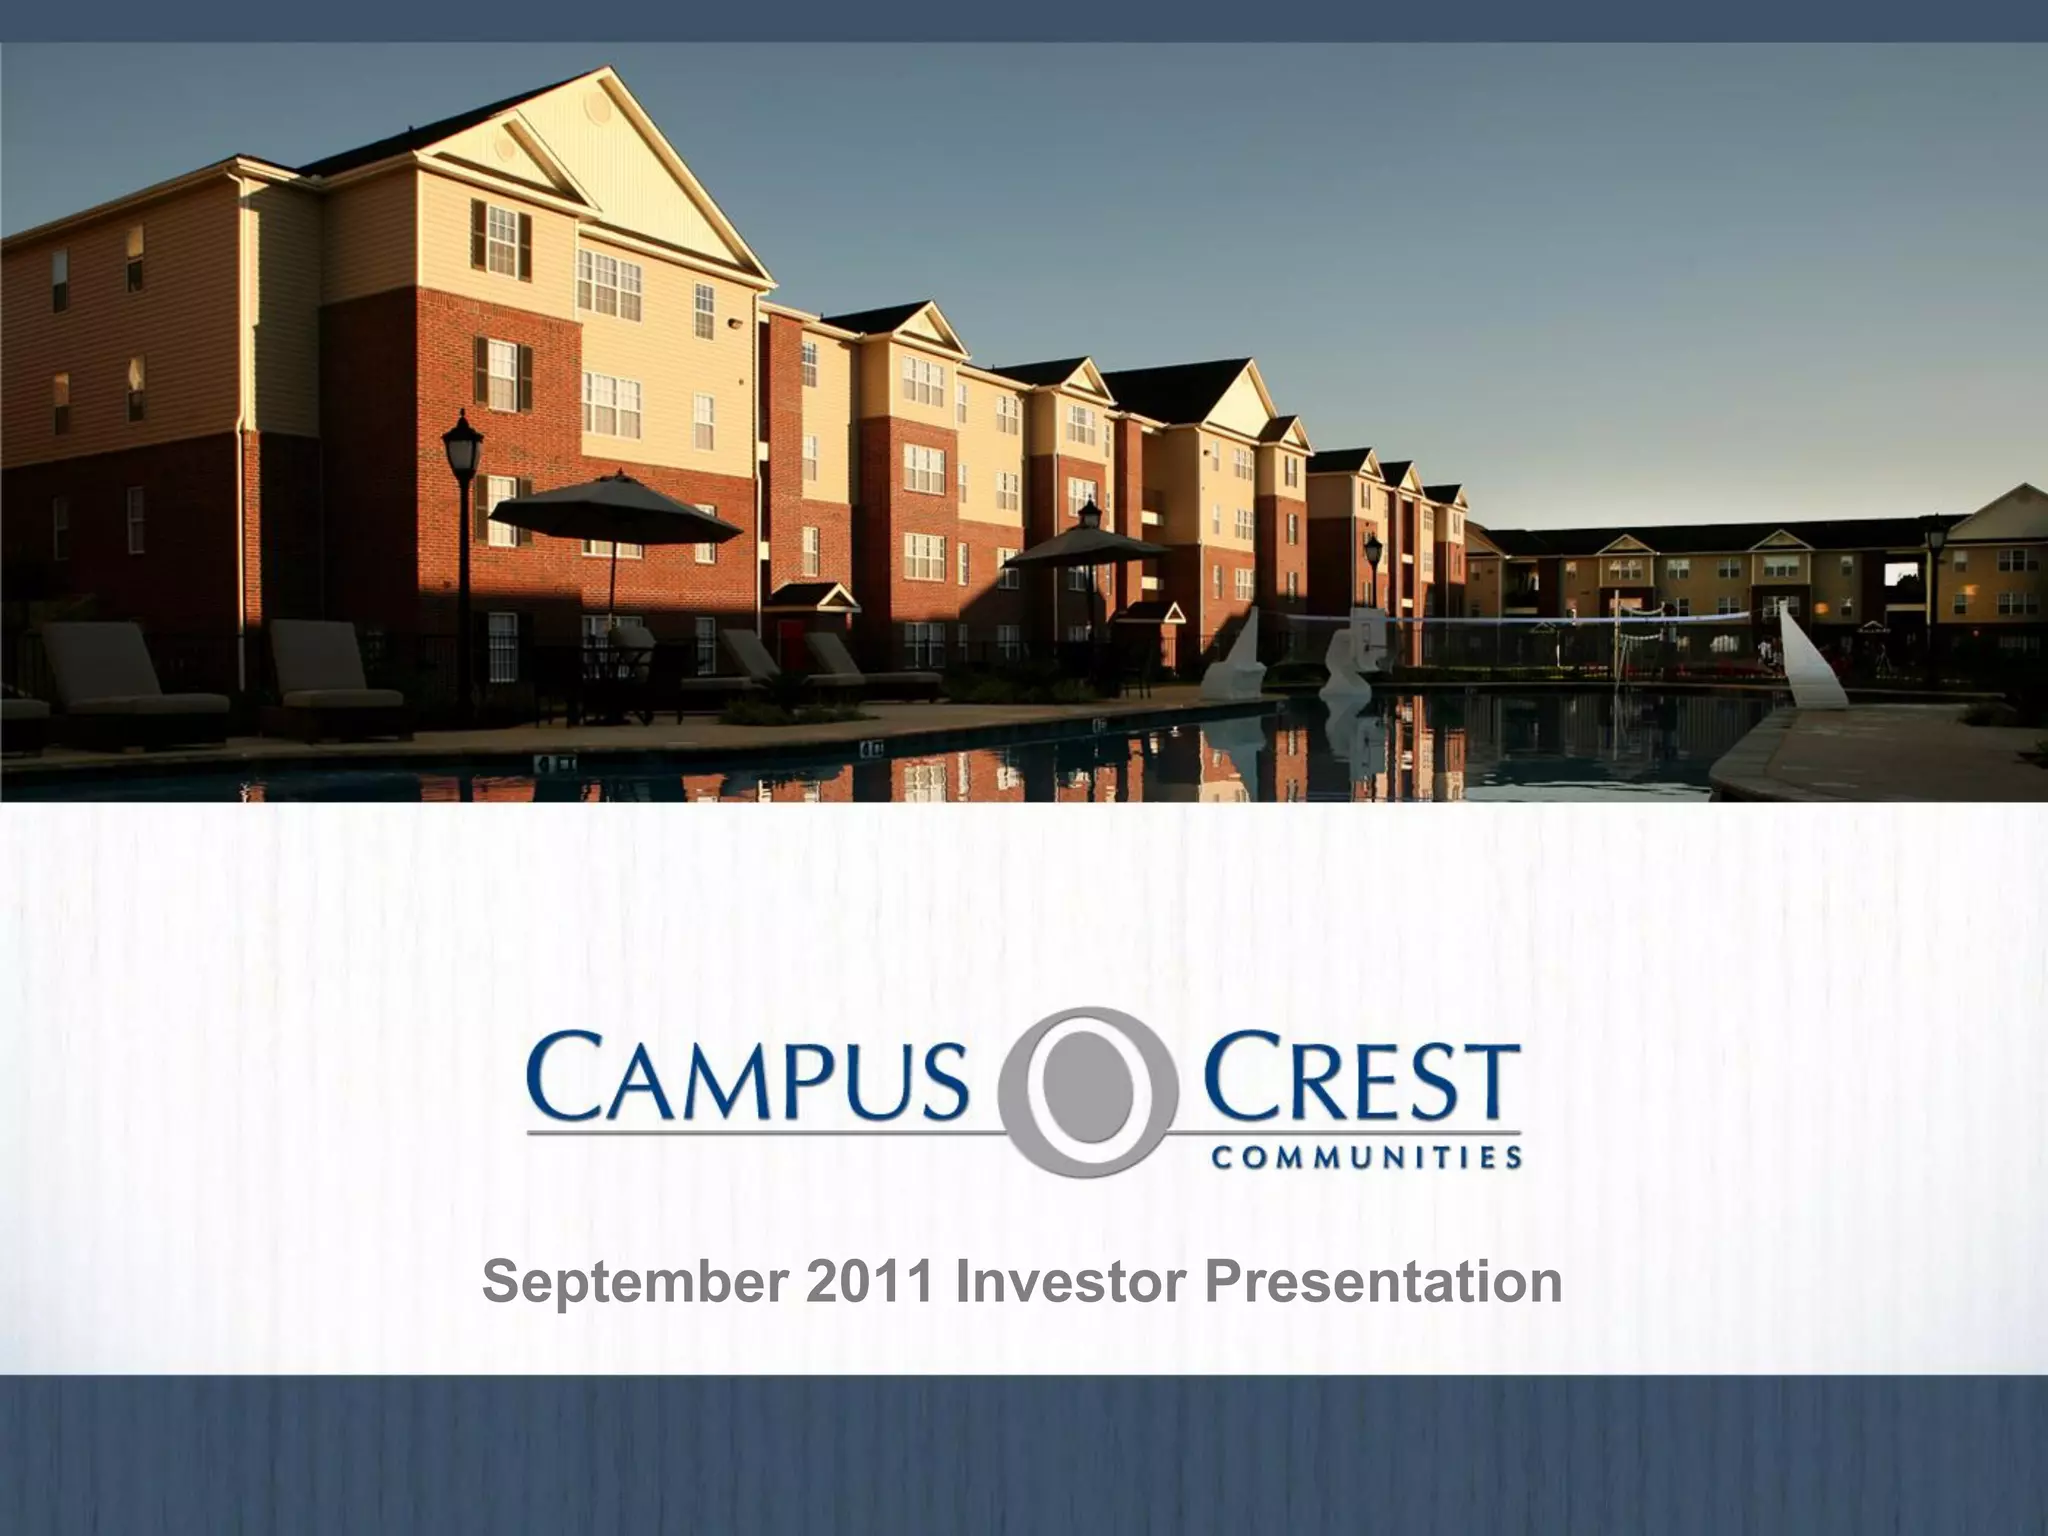
The cover slide features a high-quality photograph of a modern apartment complex with a swimming pool, immediately establishing the visual standard for the company's properties. The branding is clear, identifying the company as Campus Crest Communities and dating the presentation to September 2011. The use of a real property photo rather than a generic graphic sets a professional tone for institutional investors.
Slide 3: Compelling Market Dynamics
This slide establishes the 'Why Now?' for the investment. It breaks the market down into Demand Drivers and Supply Factors. On the demand side, it cites the 'Echo Boom' (the children of Baby Boomers) as a primary driver for enrollment growth. A chart titled 'College Enrollments (1957-2012)' shows a steady upward trajectory, with a note that enrollment is expected to increase by approximately 1.5 million students over the next 8 years. On the supply side, the slide highlights that 38 states cut educational budgets during the recession, leading to a lack of investment in on-campus housing and a lack of construction financing for new entrants. This creates a favorable environment for established private developers like CCG.
Slide 6: The Evolution of Student Housing – The Dormitory Era
Slide 6 is a 'problem' slide using visual evidence. It shows four bleak photos of traditional on-campus housing: small rooms with twin beds, communal sinks, and bathroom stalls. The text at the bottom notes that these alternatives generally consist of shared rooms and 'extremely limited (if any) amenities and parking.' By labeling this 'The Dormitory Era,' the deck implies that this style of living is a thing of the past, setting the stage for CCG's modern solution.
Slide 9: Our Properties are Attractive and Amenity-Rich
This slide serves as the 'solution.' It lists apartment features such as private bedrooms with keyed locks, en suite bathrooms, and full kitchens. It also highlights community amenities like resort-style pools and fitness centers. The photos contrast sharply with Slide 6, showing well-furnished living rooms and professional-grade gym equipment. The key takeaway at the bottom is 'bed-bath parity,' a crucial industry term meaning every bedroom has its own dedicated bathroom, which CCG identifies as a major draw for the modern student.
Slide 12: Identified Pipeline of Future Development Opportunities
CCG demonstrates its scale and growth strategy here. A map of the United States shows 'Identified Development Sites' and '2011 Deliveries' concentrated in the East, Midwest, and South. The slide details their 'vertically integrated, highly scalable operating platform,' which includes everything from site selection to wholesale supply. They claim a proven track record of developing approximately $500 million of student housing properties and state they are conducting due diligence on 80 sites as potential opportunities.
Slide 15: Increasing Occupancy and RevPOB
This is a critical data slide for REIT investors. It provides two bar charts: Historical Weighted Average Occupancy and Historical Weighted Average RevPOB (Revenue Per Occupied Bed). The occupancy chart shows a steady climb from 88% in CY07 to 89% in 1H11, despite the portfolio growing from 10 to 27 properties in that time. The RevPOB chart shows growth from $448 to $477. These metrics prove that the company can maintain and even improve performance while rapidly expanding its footprint.
Slide 18: Q2 2011 Performance
The final slide in this selection provides a snapshot of recent financial health. Same-store NOI (Net Operating Income) grew 12.1% year-over-year. Pre-leasing for the 2011/2012 cycle was at 87.0% for the operating portfolio as of August 1, 2011. The slide also includes FFO (Funds From Operations) figures, a standard REIT metric, reporting $0.17 per diluted share for the quarter. The company uses this slide to reiterate its full-year guidance, signaling confidence to the market.
What Campus Crest Communities Does Well
The deck is exceptionally strong at defining the market opportunity. By using Department of Education data to show enrollment trends and contrasting 'Dormitory Era' photos with their own 'Amenity-Rich' photos, they create a clear narrative of progress and necessity. The use of industry-specific metrics like RevPOB and bed-bath parity shows a deep understanding of the student housing niche. Furthermore, the emphasis on a 'vertically integrated' platform addresses potential investor concerns about the risks of rapid development; by controlling the supply chain and construction, the company suggests it can mitigate common delays and cost overruns.
What is Missing from the Deck
The most notable omission in these slides is a dedicated Team slide. While the 'proven track record' is mentioned, the specific individuals leading the development and management teams are not highlighted. There is also a lack of detailed competitive analysis. While they mention 'limited competing product' on Slide 12, they do not name other major student housing REITs or explain how they specifically win against other private developers in the same markets. Finally, the deck does not explicitly detail the 'wholesale supply' part of their vertical integration, which could be a significant competitive advantage or a potential point of failure if not managed correctly.
Lessons for Founders
Founders in the real estate or physical infrastructure space can learn several lessons from this deck. First, standardize your metrics . CCG uses RevPOB and Same-store NOI consistently, which allows investors to track health across different years and property counts. Second, visualize the 'Before and After.' The contrast between the old dorms and the new apartments is a powerful emotional and logical hook. Third, show the pipeline . For a growth-stage company, it isn't enough to show what you have; you must show the 'Identified Pipeline' to prove that your growth isn't just a fluke but a repeatable process. Finally, leverage macro trends . By tying their success to the 'Echo Boom' and state budget cuts, CCG makes their growth seem inevitable rather than just lucky.
Frequently asked questions
- What is RevPOB and why does Campus Crest use it?
- RevPOB stands for Revenue Per Occupied Bed. As noted on Slide 15, it includes both student housing leasing and student housing services revenue. In the student housing industry, where leases are often signed per bed rather than per unit, this metric provides a more accurate picture of the revenue generated by the specific population of the building compared to traditional multifamily metrics.
- How does Campus Crest justify the need for new student housing?
- The company points to two main factors on Slide 3: increasing demand and restricted supply. Demand is driven by the 'Echo Boom' and higher college enrollment rates. Supply is constrained because universities face budget cuts and existing on-campus housing is becoming 'obsolete.' Slide 6 illustrates this obsolescence by showing cramped, communal dormitories with limited amenities.
- What does 'vertically integrated' mean in this context?
- According to Slide 12, Campus Crest manages the entire lifecycle of their properties. This includes site selection, development and construction, wholesale supply of materials, and ongoing property and asset management. They claim this 'prototypical roll-out' reduces costs and shortens the development period, which is critical for meeting the strict academic calendar deadlines.
- What are the specific amenities Campus Crest offers to compete with dorms?
- Slide 9 lists several features intended to appeal to the 'college lifestyle.' These include private bedrooms with keyed locks, en suite bathrooms, full kitchens, and washers/dryers in every unit. Community amenities include resort-style pools, basketball and volleyball courts, game rooms, coffee bars, and gated entrances.
- What was the financial performance of the company in mid-2011?
- Slide 18 shows strong growth, with Same-store NOI increasing 12.1% to $6.7 million. The operating portfolio was 87.0% leased for the 2011/2012 cycle as of August 1, 2011. The company also reported an Adjusted FFO of $0.16 per diluted share for the second quarter, maintaining a positive outlook for the full year.