Cobre del Mayo's 2015 investor presentation is a comprehensive operational and financial review of a copper mining entity, likely aimed at debt investors or bondholders. The deck moves quickly past the 'what' to the 'how,' detailing complex extraction processes and historical cost curves. With data through 1Q15, the company highlights a significant reduction in C1 cash costs from $3.63/lb in 2010 to $2.30/lb in 1Q15 LTM. The presentation is heavy on technical flowcharts and historical financial performance, culminating in a yield comparison that positions Cobre del Mayo's 16.4% YTM bonds agai…
Key takeaways
- The company has invested $302.9 million in capex since 2009, with future sustaining capex estimated at approximately $13 million per year (Slide 7).
- C1 cash costs saw a downward trend from a peak of $3.63/lb in 2010 to $2.30/lb for the 1Q15 Last Twelve Months (Slide 10).
- Cobre del Mayo holds rights to 30 mining concessions with terms ending between 2043 and 2062, covering both owned and third-party land (Slide 13).
- The company secured agreements for 100% of its 2015 cathode production to be sold to two international commodity traders (Slide 13).
- Historical copper price forecasts have consistently underestimated actual market prices, which the company uses to justify long-term value (Slide 16).
- Operating costs rose steadily from $87.3 million in 2010 to $166.2 million in 2014, reflecting increased production scale (Slide 22).
- The deck positions Cobre del Mayo bonds (COBREM 10 3/4) as high-yield at 16.4% YTM, significantly higher than Taseko Mines at 15.7% or Hudbay at 8.7% (Slide 25).
- The presentation lacks a traditional 'Team' slide or management bios, focusing entirely on assets and financials.
Investor Presentation Analysis: Cobre del Mayo (June 2015)
The Cobre del Mayo investor presentation from June 2015 is a highly technical, data-driven deck designed for institutional investors, likely in the debt or high-yield bond markets. Unlike a seed-stage startup deck that sells a vision, this deck sells an operational reality backed by years of historical production data and audited financial metrics. It focuses heavily on the 'de-risking' of the asset through completed capex and long-term concessions.
Slide 1: Title Slide
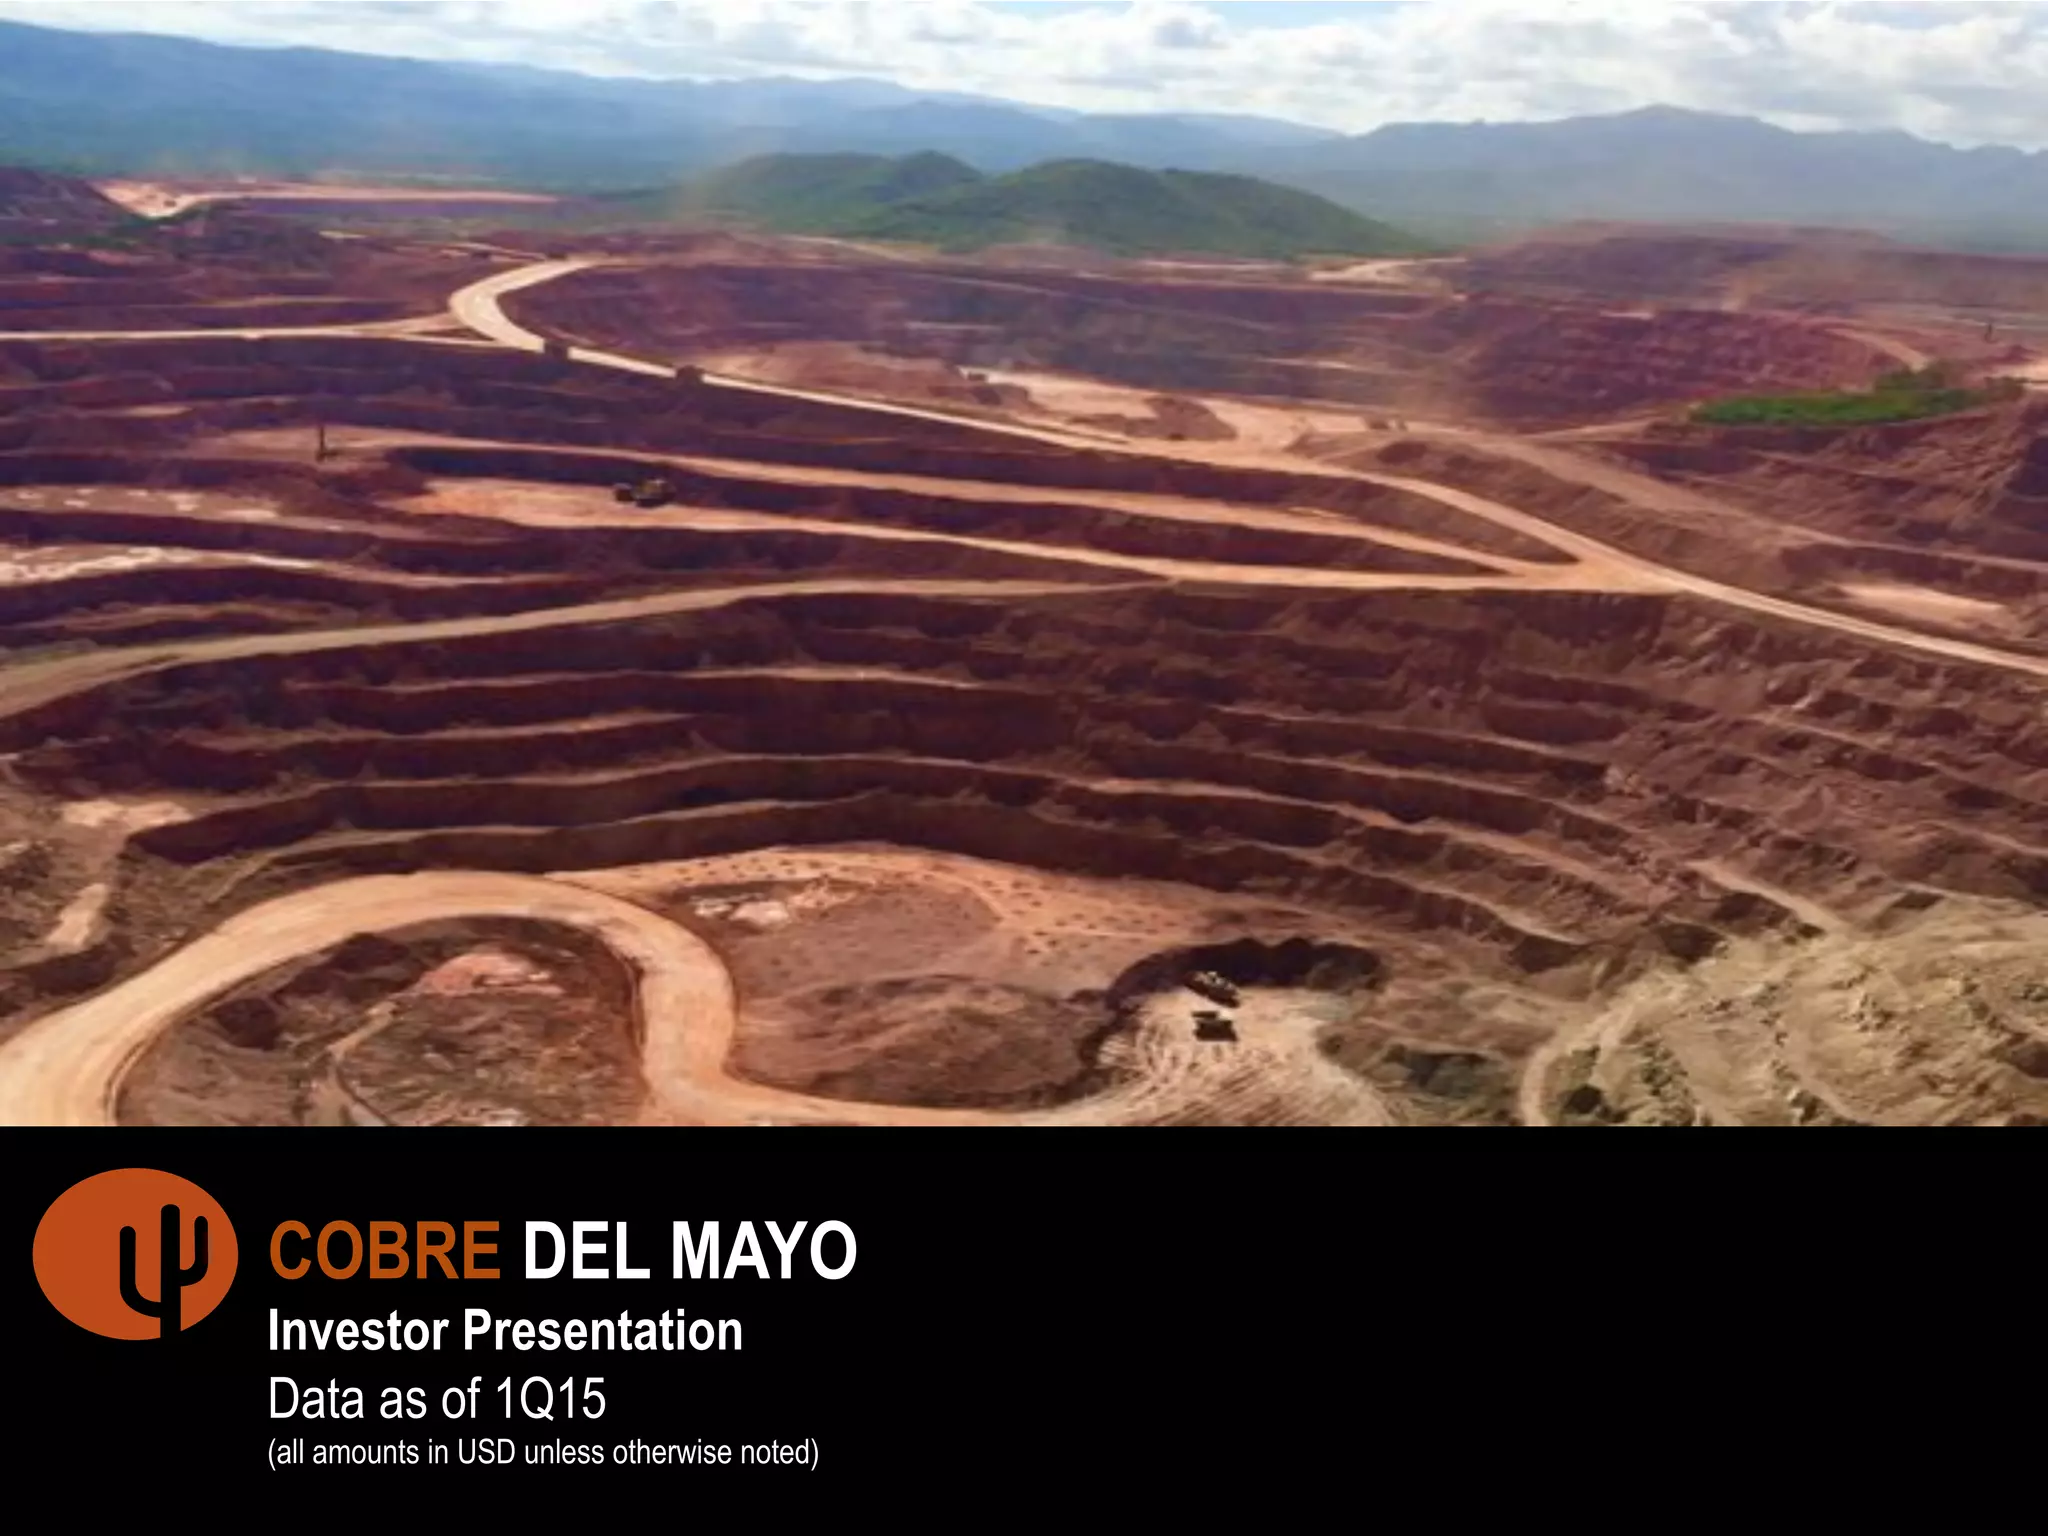
The cover slide features a wide-angle aerial shot of an open-pit mine, establishing the scale of the operation immediately. It identifies the company as Cobre del Mayo and specifies that the data is current as of 1Q15. The note that all amounts are in USD unless otherwise stated is a standard but necessary inclusion for a company operating in the global commodities market.
Slide 2: Company Overview Divider
A simple section divider using a grayscale version of the mine site. It signals the beginning of the core business description.
Slide 7: Stable Low Risk Operations and Processes
This slide is a technical flowchart of the mining process. It tracks the movement of material from the 'Open Pit Mining' through 'Ore Haulage' to various processing stages including the 'Primary Crusher,' 'Leach Pads,' and finally to 'Copper Cathode' production via SX-EW (Solvent Extraction and Electrowinning). Key Figure: The slide notes that $302.9 million in capex has been invested since 2009. It also highlights a low forward-looking sustaining capex of ~$13 million per year for the Life of Mine (LOM). This is a critical point for investors: the expensive construction phase is over, and the company is now in the cash-generation phase.
Slide 10: Competitive Cash Cost
This slide addresses the company's efficiency. The top chart shows a historical decline in C1 Cash Cost from $3.63/lb in 2010 to $2.30/lb in the 1Q15 LTM period. The bottom chart is a 'Global Copper C1 Cash Cost Curve,' which plots Cobre del Mayo against the rest of the world's producers. The company places itself in the middle of the pack, with a LOM C1 Cash Cost of $1.65/lb. This positioning is intended to show that even if copper prices drop, the company remains viable compared to higher-cost producers on the right side of the curve.
Slide 13: Relevant Agreements and Risk Management
This slide details the legal and commercial backbone of the company. It lists 30 mining concessions with terms ending between 2043 and 2062. It also confirms that 100% of the 2015 cathode production is pre-sold to two 'internationally renowned' commodity traders. This is a significant de-risking factor, as it guarantees a buyer for the output. The slide also mentions a 10-year agreement to sell copper ore to 'KM' for concentrate production, showing diversified revenue streams from the same site.
Slide 16: Copper Price Forecasts Over Time
Cobre del Mayo uses this slide to argue that the market generally underestimates copper prices. The chart shows 'Actual' copper prices (a solid blue line) frequently exceeding the 'Broker Consensus' and 'Long Term Price' forecasts (dotted lines). By showing that forecasts are historically conservative, the company implies that its future revenue might be higher than current conservative models suggest. The current long-term forecast at the time was $3.06/lb.
Slide 21: Operational Environment Divider
Another section divider, this time showing the leach pads or tailing areas of the mine. It transitions the deck into the financial performance section.
Slide 22: Summary of Historical Financials
This is the most data-dense slide in the deck, featuring four key charts:
Cathode Produced & Copper Contained in Ore Sold: Shows production peaking in 2012 at 84.1 tpd and stabilizing around 75 tpd in 2015. · Total Sales and Realized Cu Price: Sales grew from $78.2 million in 2010 to a peak of $238.2 million in 2012, with 2014 sales at $194.8 million. · Operating Costs: Costs increased from $87.3 million in 2010 to $166.2 million in 2014, excluding depreciation and royalties. · C1 Cash Costs: Re-visualizes the cost-per-pound data against production volume.
Slide 25: Conclusion and Yield Comparison
The final slide summarizes the investment thesis: an operating mine with no development risk, favorable logistics, and a long life (15+ years). The standout feature is the 'Attractive Yield/Risk Profile' table. It compares Cobre del Mayo's bonds (COBREM 10 3/4) with a 16.4% Yield to Maturity (YTM) against peers. Even though Cobre del Mayo has a B3/B rating (similar to Taseko Mines), its yield is higher, suggesting it is 'substantially wide of any reasonable comparable.' This is a direct call to action for investors looking for higher returns in the same risk bracket.
What Cobre del Mayo Does Well
The deck is exceptionally transparent with its unit economics. In the mining industry, the cost per pound is the only metric that truly matters for long-term survival, and Cobre del Mayo provides five years of historical data to prove they are trending in the right direction. The use of the Wood Mackenzie cost curve (Slide 10) provides essential industry context that prevents the company's data from existing in a vacuum. Furthermore, the inclusion of the 'Relevant Agreements' slide (Slide 13) addresses the two biggest fears of mining investors: land rights and off-take (selling the product). By showing 50-year concessions and 100% pre-sold production, they effectively neutralize these concerns.
What is Missing from the Deck
The most glaring omission is a Team or Management slide . In a 25-slide deck, failing to introduce the leadership team, their years of experience in the Mexican mining sector, or their previous successes is unusual. Investors are not just buying a mine; they are buying the management's ability to keep costs down and navigate local labor relations (which are mentioned as 'good' on Slide 25 but not detailed). Additionally, there is no Environmental, Social, and Governance (ESG) section. While this was 2015, mining operations even then were under scrutiny for water usage and community impact; the deck focuses purely on the mechanical and financial aspects, ignoring the social license to operate.
What Other Founders Should Copy
Founders in capital-intensive industries (energy, manufacturing, infrastructure) should study Slide 7 and Slide 10. Slide 7's ability to simplify a complex industrial process into a single-page flow is excellent for orienting non-technical investors. Slide 10's use of a 'Cost Curve' is a powerful way to show competitive advantage. If you can prove you are in the lower half of the cost curve for your industry, you are effectively proving your business can survive a market downturn. Finally, the 'Comparable Issuers' table on Slide 25 is a masterclass in positioning; it doesn't just say 'we are good,' it says 'we are better than these four specific companies you already know.'
Frequently asked questions
- What is the primary product of Cobre del Mayo?
- Based on the operational flowcharts and financial summaries, the company produces copper cathodes and copper contained in ore. Slide 13 notes that 100% of the 2015 cathode production was pre-sold to two commodity traders, and Slide 22 shows that cathode production reached a peak of 84.1 tons per day (tpd) in 2012 before settling at 75.0 tpd in early 2015.
- How does the company manage its mining rights?
- Slide 13 details that the company has exclusive rights to 30 mining concessions. 25 are owned by PV (Piedras Verdes), while 5 are owned by Grupo Rexgo. The Rexgo concessions involve a 3% net sales royalty. These concessions have long-dated expiration dates ranging from 2043 to 2062, ensuring long-term operational stability.
- What are the company's unit economics regarding copper production?
- The deck focuses on 'C1 Cash Cost' as the primary metric. According to Slide 10, the company achieved a C1 cash cost of $2.30/lb in the 1Q15 LTM period. When including sustaining capex, the Life of Mine (LOM) cost is projected at $1.83/lb, placing it around the 50th to 60th percentile on the global cost curve.
- Who are the main competitors mentioned in the deck?
- The deck does not list operational competitors for market share but rather 'Comparable Issuers' for investment risk. Slide 25 lists Hudbay, Taseko Mines, Thompson Creek, and Imperial Metals. Cobre del Mayo uses these to show that its bonds offer a higher Yield to Maturity (16.4%) for a similar B3/B credit rating.
- What is the stated investment in the mine's infrastructure?
- Slide 7 states that $302.9 million in capital expenditure (capex) has been invested since 2009. The company emphasizes that the heavy lifting of development is complete, with limited sustaining capex of approximately $13 million per year required for the remainder of the Life of Mine (LOM).