Cardiff International, Inc. (CDIF) presents a pitch deck centered on its role as a public holding company providing exit strategies for private firms. Operating on the OTCQB with a market cap of $5.8 million at the time of the presentation, the company highlights a rapid revenue jump from $100k in 2015 to a projected $17M+ in 2017. The strategy relies on acquiring profitable subsidiaries—ranging from Italian ice to cycle finance—using a tax-free exchange of preferred stock. While the deck provides clear acquisition mechanics and historical stock price growth, it lacks specific details on the…
Key takeaways
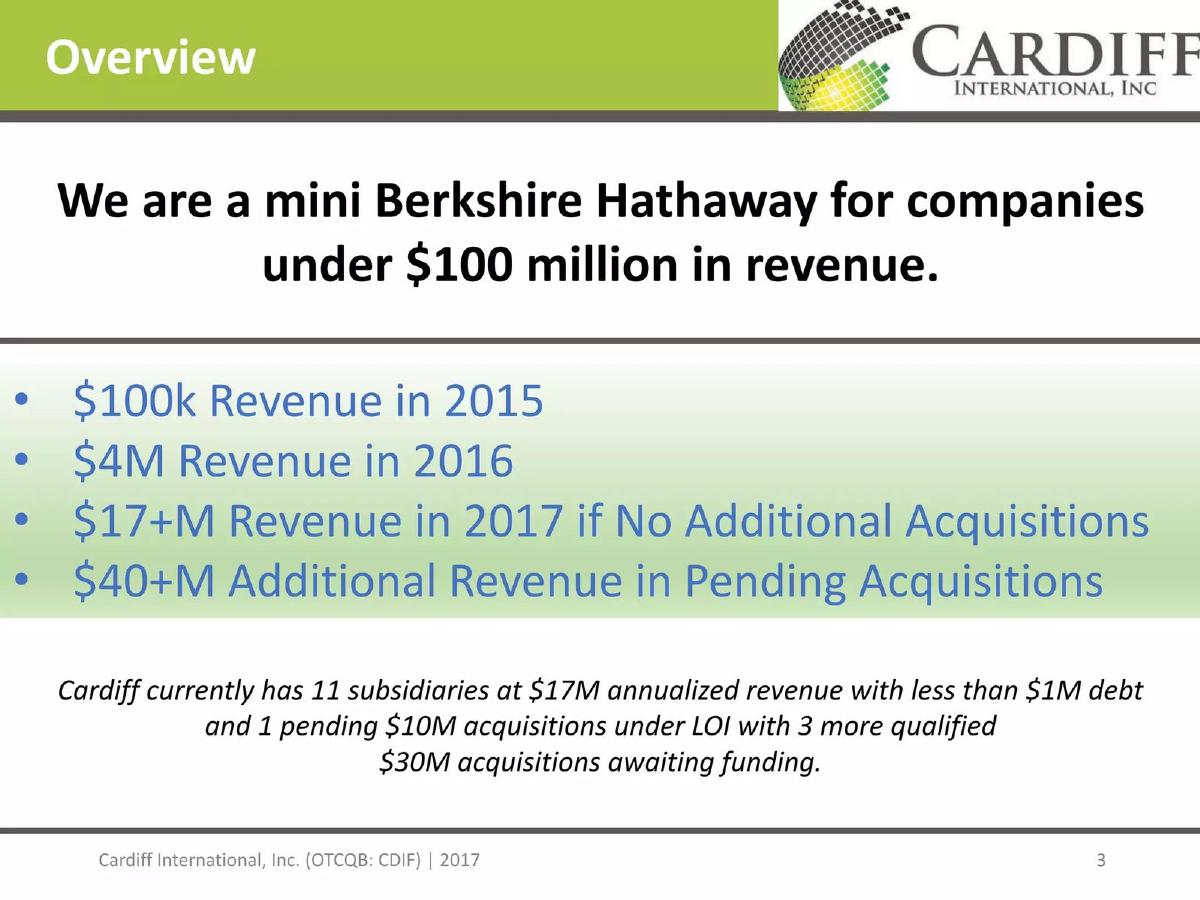
- The company identifies as a 'mini Berkshire Hathaway' specifically for businesses generating less than $100 million in revenue (Slide 3).
- Revenue growth is the primary narrative, showing a leap from $100k in 2015 to $4M in 2016, with a 2017 target of $17M+ without further acquisitions (Slide 3).
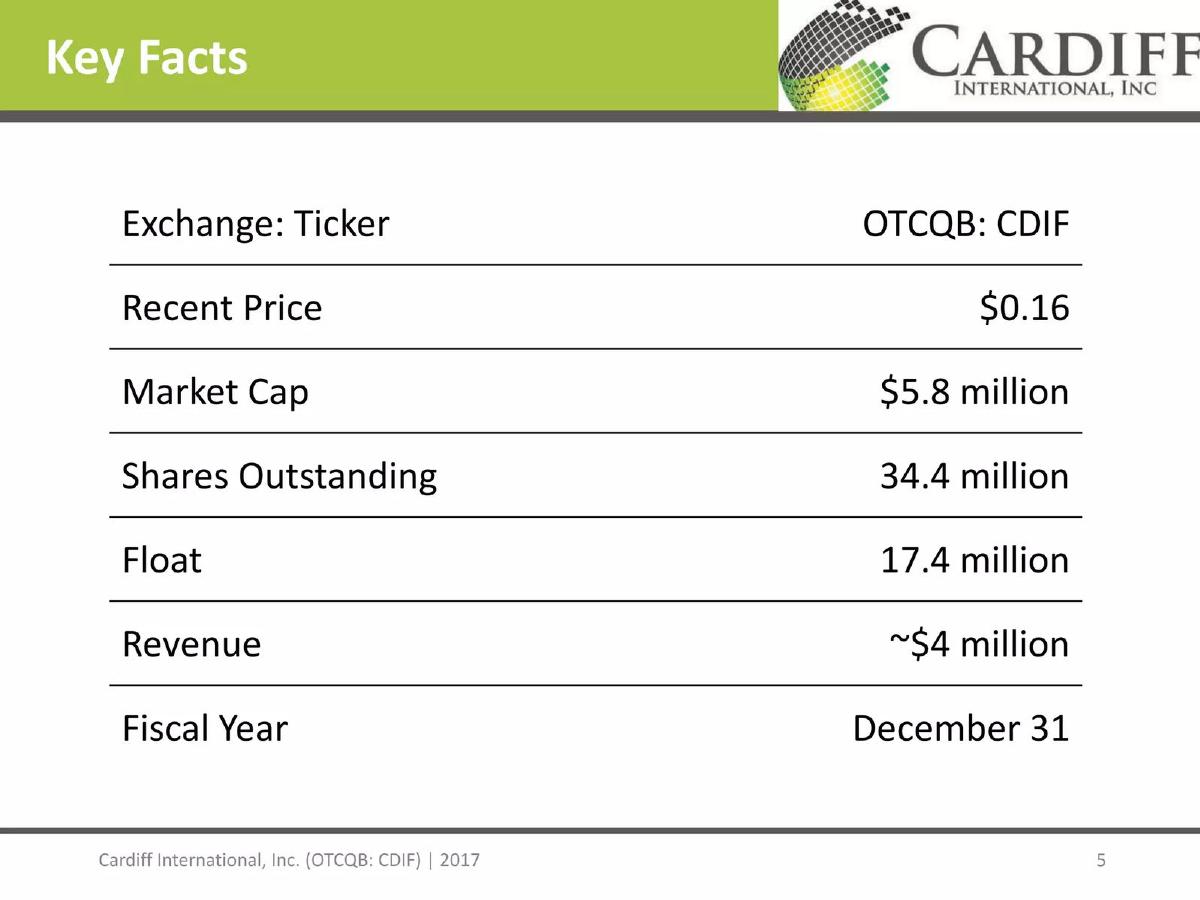
- At the time of the deck, CDIF traded on the OTCQB at $0.16 per share with a $5.8 million market cap (Slide 5).
- The portfolio is highly diversified, including Repicci’s Italian Ice, American Cycle Finance, and Romeo’s Pizza (Slide 7).
- The acquisition model uses IRS Section 368(a)1(B) guidelines for tax-free exchanges of preferred stock for 100% of the target's 'vote and value' (Slide 13).
- Cardiff claims to maintain operational autonomy for its subsidiaries, ensuring assets are not co-mingled (Slide 13).
- The corporate outlook projected a year-end 2017 market cap of $100M, a significant increase from the then-current $5.8M (Slide 15).
- The investment ask includes a $25k minimum for accredited investors, offering a 20% discount on stock and a 1:1.5 conversion rate (Slide 17).
Executive Summary and Value Proposition
Slide 1: Title Slide
The deck opens with the Cardiff International, Inc. logo and its OTCQB ticker: CDIF. The company defines itself as a 'Public Holding Company Providing Private Companies an Equity Exit Strategy and Equity Capitalization Platform.' The inclusion of the ticker immediately signals that this is a public micro-cap play rather than a traditional private startup pitch.
Slide 3: Overview
Cardiff uses a bold comparison, stating, 'We are a mini Berkshire Hathaway for companies under $100 million in revenue.' This slide focuses heavily on revenue growth. It lists $100k revenue in 2015, $4M in 2016, and a projection of $17M+ in 2017 assuming no further acquisitions. It also mentions $40M+ in additional revenue from pending acquisitions. The footer notes that Cardiff has 11 subsidiaries and less than $1M in debt, with $30M in acquisitions awaiting funding.
Market Position and Portfolio
Slide 5: Key Facts
This slide provides a snapshot of the company's public market standing. As of the presentation date in 2017, the recent price was $0.16, with a market cap of $5.8 million. There were 34.4 million shares outstanding and a float of 17.4 million. Revenue is listed at approximately $4 million, aligning with the 2016 figures mentioned earlier in the deck.
Slide 7: Current Holdings
The portfolio is highly diverse, suggesting a conglomerate strategy. Holdings include:
Repicci’s Italian Ice & Gelato: $3M revenue run-rate. · American Cycle Finance: $17M revenue run-rate. · CSSC/Decision Technology Corp.: $10M revenue run-rate. · Romeo’s Pizza: $800K revenue run-rate. · Affordable Housing Initiative: $400K revenue run-rate. · Edge View Properties: 30 acres of commercial real estate. · Mission Tuition: A merchant shopping network.
The discrepancy between the $17M total run-rate mentioned on Slide 3 and the individual run-rates here (which sum to over $30M) suggests that some holdings may be partially owned or recently signed.
The Problem and Solution
Slide 9: Market Problem
Cardiff identifies a specific niche: profitable private companies in 'sub-prime markets.' The slide lists four struggles for these owners: finding a buyer, getting market value, securing growth financing, and reducing debt/operating costs. The visual aids include stock photos of a stressed businessman and an empty wallet, emphasizing the liquidity trap faced by small business owners.
Slide 11: Our Value Add
The company explains how it improves its subsidiaries. The value add includes improving balance sheets, novating debt, providing strategic guidance, and forming synergies. Most importantly, it claims to reduce risk by spreading it across the entire Cardiff portfolio and gaining economies of scale.
Operational Mechanics
Slide 13: Acquisition Process
This is a technical slide explaining the 'Qualified' Preferred Stock model. Cardiff uses a tax-free exchange under IRS Section 368(a)1(B) to acquire 100% of the 'vote and value' of a company's stock. The slide emphasizes that acquisition assets are not co-mingled and that operational autonomy is maintained for the original founders. This is a key selling point for business owners who want liquidity without losing control of daily operations.
Slide 15: Corporate Outlook
The outlook for 2017 is aggressive. Cardiff aims for $20M+ revenue with profitability. The most ambitious claim is the market cap projection: $15M by Q2 and $100M by year-end. The slide also mentions three near-term acquisition targets and a 'strong management team,' though no names or bios are provided on this slide.
The Investment Ask
Slide 17: Accredited Investor Offering
The final slide details the specific ask. There is a $25k minimum investment for accredited investors. The terms include a 20% discount on stock and a 1:1.5 conversion rate. The 'Use of Funds' is split between a $50M subsidiary asset acquisition, existing subsidiary expansion, and 'planning/positioning for NASDAQ.' A historical chart shows the stock price trending upward from $0.05 to over $0.40 between September 2016 and January 2017.
What Works Well in This Deck
The deck is very clear about its financial mechanics. By citing specific IRS codes and explaining the preferred stock exchange, Cardiff demonstrates a structured approach to acquisitions that goes beyond simple cash buyouts. The 'mini Berkshire' analogy is a strong hook that immediately explains the business model to an investor. Furthermore, the clear breakdown of revenue run-rates for each subsidiary allows investors to see exactly where the top-line growth is coming from.
What Is Missing
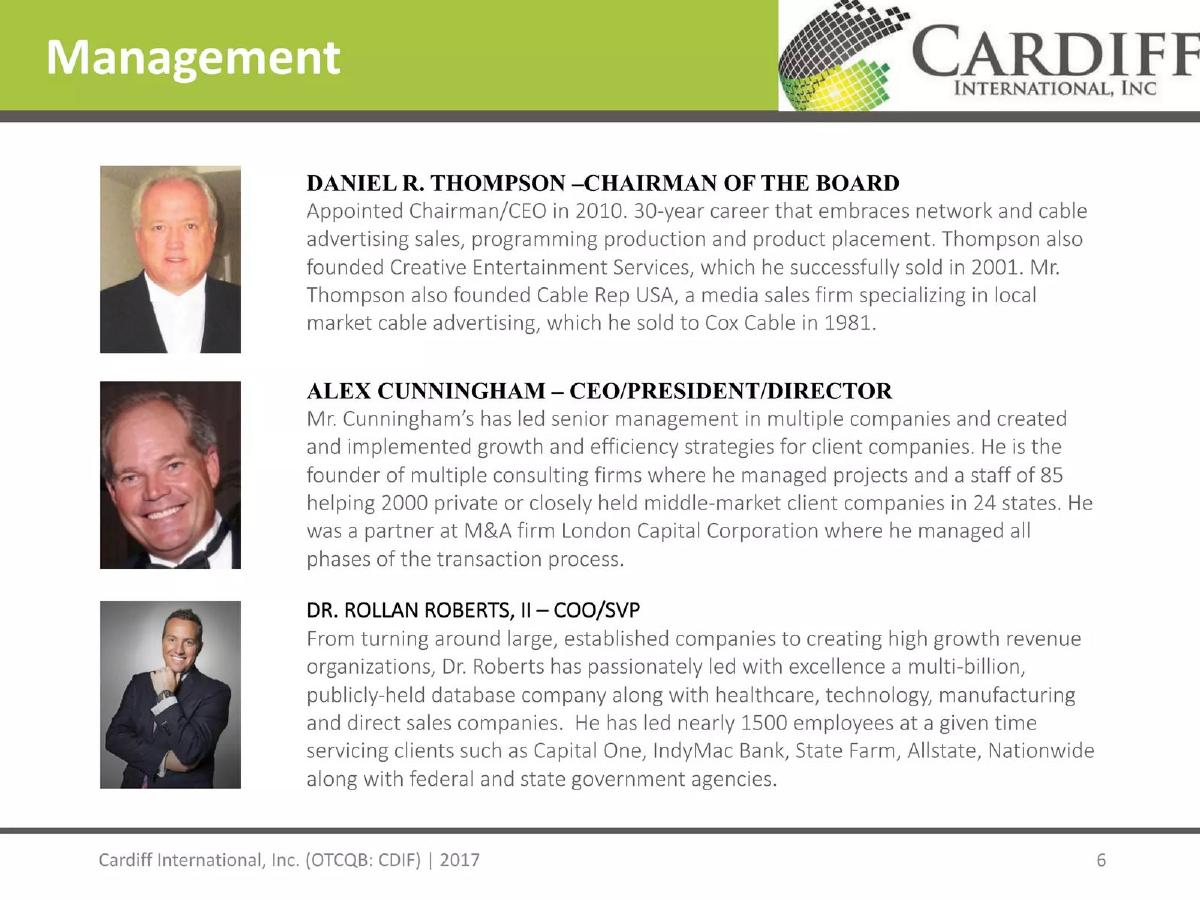
The most glaring omission is a team slide. In a holding company model, the ability of the leadership to pick winners and manage debt is everything. Without bios for the executives at Cardiff, an investor cannot verify the 'history of execution' claimed on Slide 15. Additionally, the deck mentions 'profitability' several times but never provides a consolidated EBITDA or net income figure. Revenue is a vanity metric in a roll-up if the cost of debt or the losses of the subsidiaries outweigh the top-line gains. Finally, there is no mention of the competitive landscape—other micro-cap holding companies or private equity firms targeting the same sub-$100M revenue bracket.
Founder Takeaways
Founders of holding companies or roll-up platforms should take note of how Cardiff uses its public status as a tool for acquisition. The 'Equity Capitalization Platform' is a compelling pitch for small business owners who are 'asset rich but cash poor.' However, founders should be wary of making market cap projections as specific as those on Slide 15 ($100M by year-end), as these can be perceived as speculative in a professional investment environment. A better approach would be to focus on the underlying health and cash flow of the acquired assets.
Frequently asked questions
- What is Cardiff International's core business model?
- Cardiff International acts as a public holding company that acquires profitable private companies. According to Slide 1, it provides these companies with an equity exit strategy and a capitalization platform. It targets companies in 'sub-prime markets' that struggle to find buyers or secure growth financing, rolling them into a consolidated public entity to gain economies of scale and improve balance sheets.
- How does the company acquire new subsidiaries?
- The acquisition process follows a six-step path: Valuation, LOI, Due Diligence, Agreement Execution, Audit, and Shares Issued. Slide 13 specifies that they issue 'Qualified' Preferred Stock in exchange for 100% of the target company's stock. This is structured under IRS Section 368(a)1(B) as a tax-free exchange, allowing the acquired company to maintain operational autonomy while being added to Cardiff's consolidated balance sheet.
- What industries does Cardiff invest in?
- The portfolio is sector-agnostic. Slide 7 lists seven current holdings: Repicci’s Italian Ice & Gelato ($3M run-rate), American Cycle Finance ($17M run-rate), CSSC/Decision Technology Corp ($10M run-rate), Romeo’s Pizza ($800K run-rate), Affordable Housing Initiative ($400K run-rate), Edge View Properties (commercial real estate), and Mission Tuition (a merchant shopping network).
- What are the financial terms for new investors?
- Slide 17 outlines an 'Accredited Investor Offering' with a $25,000 minimum investment. The terms include a 1:1.5 conversion rate, a 20% discount on the stock price, a 'make whole' provision, and warrants. The company uses a historical chart showing the stock price rising from under $0.1 in September 2016 to approximately $0.4 by January 2017 to support the offering.
- What are the main risks or omissions in this deck?
- The deck lacks a dedicated 'Team' slide detailing the specific professional backgrounds of the management team, despite Slide 15 claiming a 'strong management team with a history of execution.' Additionally, while revenue run-rates are provided for subsidiaries, there is no data on net profitability or margins for the individual units, making it difficult to assess the quality of the 'profitable' companies being acquired.