Front’s Series A deck is a benchmark for data-driven storytelling. Raising $10M in 2016, the company leaned heavily into its operational efficiency and product-led growth. The deck excels by showing, not just telling; it includes a detailed cohort analysis showing 150% annual expansion and a breakdown of shared inbox types that served as their market wedge. By highlighting that 60% of payroll went to engineering while maintaining zero support agents, Front signaled a high-leverage, product-first culture. The narrative positions Front as the 'external' counterpart to Slack’s internal dominance…
Key takeaways
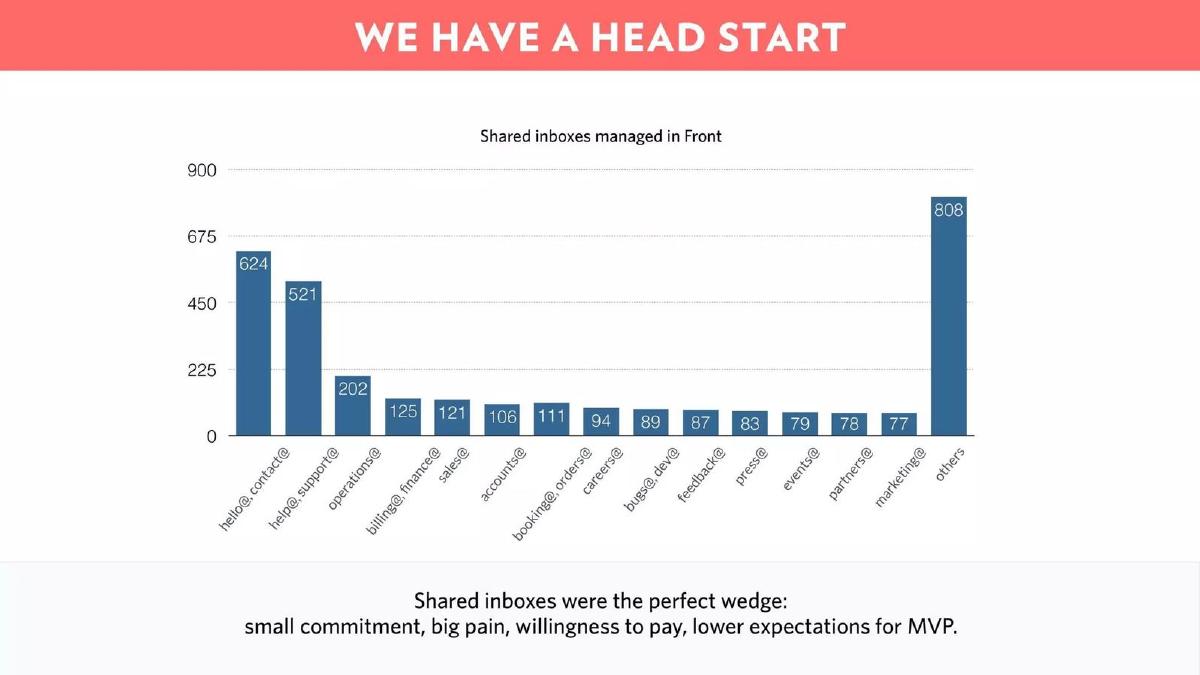
- Front utilized shared inboxes like 'hello@' and 'support@' as a low-friction wedge to enter companies (Slide 5).
- The company demonstrated exceptional capital efficiency, spending only $1.3M to reach $1.4M in ARR (Slide 13).
- A detailed cohort retention table proves a 'land and expand' strategy with 150% annual expansion (Slide 12).
- Product-led growth is emphasized by the fact that 60% of payroll is dedicated to engineering with zero support agents (Slide 10).
- The deck reports a 5.4x MRR growth over the 12 months leading up to the pitch (Slide 8).
- Front maintains a low monthly user churn of approximately 3% and achieves negative net MRR churn (Slide 9).
- The sales process is highly efficient, with AEs adding $36k in ARR per month and a 28% post-demo conversion rate (Slide 11).
- Strategic alignment is signaled by committed investment from industry leaders Stewart Butterfield (Slack) and Eoghan McCabe (Intercom) (Slide 18).
Introduction: The Transparency Standard
Front’s Series A deck is widely regarded as one of the most transparent and effective examples of a SaaS pitch. At the time of this raise in 2016, Front was seeking $10M to scale a platform that reimagined the email inbox as a collaborative workspace. Unlike many decks that obscure hard numbers behind percentages, Front shared exact MRR, burn rates, and retention cohorts. This teardown examines how they structured their data to prove that their 'shared inbox' wedge was a viable path to dominating external business communications.
The Problem and Solution (Slides 1-3)
Slide 1 introduces the core value proposition: 'All your company’s external communications in one collaborative inbox.' This is a tight, focused opening that identifies the product's function and its primary target (external comms).
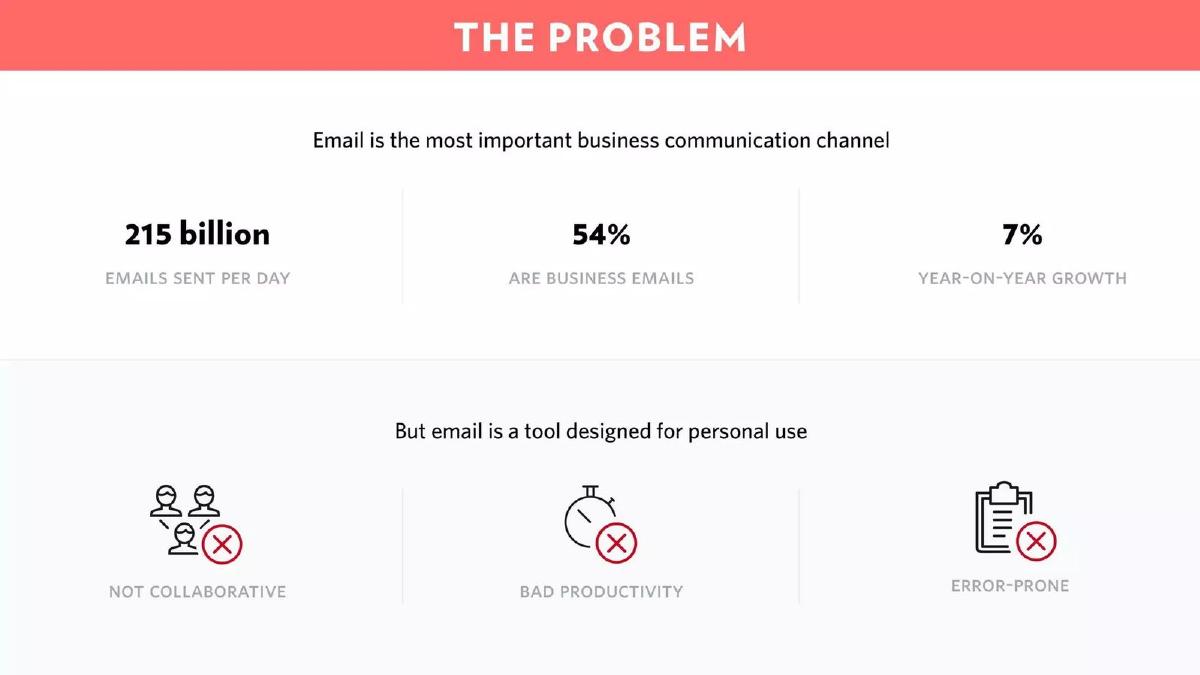
Slide 2 establishes the market size and the friction. It cites that 215 billion emails are sent per day, with 54% being business emails, growing at 7% year-over-year. The 'Problem' is framed as a tool mismatch: email was designed for personal use, making it 'not collaborative,' 'error-prone,' and bad for productivity in a professional setting.
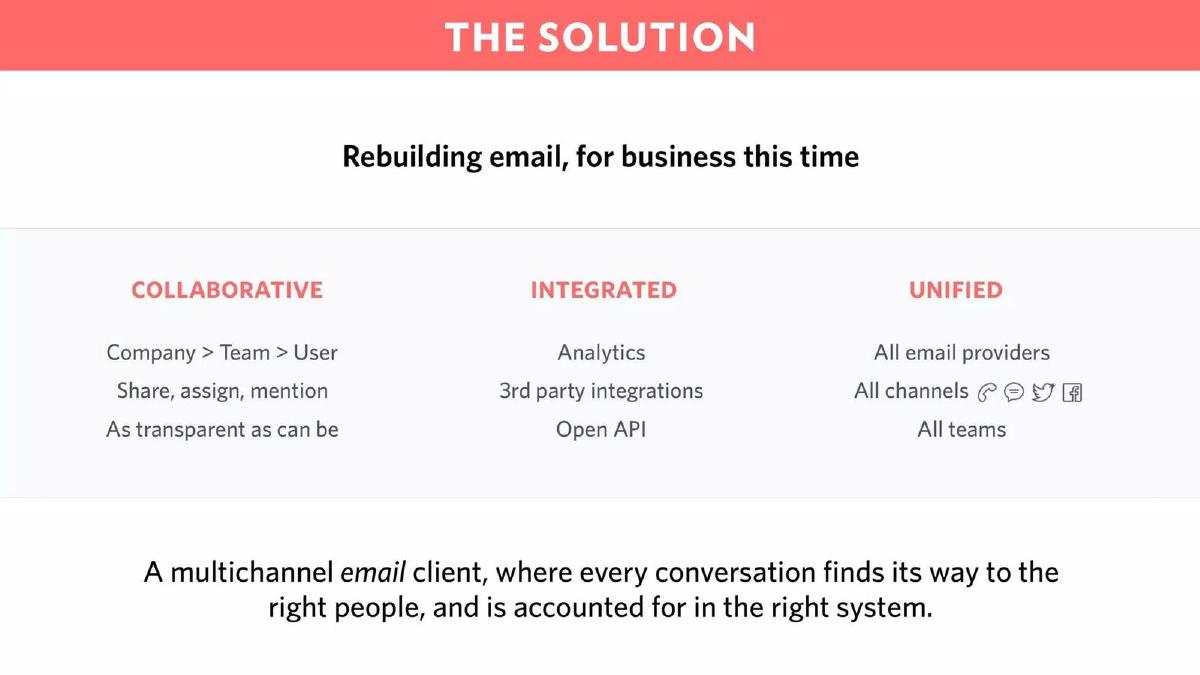
Slide 3 presents the solution as 'Rebuilding email, for business this time.' They categorize the solution into three pillars: Collaborative (share, assign, mention), Integrated (analytics, API), and Unified (all channels like Twitter, Facebook, and SMS in one place). This slide effectively transitions from a simple email client to a 'multichannel email client' that acts as a system of record.
Market Positioning and The Wedge (Slides 4-5)
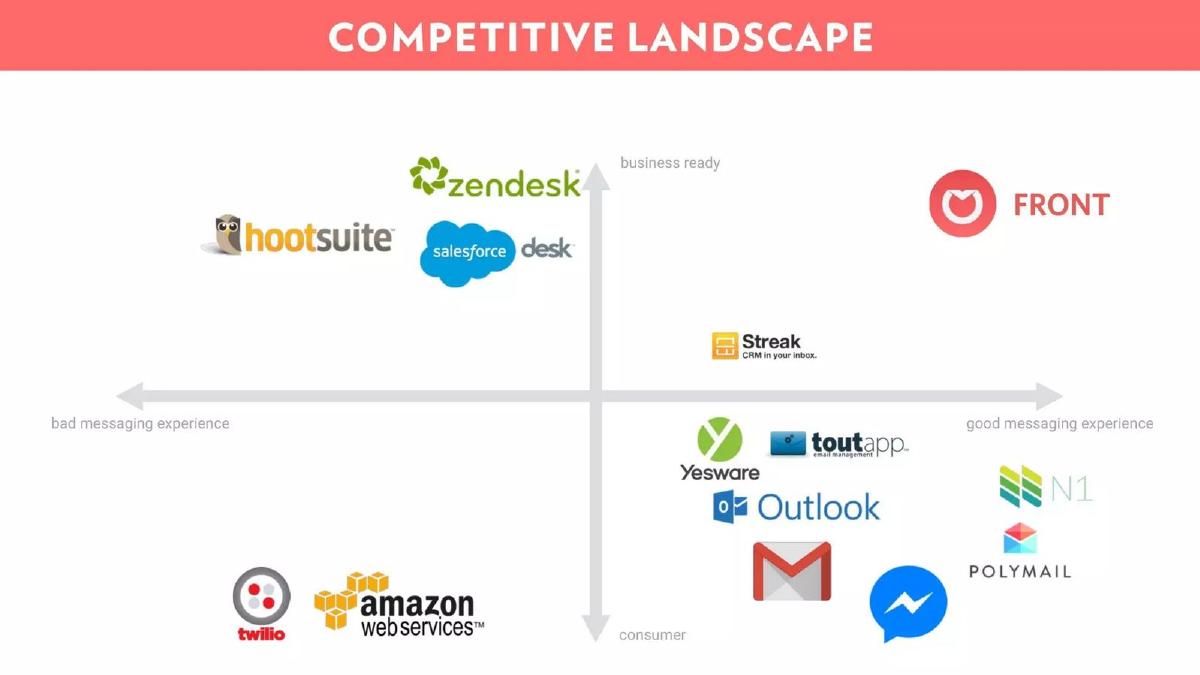
Slide 4 uses a standard competitive landscape matrix. Front differentiates itself by claiming the high ground in both 'messaging experience' (beating legacy helpdesks like Zendesk and Salesforce Desk) and 'business readiness' (beating consumer tools like Gmail and Outlook). This positioning is crucial because it justifies why a company would pay for Front when they already have a 'free' email provider.
Slide 5 is one of the most insightful slides in the deck. Titled 'We Have a Head Start,' it shows a bar chart of shared inboxes managed in Front. By showing that 'hello@' (624) and 'support@' (521) are their primary entry points, they prove the 'wedge' strategy. They explicitly state that shared inboxes are the perfect entry point because they have 'small commitment, big pain, willingness to pay, [and] lower expectations for MVP.'
Social Proof and Traction (Slides 6-9)
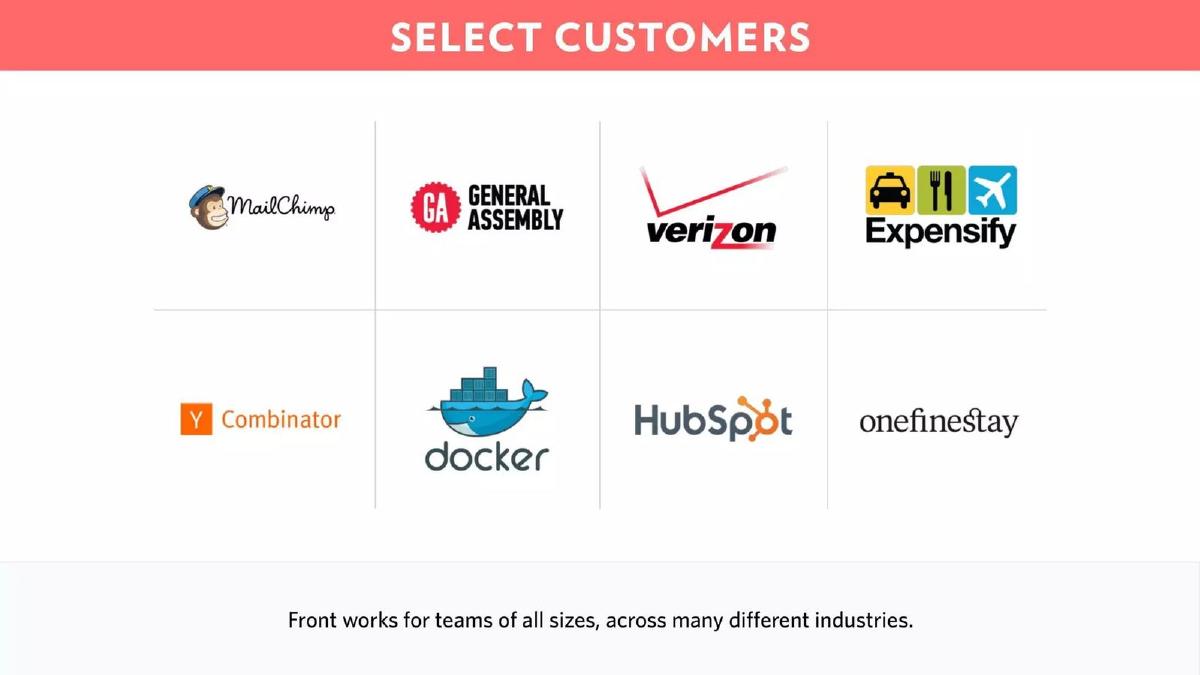
Slide 6 displays a 'Select Customers' list including MailChimp, Verizon, and HubSpot. This provides immediate enterprise and mid-market credibility.
Slide 7 reinforces this with testimonials. A quote from a 100-seat customer (Bellhops) and a 20-seat customer (Baroo) shows the product scales across different team sizes. The mention of MailChimp using it across four different teams hints at the internal expansion potential.
Slide 8 shows 'Consistent Organic Growth.' The chart tracks MRR and the number of companies from June 2014 to March 2016. The key takeaway here is that MRR grew 5.4x in the 12 months preceding the deck, reaching approximately $100k MRR (or $1.2M ARR) by the end of the chart.
Slide 9 focuses on 'Low Churn.' They report ~3% monthly user churn and, more importantly, 'negative net MRR churn.' This is the 'holy grail' of SaaS metrics, indicating that expansion revenue from existing customers outweighs the revenue lost from departing customers.
Operational Excellence and Acquisition (Slides 10-11)
Slide 10 , 'The Product Comes First,' highlights their lean operational model. They reveal that 60% of their payroll goes to engineering and they have zero support agents. This suggests that the product is intuitive enough to be self-serving and that the company is prioritizing building over-servicing—a high-leverage trait for VCs.
Slide 11 breaks down their three acquisition channels: Organic (70% of leads), Sales (28% post-demo conversion), and Marketing. The sales metrics are particularly strong, noting that each Account Executive (AE) adds $36k in ARR per month. This provides a clear 'money in, growth out' formula for the Series A capital.
The 'Land and Expand' Proof (Slide 12)
Slide 12 is the 'Land and Expand' cohort table. It shows the percentage of MRR retained relative to the starting month for every cohort since June 2014. Most cells are well over 100%, with some reaching 200%+. They even include 'Stripe error' and 'Homejoy shutdown' as annotations to explain specific dips, which builds immense trust through honesty. They claim a 150% annual expansion rate, proving that once they get a 'wedge' in a company, they grow rapidly within it.
Financial Efficiency and The Ask (Slides 13-15)
Slide 13 highlights capital efficiency. Front spent only $1.3M to reach $1.4M in ARR. They also note they have $1.8M left from their seed round, meaning they aren't raising out of desperation but to accelerate. Their monthly burn was a modest $90k, and they were only five months away from profitability.
Slide 14 is a simple transition slide: 'Raising $10M Series A to Accelerate Growth.'
Slide 15 introduces the team. Mathilde Collin (CEO) and Laurent Perrin (CTO) highlight their Y Combinator background and education (HEC Paris, Polytechnique). They also emphasize their 'unfair access to a pool of excellent French engineers' and key hires from Box and Dropbox.
Roadmap and Projections (Slides 16-17)
Slide 16 lays out a clear product roadmap. It categorizes future work into New Platforms, New Integrations, New Channels (Messenger, WeChat, WhatsApp), and Enterprise Ready features (SSO, SLAs). This shows a clear path from a SMB tool to an enterprise-grade platform.
Slide 17 provides financial projections. They projected reaching $3M ARR in 2016 and $10M ARR in 2017. The chart shows revenue (MRR) growing faster than expenses, illustrating the path to a high-margin business.
The Strategic Opportunity (Slides 18-19)
Slide 18 lists their funding history. They raised a $3.1M Seed in 2014. For the Series A, they already had commitments from Stewart Butterfield (CEO of Slack) and Eoghan McCabe (CEO of Intercom). This is a massive signal; the leaders of the internal and customer-facing communication markets were backing Front.
Slide 19 concludes with 'The Opportunity.' They compare themselves to Slack, noting that while Slack owns internal communications, Front intends to 'own the external communications space,' which they argue is a 'bigger opportunity.'
What Works in This Deck
Extreme Data Transparency: By showing the cohort table (Slide 12) and the exact spend-to-ARR ratio (Slide 13), Front removes all ambiguity about their performance. · The Wedge Narrative: Slide 5 explains exactly how they enter a company. This makes the growth story feel repeatable and logical rather than accidental. · Efficiency Metrics: Highlighting 'Zero Support Agents' (Slide 10) and '$36k ARR added per month per AE' (Slide 11) demonstrates a highly optimized business machine. · Strategic Signaling: Having the founder of Slack as a committed investor (Slide 18) for a communication tool is the ultimate validation of the 'Slack for external comms' thesis.
What Is Missing
Market Size (TAM) Detail: While they mention the number of emails sent (Slide 2), they don't provide a bottom-up TAM calculation in dollars. They rely on the Slack comparison to imply a massive market. · Unit Economics (LTV/CAC): While they provide the ingredients for these metrics, they don't explicitly state the Lifetime Value or the Customer Acquisition Cost. · Detailed Competitor Feature Comparison: The competitive matrix (Slide 4) is high-level. A more detailed breakdown of why they win against specific incumbents like Zendesk in a sales cycle was omitted.
What a Founder Should Copy
The Cohort Table: If your retention is good, show the raw cohort data. It is the most convincing way to prove product-market fit. · The 'Wedge' Slide: Don't just say you have customers; show which departments or use cases are your 'entry points.' It proves you understand your own sales motion. · Capital Efficiency Stats: In a Series A, showing how much ARR you generated per dollar spent (Slide 13) is a powerful indicator of founder discipline and business quality. · Annotating Data Dips: If your data has a bad month, annotate it (like the 'Stripe error' on Slide 12). It prevents investors from wondering if the business is failing and shows you are on top of your metrics.
Frequently asked questions
- What was the specific 'wedge' strategy Front used?
- Front identified shared inboxes (e.g., info@, team@) as the perfect entry point. These addresses represent high-pain collaboration points but require a small initial commitment from the customer. Slide 5 shows that 'hello@' and 'support@' were their most frequent starting points, allowing them to prove value before expanding to other departments.
- How did Front demonstrate product-market fit in this deck?
- They used a combination of quantitative and qualitative data. Quantitatively, Slide 12 shows a 'Land and Expand' cohort table where almost every cohort grows significantly over time. Qualitatively, Slide 7 features testimonials from high-growth companies like MailChimp and Bellhops, specifically mentioning that users 'wouldn’t go back to Gmail' if paid to do so.
- What were Front's unit economics at the time of the Series A?
- While the deck doesn't explicitly state LTV/CAC ratios, Slide 11 provides the components: 70% of leads were organic, and Account Executives (AEs) were adding $36k in ARR per month. Combined with the negative net MRR churn shown on Slide 9, these metrics suggest highly favorable unit economics and a very short CAC payback period.
- How did Front position itself against competitors like Zendesk or Gmail?
- On Slide 4, Front uses a 2x2 matrix with 'Messaging Experience' and 'Business Ready' as the axes. They positioned themselves in the top-right quadrant, arguing that while Gmail has a good experience, it isn't 'business ready' for teams, and while Zendesk is business ready, it offers a 'bad messaging experience' compared to a native email client.
- What was the primary use of the $10M Series A funds?
- The deck states the goal is to 'accelerate growth.' Slide 17 shows a projected headcount increase from 39 to 53 and an ARR target of $10M for 2017. The roadmap on Slide 16 suggests heavy investment in new platforms (Android, Mac), integrations (NetSuite, Marketo), and enterprise-ready features like SSO and SLAs.