The Front Series D pitch deck is a lean, 12-slide presentation that successfully raised $65M in 2022. Unlike early-stage decks that must prove product-market fit, this deck focuses on the compounding power of 'strong fundamentals' and a clear path toward becoming a universal collaboration layer. By leading with high-impact numbers—including 130%+ net retention and a 75% DAU/MAU ratio—Front establishes immediate credibility. The deck uses a sophisticated market quadrant to position itself at the intersection of high-stakes interactions and inbound communication, effectively carving out a space…
Key takeaways
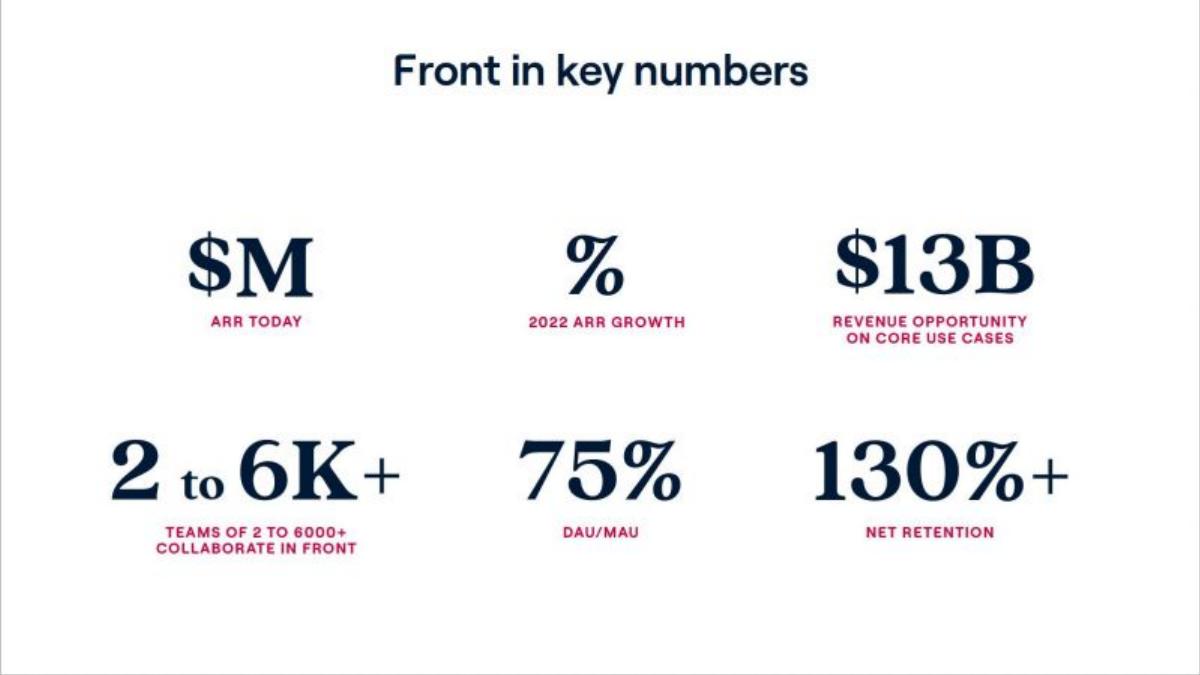
- Front reports a world-class net retention rate of 130%+ on slide 2.
- The company claims a 75% DAU/MAU ratio, indicating extremely high product stickiness (slide 2).
- The deck identifies a $13B revenue opportunity on core use cases alone (slide 2).
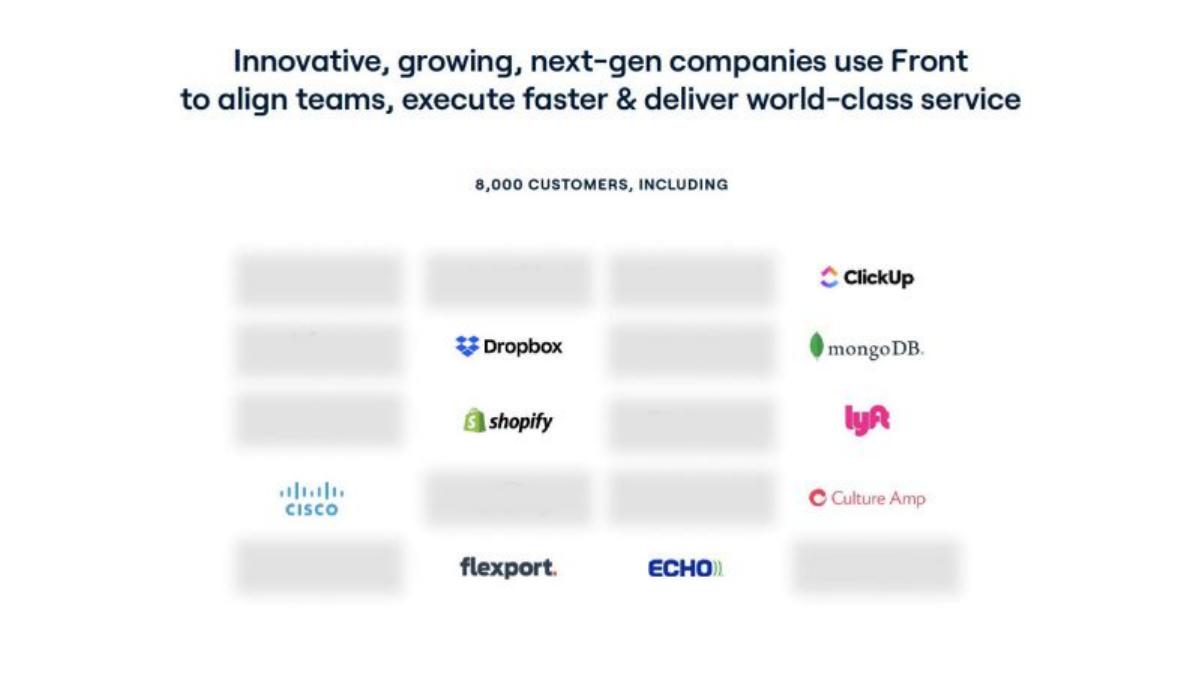
- Front services 8,000 customers, including major brands like Shopify, Dropbox, and Cisco (slide 3).
- The sales narrative focuses on winning against 'underpowered' email (60% of deals) and 'siloed' ticketing (40% of deals) as shown on slide 7.
- Net New ARR (NNARR) grew by 120% year-over-year leading into the raise (slide 8).
- The product vision expands from a communication hub for customer-facing teams to a platform for all knowledge workers (slide 9).
- The deck highlights a history of capital-efficient growth, though specific dollar amounts for spend vs. ARR added are redacted on slide 10.
The Series D Narrative: Scale and Efficiency
Front’s Series D deck, dated March 2022, is a masterclass in brevity. At just 12 slides, it avoids the fluff of early-stage storytelling and moves straight to the industrial-strength metrics required for a $65M round. The deck is structured to prove three things: the business is incredibly sticky, the market is massive, and the growth is efficient.
Slide 1: Title Slide
The deck opens with a minimalist title slide featuring the Front logo and the date 'March 2022.' There is no tagline or mission statement here; the brand is expected to speak for itself at this stage of maturity.
Slide 2: Front in Key Numbers
This is the 'money slide.' Front leads with its strongest evidence. While the ARR and growth percentages are represented by placeholders ($M and %), the surrounding metrics are elite. A 75% DAU/MAU (Daily Active Users to Monthly Active Users) ratio is exceptionally high for a B2B SaaS tool, suggesting the product is as habit-forming as a consumer social app. The 130%+ Net Retention is the gold standard for enterprise software, proving that existing customers are expanding their spend significantly year-over-year. They also anchor the pitch with a $13B revenue opportunity on core use cases.
Slide 3: Customer Social Proof
Front highlights its 8,000 customers . The slide uses a grid of logos, intentionally blurring some while highlighting 'next-gen' leaders like Shopify, Dropbox, ClickUp, MongoDB, Lyft, and Cisco . This mix of high-growth tech and established enterprise (Cisco) demonstrates broad market appeal.
Slide 4: Product Definition
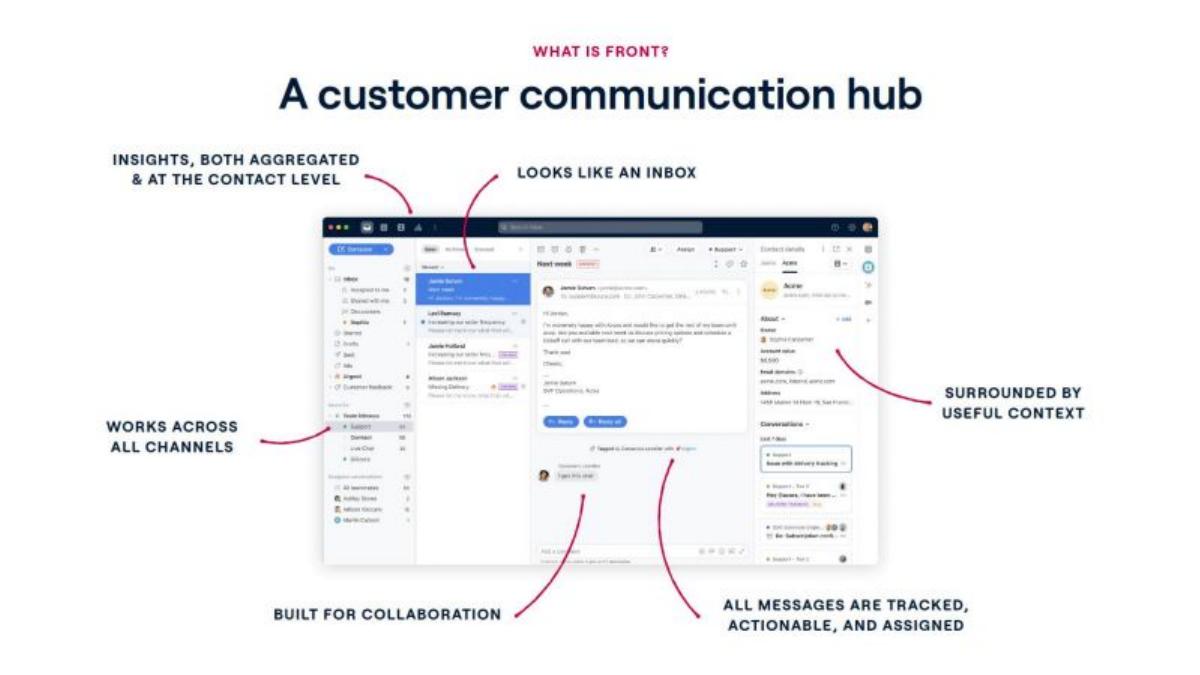
Slide 4 answers 'What is Front?' by calling it a 'customer communication hub.' The slide features a screenshot of the interface with callouts. Key features highlighted include: 'Works across all channels,' 'Built for collaboration,' and 'Surrounded by useful context.' It positions the UI as something that 'looks like an inbox' but functions as a collaborative engine where all messages are 'tracked, actionable, and assigned.'
Slide 5: Market Positioning
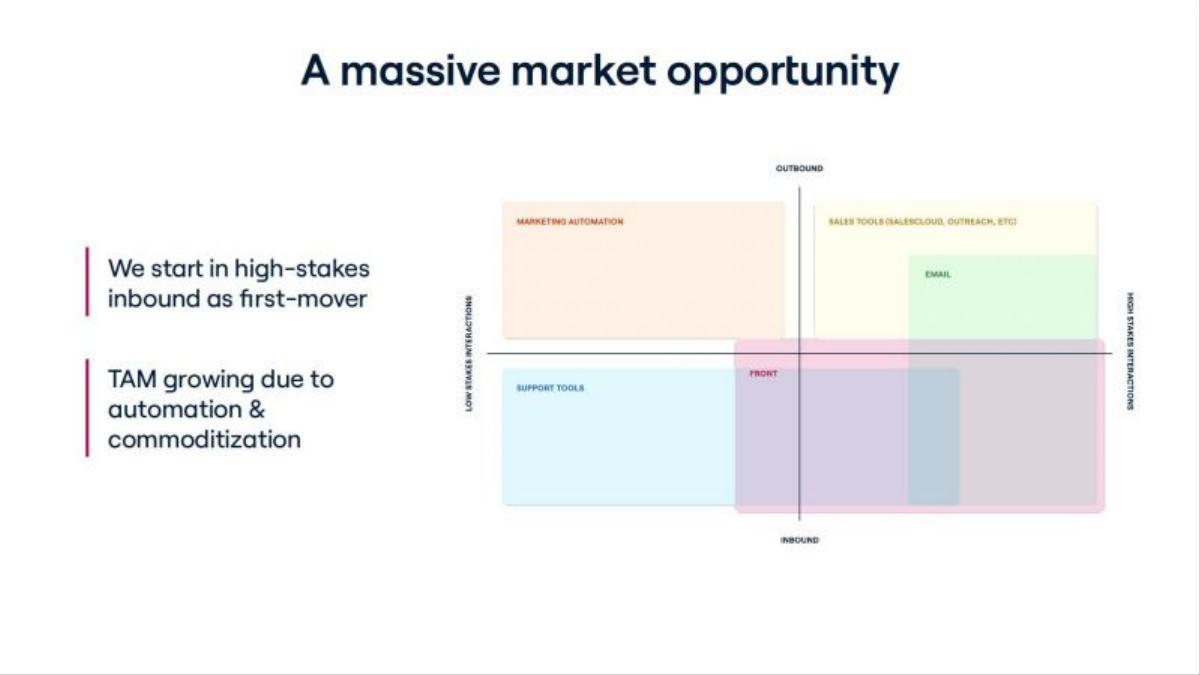
The 'Massive Market Opportunity' is visualized through a quadrant. Front plots itself in the bottom-right: High Stakes Interactions / Inbound . This is a strategic choice. They argue that while sales tools handle outbound and support tools handle low-stakes inbound, Front owns the high-value inbound conversations that drive revenue and retention. They note that the TAM is growing due to automation and commoditization of lower-stakes tools.
Slide 6: Use Case Deep Dive
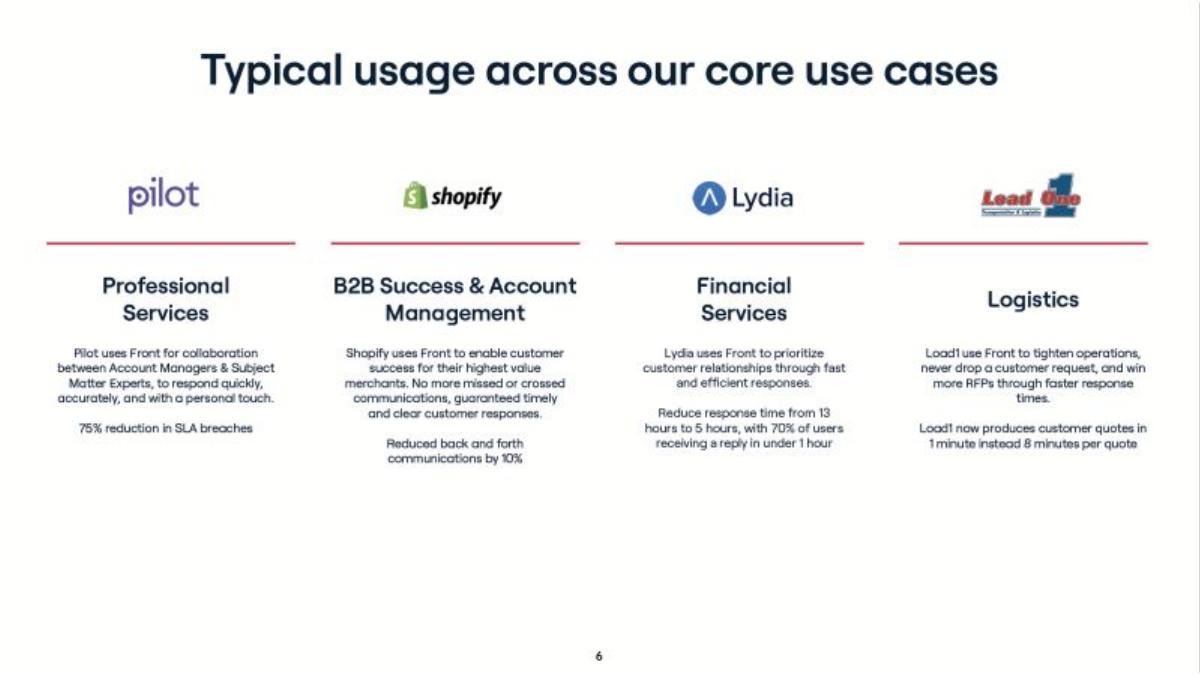
This slide provides vertical-specific proof points. For Professional Services (Pilot) , they show a 75% reduction in SLA breaches. For Logistics (Load1) , they highlight that customer quotes are produced in 1 minute instead of 8. This variety proves that Front isn't just a 'tech company tool' but a core operational layer for diverse industries.
Slide 7: Competitive Landscape
Front identifies its two primary competitors: Email (60% of deals) and Ticketing (40% of deals) . The slide is a classic 'best of both worlds' argument. Front claims to bring the collaboration and analytics that email lacks, while maintaining the 'natural conversational experience' that rigid ticketing systems destroy. The tagline at the bottom is bold: 'Front blows up silos to unlock unparalleled productivity.'
Slide 8: Growth Fundamentals
This slide uses four charts to show momentum. 1) The DAU/MAU ratio is trending upward from 2018 to 2021. 2) Gross Retention (GRR) and Net Retention (NRR) are both shown as high, stable lines. 3) Net New ARR (NNARR) grew 120% YoY. 4) Average seat count in top 50 customers shows a steep upward curve, proving that Front is 'landing and expanding' into larger enterprise deployments.
Slide 9: The Ambitious Vision
Front moves from what it is today to what it will become. The vision is a three-step progression: 1) Communication hub for customer-facing teams, 2) Communication hub for all knowledge workers, and 3) The platform for collaboration that connects teams, apps, and objects. The end goal is to be the 'collaboration layer for all knowledge workers.'
Slide 10: Team and Efficiency
The 'Built for the long run' slide focuses on three pillars. First, 'Intense Internal Commitment' (showing a 4.8 Glassdoor rating and 100% CEO approval). Second, 'Capital Efficient Growth' (though the specific $Xm spent for $Ym ARR added is redacted). Third, the Executive Team , featuring the CRO, CFO, CPO, and Chief People Officer. This emphasizes that the company has the 'adult supervision' and leadership infrastructure required for a late-stage company.
Slide 11 & 12: Closing
The deck ends with a simple 'Thank you' slide and a promotional slide for the source library. There is no 'Ask' slide in this version of the deck, which is common for Series D companies that share specific terms only in private data rooms.
What Works in This Deck
1. Metric Dominance: By leading with a 75% DAU/MAU and 130% NRR, Front makes the investment feel de-risked. These are top-decile SaaS metrics that immediately signal a 'winner' to VCs.
2. Clear Competitive Displacement: The pie chart showing that 60% of their deals come from displacing email is powerful. It frames the competition not as another startup, but as a legacy behavior that everyone agrees is broken.
3. Vertical Versatility: The case studies on slide 6 are excellent. They show that Front solves 'hard' business problems (logistics, finance) rather than just 'soft' productivity problems.
What is Missing
1. The 'Ask': There is no mention of how much capital is being raised or what the specific use of funds will be. While common at Series D, it leaves the reader guessing about the scale of the round without external context.
2. Detailed Financials: While growth percentages are shown, the absolute scale of the business (actual ARR) is hidden behind placeholders. For a teardown, this makes it harder to assess the valuation multiple.
3. Product Roadmap: The vision slide is conceptual. There is no specific product roadmap or 'what's next' in terms of features to explain how they will move from 'customer-facing teams' to 'all knowledge workers.'
What Other Founders Should Copy
1. The 'Key Numbers' Slide: Every founder should have a slide like Slide 2. It forces you to identify the 6 most important metrics for your business and present them without distraction.
2. The 'How We Win' Slide: Slide 7 is a perfect template for competitive positioning. Don't just list features; explain the 'breeding' of your competitors (e.g., 'Ticketing breeds narrow silos') and how you counteract that specific DNA.
3. The Vision Progression: Slide 9 is an excellent way to show a massive TAM without looking unfocused. By showing a staged approach (Step 1, Step 2, Step 3), Front shows they have a plan to grow into their ambitious 'universal' vision.
4. Use Case Metrics: When presenting customers, don't just show logos. Follow Front's lead on Slide 6 and attach a specific, quantifiable business outcome to each logo. It turns a 'logo slide' into a 'value slide.'
Frequently asked questions
- What is the primary focus of Front's Series D deck?
- The primary focus is on 'Strong Fundamentals.' By Series D, investors are looking for proof of scale and efficiency. Front delivers this by highlighting 130%+ net retention, 120% NNARR growth, and a high DAU/MAU ratio. The deck spends less time on 'how' the product works and more time on the economic results of its usage across 8,000 customers.
- How does Front define its market opportunity?
- Front uses a 2x2 matrix on slide 5 to position itself in the 'High Stakes Interactions' and 'Inbound' quadrant. It differentiates itself from Marketing Automation (low stakes/outbound), Sales Tools (high stakes/outbound), and Support Tools (low stakes/inbound). This positioning allows them to claim a $13B core market opportunity.
- What competitive advantages does Front claim over email and ticketing?
- According to slide 7, Front wins against email by adding real-time collaboration and automation to a ubiquitous but underpowered medium. It wins against ticketing systems by offering a 'natural conversational experience' and 'familiar UI' that avoids the narrow silos typically created by traditional help desks.
- Is there a financial 'ask' or valuation mentioned in the deck?
- No. Typical of late-stage decks, the specific 'ask' (amount being raised) and valuation are omitted from the slides. These details are usually handled in the verbal pitch or a separate data room. The deck serves as the narrative hook to justify the investment thesis rather than a term sheet.
- How does Front demonstrate product-market fit across different industries?
- Slide 6 provides specific case studies across four distinct verticals: Professional Services (Pilot), B2B Success (Shopify), Financial Services (Lydia), and Logistics (Load1). Each case study includes a specific metric, such as a '75% reduction in SLA breaches' or 'quotes in 1 minute instead of 8 minutes.'