How to show one customer's results in a pitch deck: before-and-after numbers, named vs anonymous customers, and one story vs several.
Case Study Slide: Real Pitch Deck Examples
Seven real slides that show what the product did for a specific customer, shown in full, compare how founders present results, and which versions investors can check.
TL;DR
A case study slide works when it names a customer (or explains why it can't), shows a before-and-after number, and ties the result to something the customer pays for. In the examples below, StackCommerce reports three results for one retailer ($375K revenue, 15,000 customers, 55+ posts); Real Matters compares its turn time and defect rate with the traditional method in one named county; Front gives one measured result for each of four named customers. The weakest list activity instead of results, or hide the customer and the baseline. Pick one customer, give the starting point, the result and the time it took, and say how typical it is.
Case study slides from real pitch decks
Each example shows the exact stored slide above its analysis and links to the full teardown. Results are as stated on the slides; we have not verified them with the customers. Stage and year are given only where the slide or deck states them.
StackCommerce case study slide — slide 5
Commerce platform that sells products through publishers' editorial content. Stage and year are not stated on the slide.
StackCommerce deck, slide 5. Exact stored slide matched to this analysis.
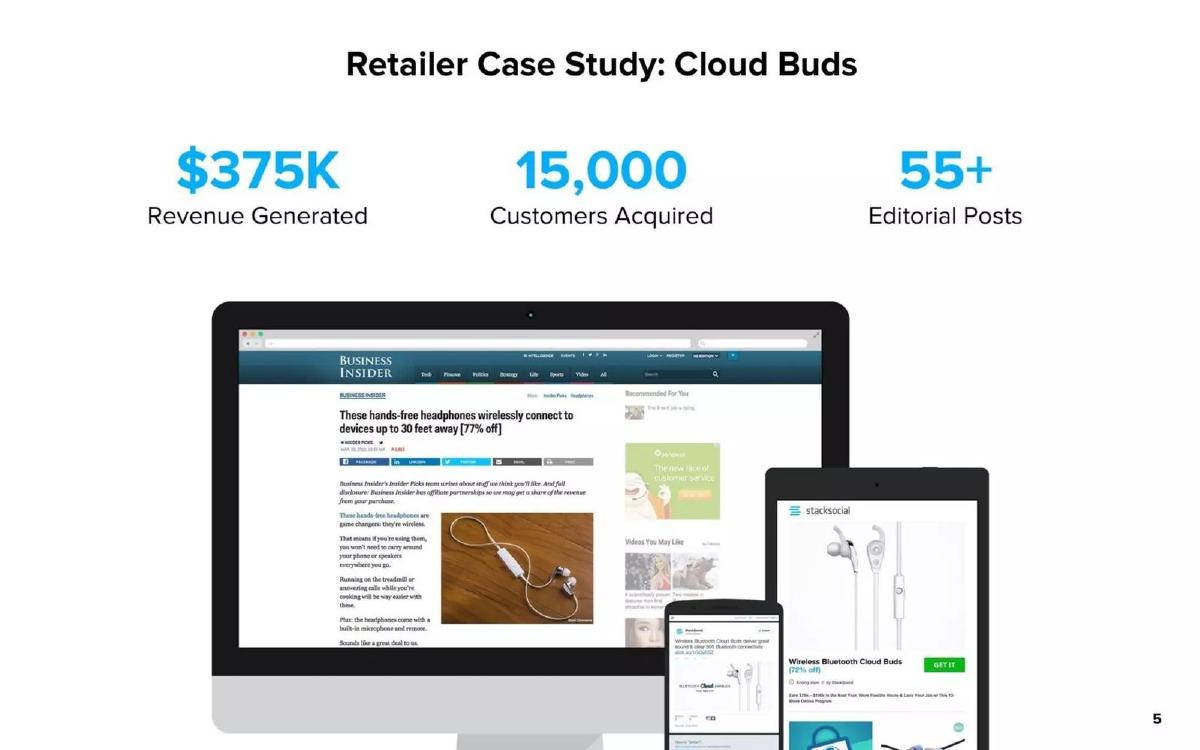
Our analysis: One named customer, three numbers the retailer cares about, and a picture of where the sales happened.
Evidence and limitation: No time period or starting point is given. Add "over X months" and what Cloud Buds sold before.
What a founder can adapt: Lead with the two or three results your buyer would put in a budget request.
Supporting analysis
What the deck claims: "Retailer Case Study: Cloud Buds": "$375K Revenue Generated", "15,000 Customers Acquired", "55+ Editorial Posts". Screenshots of a Business Insider article and product pages on desktop, tablet and phone.
Presentation choice: One named customer, three numbers the retailer cares about, and a picture of where the sales happened.
When it does not fit: No time period or starting point is given. Add "over X months" and what Cloud Buds sold before.
Network management platform for property appraisals. Stage and year are not stated on the slide.
Real Matters deck, slide 5. Exact stored slide matched to this analysis.
Our analysis: The comparison is against the method customers use today, in one named location, with two metrics buyers track.
Evidence and limitation: The market-share chart is labelled illustrative, so it isn't a result. Keep illustrative figures off a case study or move them to a separate slide.
What a founder can adapt: Compare your result with the customer's current method, not with nothing.
Supporting analysis
What the deck claims: "How Our Network Management Platform Works" in four steps. Step 2, "Best Performing Appraiser — Case Study: Prince William County, Virginia", with a fee breakdown chart. Step 3, "Better Performance": turn time 7–9 days (traditional AMC) vs 5.3 days (Real Matters); defect rate 15–20% vs 5.6%. Step 4, "Increased Client Market Share (Illustrative)": 2 to 35%.
Presentation choice: The comparison is against the method customers use today, in one named location, with two metrics buyers track.
When it does not fit: The market-share chart is labelled illustrative, so it isn't a result. Keep illustrative figures off a case study or move them to a separate slide.
Customer communication software. The teardown title identifies a Series D deck.
Front deck, slide 6. Exact stored slide matched to this analysis.
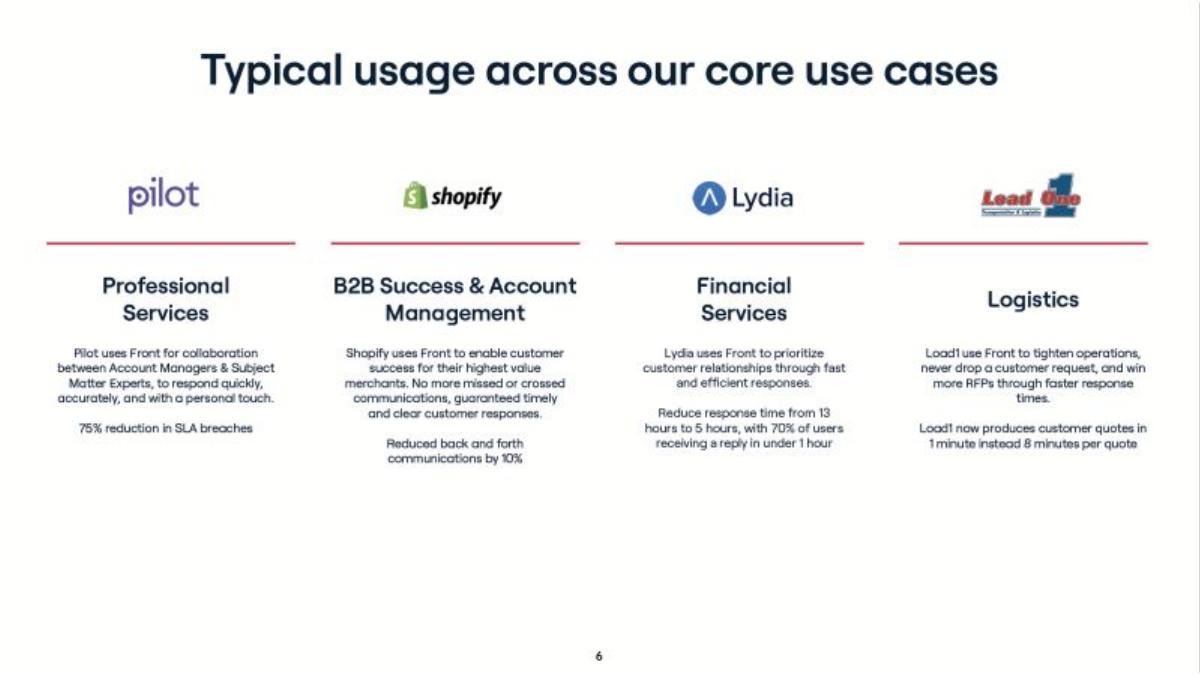
Our analysis: Four named customers in four industries, each with one measured result; Lydia and Load One give before and after.
Evidence and limitation: Pilot's and Shopify's results have no baseline. Give the starting number for each.
What a founder can adapt: If you sell to several segments, give one short case per segment with one metric each.
Supporting analysis
What the deck claims: "Typical usage across our core use cases": Pilot (professional services), "75% reduction in SLA breaches"; Shopify (B2B success and account management), "Reduced back and forth communications by 10%"; Lydia (financial services), "Reduce response time from 13 hours to 5 hours, with 70% of users receiving a reply in under 1 hour"; Load One (logistics), "now produces customer quotes in 1 minute instead of 8 minutes per quote".
Presentation choice: Four named customers in four industries, each with one measured result; Lydia and Load One give before and after.
When it does not fit: Pilot's and Shopify's results have no baseline. Give the starting number for each.
Indonesian multi-brand restaurant company; San Gyu is one of its own brands. Stage and year are not stated on the slide.
Hangry deck, slide 5. Exact stored slide matched to this analysis.
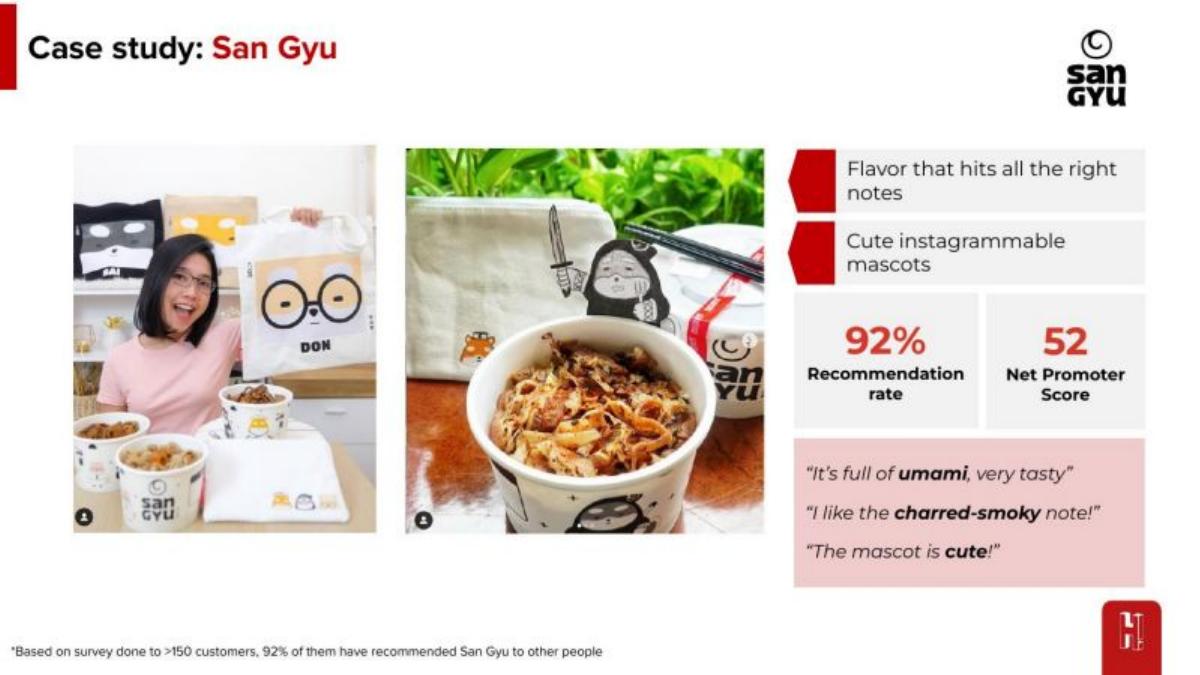
Our analysis: It states the survey sample (>150) behind the numbers and shows the product.
Evidence and limitation: Satisfaction scores aren't business results. Add orders, repeat rate or revenue per outlet. The deck repeats the format for a second brand (Moon Chicken, slide 6).
What a founder can adapt: Useful when the "customer" is your own brand: show proof that end buyers come back or recommend it.
Supporting analysis
What the deck claims: "Case study: San Gyu": photos of food and packaging; "Flavor that hits all the right notes", "Cute instagrammable mascots"; "92% Recommendation rate", "52 Net Promoter Score"; customer quotes ("It's full of umami, very tasty"). Footnote: "Based on survey done to >150 customers, 92% of them have recommended San Gyu to other people".
Presentation choice: It states the survey sample (>150) behind the numbers and shows the product.
When it does not fit: Satisfaction scores aren't business results. Add orders, repeat rate or revenue per outlet. The deck repeats the format for a second brand (Moon Chicken, slide 6).
Rent-to-own home programme. Stage and year are not stated on the slide.
Landis deck, slide 6. Exact stored slide matched to this analysis.
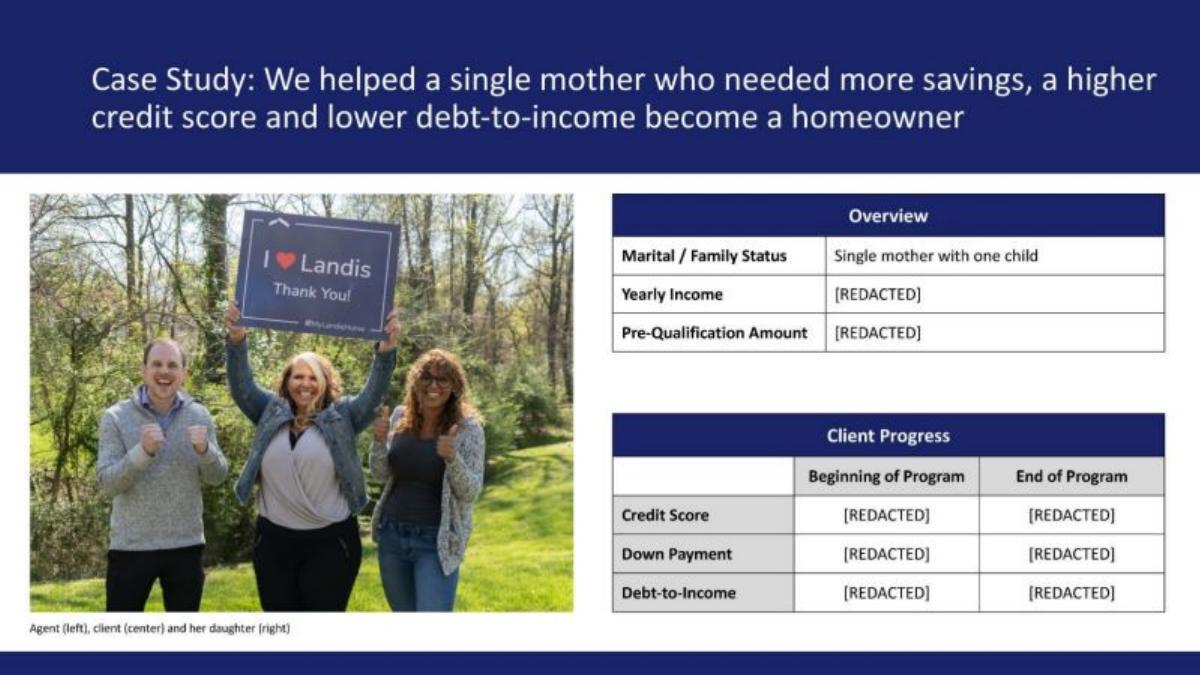
Our analysis: The structure is right: a clear before-and-after table on the three measures that decide whether someone gets a mortgage, plus a human story.
Evidence and limitation: In the published version every number is redacted, so the slide proves nothing to a reader. If privacy matters, show ranges or percentage change rather than blanks.
What a founder can adapt: Treat this as a slide to improve on. Keep the before-and-after table.
Supporting analysis
What the deck claims: "Case Study: We helped a single mother who needed more savings, a higher credit score and lower debt-to-income become a homeowner." A photo captioned "Agent (left), client (center) and her daughter (right)". An overview table (marital status: single mother with one child; income and pre-qualification amount [REDACTED]) and a "Client Progress" table, beginning vs end of programme, for credit score, down payment and debt-to-income, all [REDACTED].
Presentation choice: The structure is right: a clear before-and-after table on the three measures that decide whether someone gets a mortgage, plus a human story.
When it does not fit: In the published version every number is redacted, so the slide proves nothing to a reader. If privacy matters, show ranges or percentage change rather than blanks.
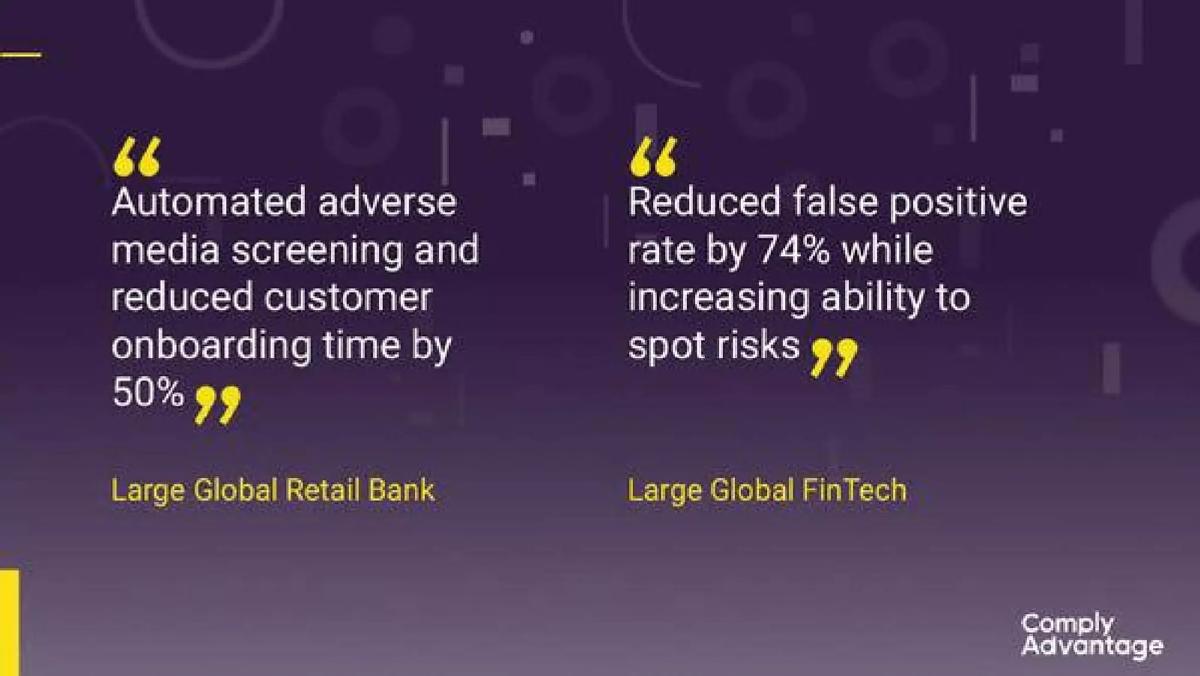
Financial crime risk data and screening software. Stage and year are not stated on the slide.
ComplyAdvantage deck, slide 6. Exact stored slide matched to this analysis.
Our analysis: Each result is a metric compliance buyers track, and the customer types show it sells to large institutions.
Evidence and limitation: Anonymous customers and no baselines make the claims hard to check. Offer to name them in diligence and give the starting figures.
What a founder can adapt: If customers won't be named, describe them precisely (size, sector, region).
Supporting analysis
What the deck claims: Two quoted results: "Automated adverse media screening and reduced customer onboarding time by 50%" — Large Global Retail Bank; "Reduced false positive rate by 74% while increasing ability to spot risks" — Large Global FinTech.
Presentation choice: Each result is a metric compliance buyers track, and the customer types show it sells to large institutions.
When it does not fit: Anonymous customers and no baselines make the claims hard to check. Offer to name them in diligence and give the starting figures.
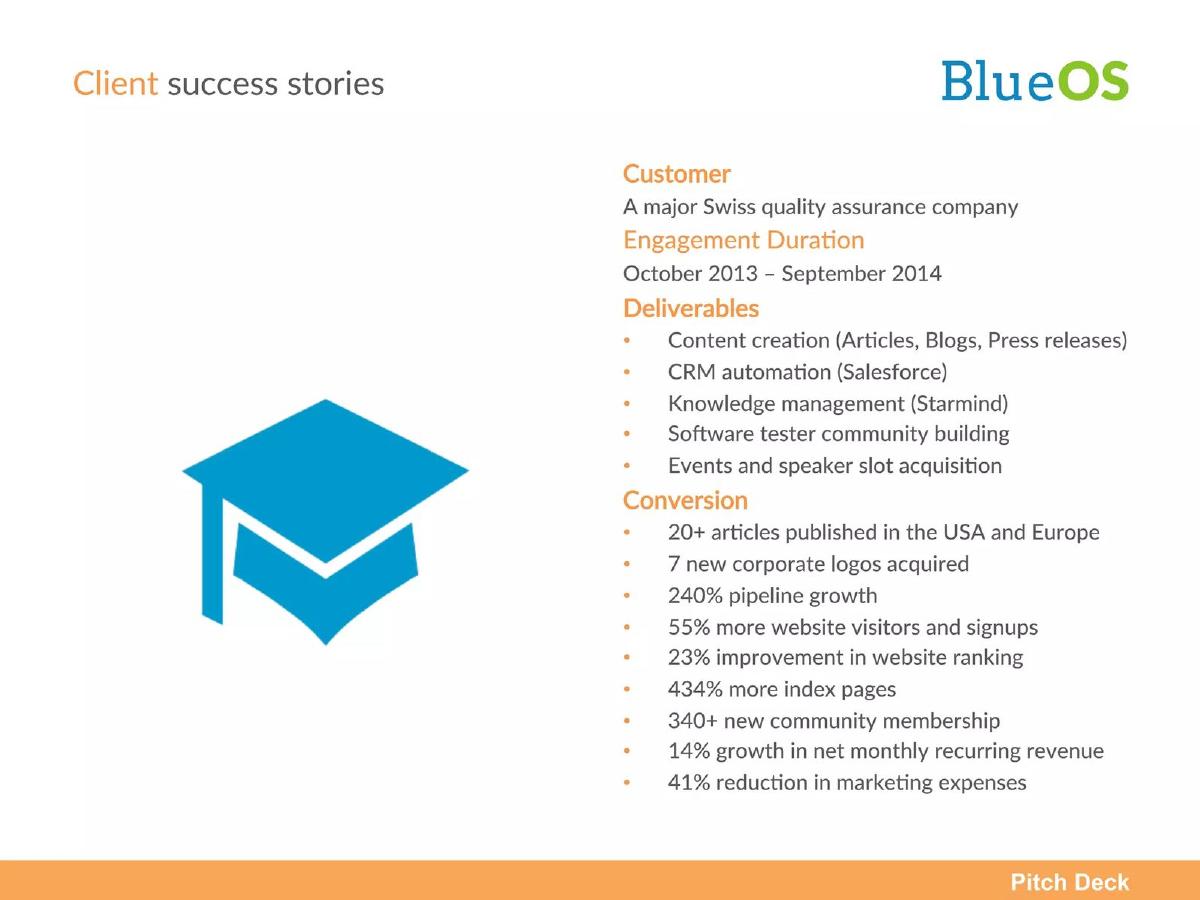
Marketing services company. The engagement dates on the slide are October 2013 – September 2014.
BlueOS deck, slide 6. Exact stored slide matched to this analysis.
Our analysis: It gives a time period and several results, including revenue and cost.
Evidence and limitation: Nine results of mixed weight bury the two that matter (14% net recurring revenue growth, 41% lower marketing cost). Lead with those and cut activity counts like articles published.
What a founder can adapt: Treat this as a slide to improve on. Keep the engagement dates.
Supporting analysis
What the deck claims: "Client success stories": customer "A major Swiss quality assurance company"; engagement October 2013 – September 2014; deliverables (content creation, CRM automation, knowledge management, community building, events); conversion: "20+ articles published", "7 new corporate logos acquired", "240% pipeline growth", "55% more website visitors and signups", "23% improvement in website ranking", "434% more index pages", "340+ new community membership", "14% growth in net monthly recurring revenue", "41% reduction in marketing expenses".
Presentation choice: It gives a time period and several results, including revenue and cost.
When it does not fit: Nine results of mixed weight bury the two that matter (14% net recurring revenue growth, 41% lower marketing cost). Lead with those and cut activity counts like articles published.
A case study is stronger with each column it fills.
Example
Customer named
Before and after
Time period
Business result
StackCommerce
Yes
No
No
Revenue, customers
Real Matters
Location
Yes
No
Turn time, defects
Front
Yes (4)
2 of 4
No
Response time, quotes
Hangry
Own brand
No
No
Satisfaction only
Landis
Anonymous
Yes (redacted)
No
Credit, deposit
ComplyAdvantage
Anonymous
% change only
No
Onboarding, false positives
BlueOS
Anonymous
% change only
Yes
Revenue, cost
Key Takeaways
Show before and after. Real Matters puts the traditional turn time (7–9 days) next to its own (5.3 days).
Name the customer if you can. Front, StackCommerce and Hangry name theirs; ComplyAdvantage describes "Large Global Retail Bank".
Report results, not work done. BlueOS lists deliverables and outcomes together; lead with the outcomes.
One result per customer beats many per customer. Front's four customers, one metric each, read faster than BlueOS's nine outcomes for one client.
Say whether the result is typical. None of the examples state it; add "median across X customers" if you have it.
Build your case study slide
Fill in each line for one customer.
Customer. Who is it? If you can't name them, describe size, sector and region.
Before. What was the key number before your product?
After. What is it now, and over what period?
Value. What is that worth to the customer in money or time?
Typical?. Is this your best result or a typical one? Say which.
Copyable framework: [Customer] ([sector, size]) used [product] for [period]. [Metric] went from [before] to [after], worth about [value] a year. Across [n] customers, the median change is [x].
Illustrative example 1 — written by us
Before: Reduced false positive rate by 74%.
After: A top-20 European bank cut false positives from 1,200 to 310 alerts a week in 6 months, saving about 4 analyst roles. Median across 12 banks: 58%.
What improved: Our illustrative rewrite, not any company's text; the figures are invented for the example. It adds the customer type, baseline, period, value and typicality.
How a case study differs from testimonials, logos and traction
A testimonial is the customer's words; a logo slide shows who buys; a traction slide shows totals across all customers. A case study shows what changed for one customer, with numbers. The testimonial, customer logo and traction guides cover those slides; this guide covers only single-customer results.
Investors read a case study as a preview of your sales pitch: if the result would convince a buyer, it suggests the product can be sold again.
Common mistakes
No baseline. Give the before number.
Activity instead of results. Cut "articles published"; keep revenue and cost.
Illustrative figures. Keep projections off case studies.
Fully redacted numbers. Use ranges or percentage change.
Best case shown as typical. State the median if you have several customers.
Diagnostic checklist
The customer is named or precisely described.
At least one metric has a before and after.
The time period is stated.
The result is something the customer pays for (revenue, cost, time).
You say whether the result is typical.
Frequently asked questions
How we chose these examples
Corpus: published pitch deck teardowns on StartupFundraising.com. Founder-uploaded private decks are excluded.
Selection (2026-09-24): we searched extracted text of slides 2–6 for "case study", "success stories" and before-and-after result language, then inspected about 20 candidates. We excluded slides where "case study" meant a problem illustration (Flux, Smartcall, Athina), agenda slides (Alcidion, Miterro, Storemates), a founder story (Alba Health), a product-value slide (Databook), testimonial-only slides (Pareto) and a slide with placeholder figures and anonymised logos (Macrometa). Seven remain.
Overlap check: the testimonial guide covers customer quotes, the customer logo guide covers who buys, and the traction guides cover totals across customers. This guide covers only single-customer results.
Review: all seven stored slide images were inspected on 2026-09-24 and matched to company, deck and slide number (editorial model review). No person has yet completed an editorial review of this page.
Results are as stated on the slides. We make no claim that any slide caused a fundraising outcome.