ComplyAdvantage’s 16-slide deck is a highly technical, product-centric presentation that prioritizes functional depth over narrative fluff. By focusing on the 'FinCrime Knowledge Graph' and specific efficiency gains—such as reducing false positives by 74%—the company positions itself as a critical infrastructure layer for global finance. The deck excels at demonstrating how its proprietary database (covering 200+ countries) replaces slow, legacy manual processes with real-time API calls. While it lacks traditional slides for team bios, competition, and a specific financial 'ask,' the sheer vo…
Key takeaways
- The deck identifies a massive $2 trillion global money laundering problem on slide 5, framing the current system as 'broken.'
- Product efficiency is quantified early, claiming a 74% reduction in false positives for a large fintech on slide 6.
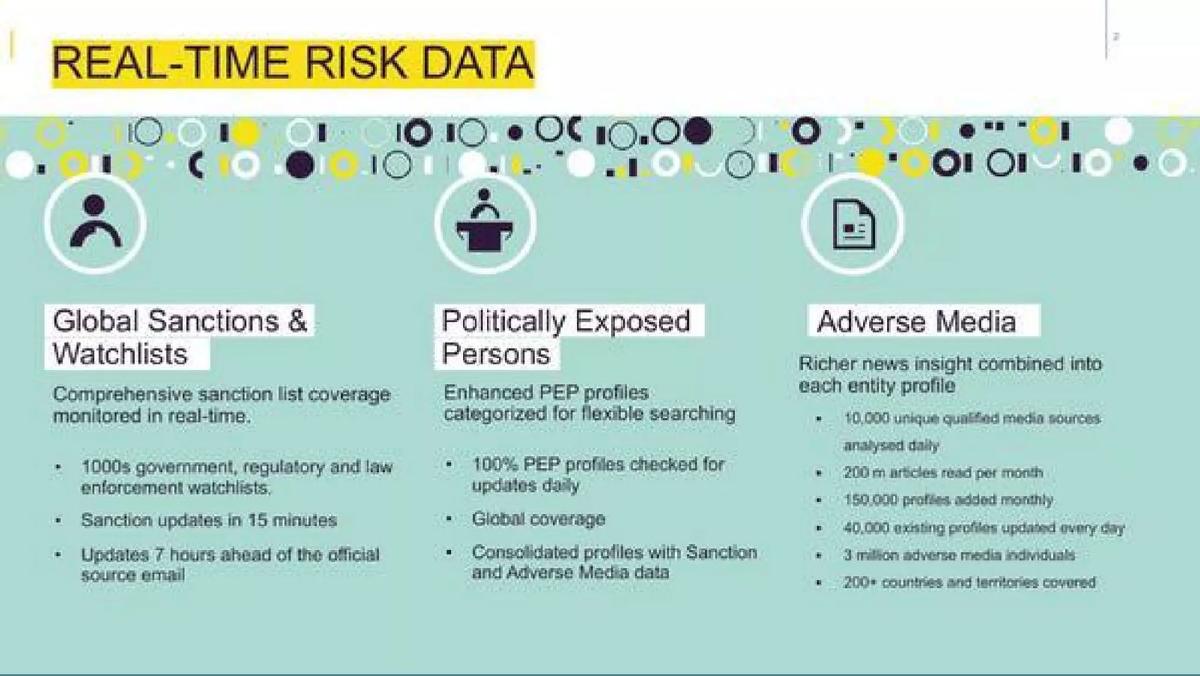
- Data scale is a core competitive moat, with slide 2 citing 200 million articles read per month and coverage of 200+ countries.
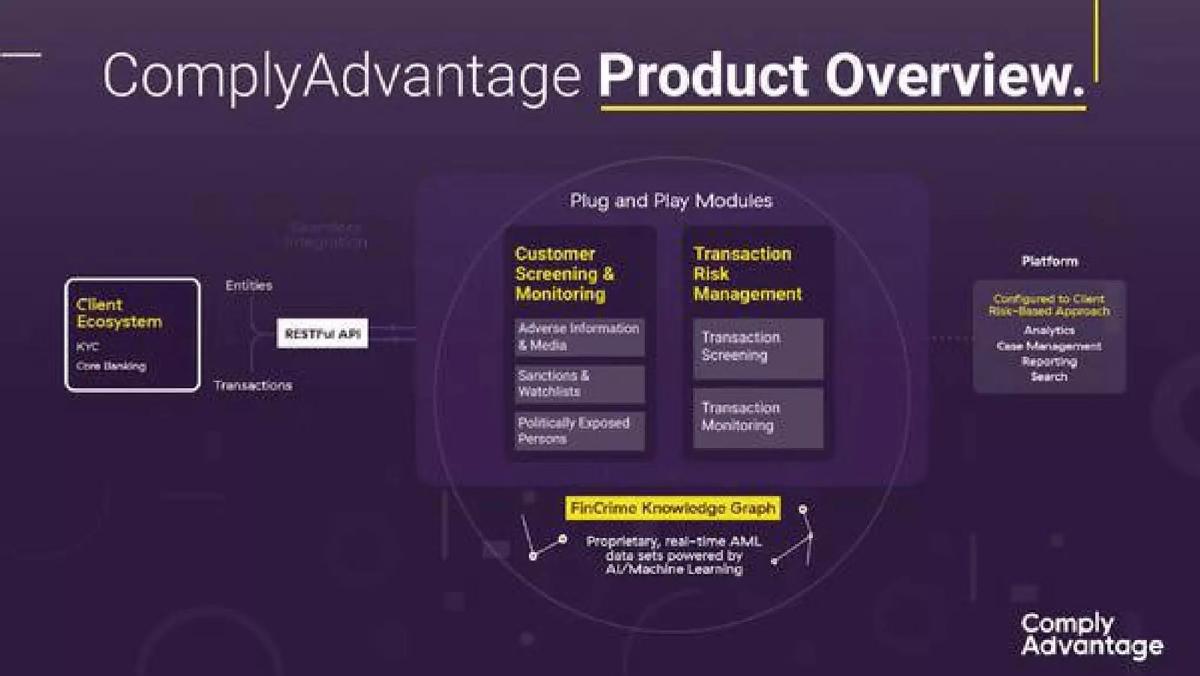
- The 'FinCrime Knowledge Graph' is introduced on slide 3 as the proprietary engine powered by AI and Machine Learning.
- The company emphasizes speed of integration, promising that clients can 'integrate in an afternoon' on slide 12.
- Social proof is anchored by a Santander case study on slide 15, showing a reduction in account opening time from 12 days to 2.
- The deck provides extreme granular detail on its data taxonomy, dedicating slides 13 and 14 to specific crime categories.
- Awards and external validation are used as a proxy for a team slide, highlighting a 16th place ranking on the Sunday Times Tech Track 100 on slide 16.
The RegTech Powerhouse: ComplyAdvantage Deck Analysis
ComplyAdvantage operates in the high-stakes world of financial crime detection. Their pitch deck is a reflection of the industry they serve: precise, data-heavy, and focused on risk mitigation. With over $108 million raised according to catalogue data, this deck serves as a blueprint for how to sell complex B2B infrastructure to both investors and conservative financial institutions.
Slides 1-4: The Hook and the Product Engine
The deck opens with a standard Company Overview (Slide 1) and immediately dives into the raw scale of their data on Slide 2 (Real-Time Risk Data) . This is a strategic move. Instead of starting with a 'problem' slide, they lead with their 'moat.' They list three pillars: Global Sanctions & Watchlists, Politically Exposed Persons (PEPs), and Adverse Media. The numbers here are meant to overwhelm: 10,000 media sources analyzed daily, 200 million articles read per month, and 150,000 profiles added monthly. They specifically note that their updates are '7 hours ahead of the official source email,' a critical metric for compliance officers who need to act before a sanctioned entity can move funds.
Slide 3 (Product Overview) introduces the 'FinCrime Knowledge Graph.' This is the technical heart of the company, described as proprietary real-time AML data sets powered by AI/Machine Learning. The diagram shows a modular approach, separating 'Customer Screening & Monitoring' from 'Transaction Risk Management,' all connected via a RESTful API. This modularity suggests a land-and-expand sales strategy where a client might start with screening and later add transaction monitoring.
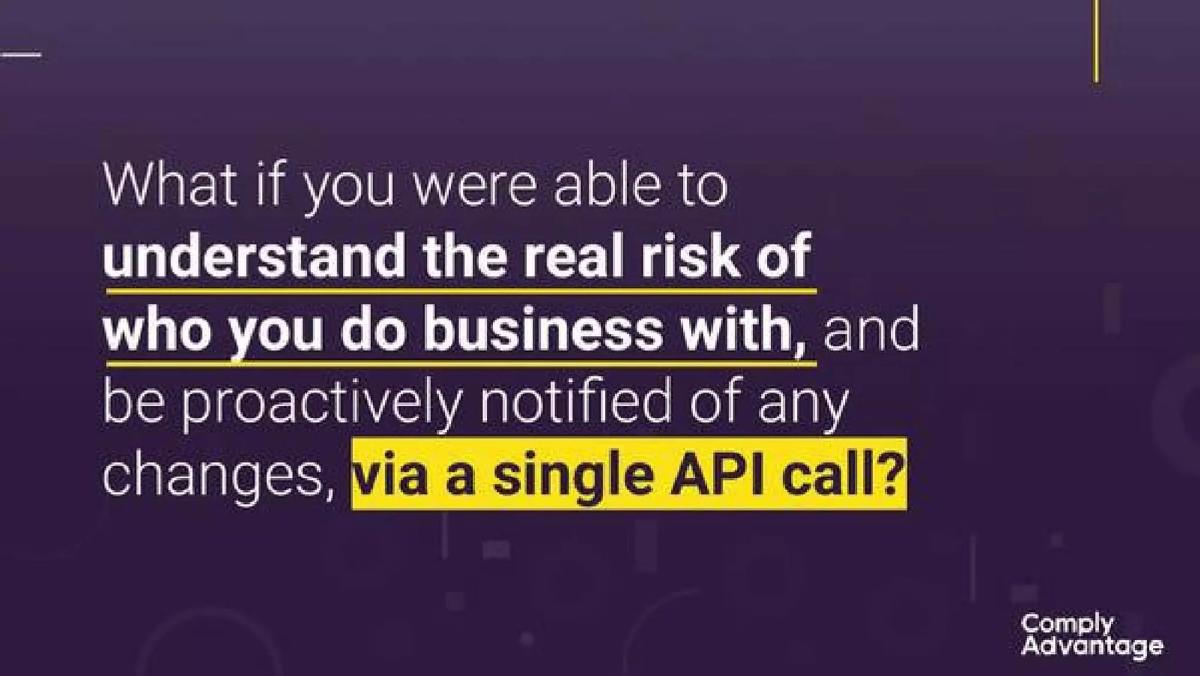
Slide 4 poses a rhetorical question that summarizes the entire business model: 'What if you were able to understand the real risk of who you do business with... via a single API call?' This slide bridges the gap between the complex data of Slide 2 and the business value for the customer.
Slides 5-7: The Problem and Immediate Proof
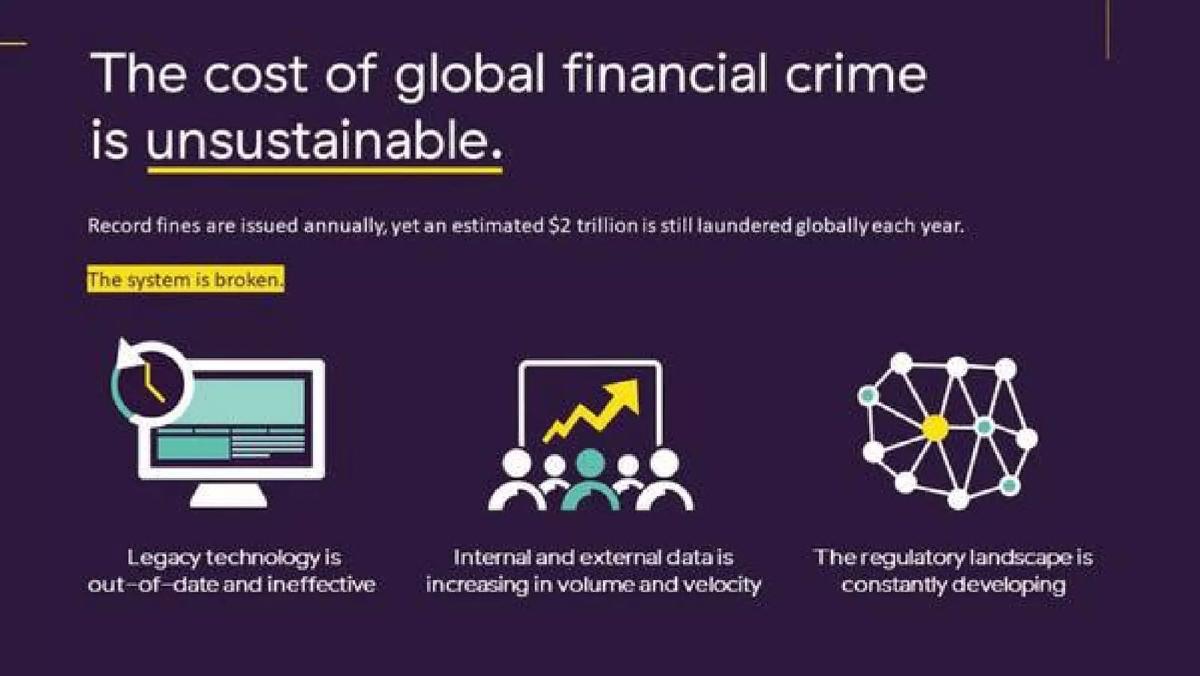
Slide 5 (The cost of global financial crime is unsustainable) finally addresses the market problem. It cites a $2 trillion figure for global money laundering and labels the current system as 'broken.' They identify three pain points: legacy technology, increasing data volume/velocity, and a developing regulatory landscape. By placing the problem after the solution, they've already shown they can handle the 'volume and velocity' mentioned here.
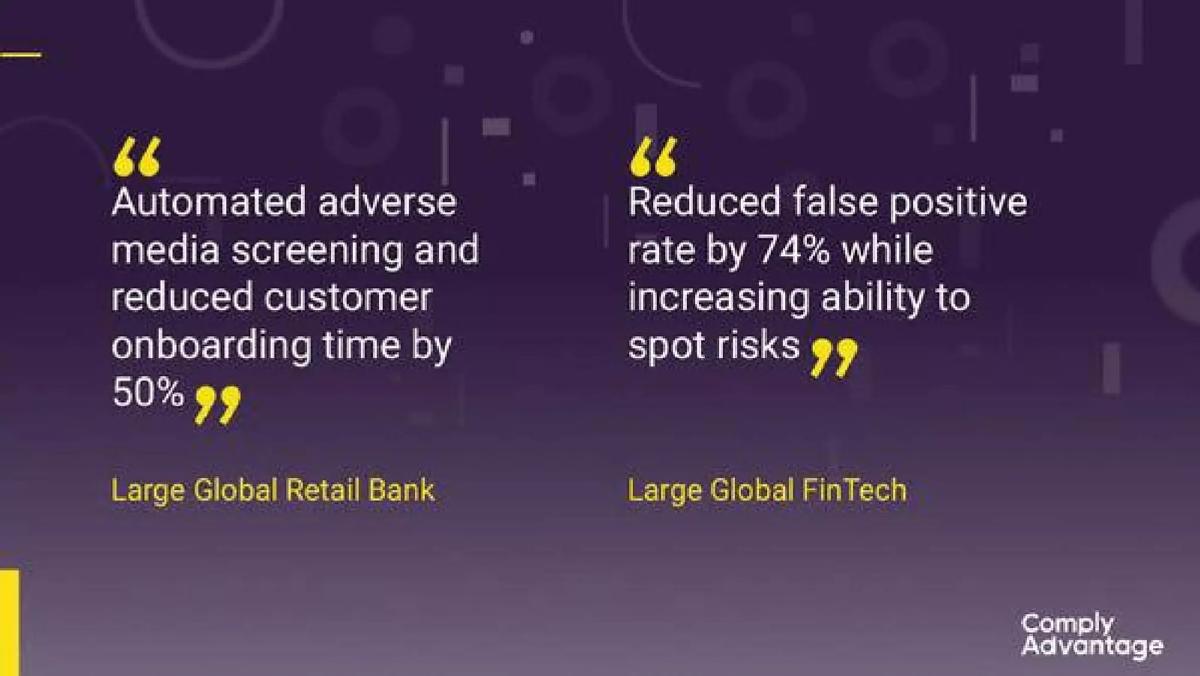
Slide 6 provides high-level social proof. It features two quotes (though the specific companies are not named, only described as 'Large Global Retail Bank' and 'Large Global FinTech'). The metrics are the stars: a 50% reduction in onboarding time and a 74% reduction in false positives. In the world of compliance, false positives are the primary driver of labor costs, so a 74% reduction is a massive financial incentive for a prospect.
Slide 7 (Transaction Monitoring and Screening) is a complex workflow diagram. It shows how the ComplyAdvantage Implementation Team works with the client to configure monitoring, analyze data, and manage alerts. This slide is likely intended to reassure technical buyers that the 'AI' isn't a black box, but a configurable tool that integrates with their existing 'Manage Performance' and 'Reporting' systems.
Slides 8-11: Deep Dive into Functional Modules
The next four slides (8 through 11) provide a detailed look at the user interface and specific features. Slide 8 (AML Screening and Monitoring) shows a screenshot of a profile for 'Victor Viorel Ponta,' demonstrating how the system consolidates sanctions, PEPs, and adverse media into a single view. This is the 'consolidated profile' mentioned earlier, which reduces the need for compliance officers to jump between different tabs and databases.
Slide 9 (Transaction Monitoring) claims to reduce alerts by 60%. It emphasizes the ability to create 'specific rules and scenarios' and the importance of an 'electronic audit trail' for regulators. Slide 10 (Transaction Screening) focuses on the speed of processing payments 'without delays,' which directly impacts customer satisfaction for the bank's end users. Slide 11 (Onboarding vs. Monitoring) uses a split-screen flow chart to show the lifecycle of a customer, from the initial 'Tailor screening' to the 'Proactive alerts' that occur if a customer's risk status changes post-onboarding.
Slides 12-14: Technical Integration and Data Taxonomy
Slide 12 (Configurable cloud solutions) is the 'developer' slide. It uses a massive 'API' graphic and promises integration 'in an afternoon.' It also highlights their ISO27001 certification, a non-negotiable requirement for selling into enterprise finance. The mention of 'Webhooks' for two-way communication signals that this is a modern SaaS product, not a legacy 'on-prem' installation.
Slides 13 and 14 are perhaps the most unique in the deck. They provide a Granular Adverse Media Taxonomy and Granular Negative News Categories . These are essentially two full-page tables defining what the system looks for: from 'Narcotics AML/CFT' to 'Financial difficulty' and 'Other Minor' topics like 'vandalism' or 'misconduct.' While these slides are text-heavy, they serve as a 'technical appendix' that proves the depth of their data categorization. It shows a potential buyer exactly what they are paying for.
Slides 15-16: The Big Close (Social Proof and Awards)
Slide 15 is the strongest piece of evidence in the deck. It features a video thumbnail and a quote from Jonathan Holman, Head of Digital Transformation at Santander . The results are undeniable: reducing account opening time from 12 days to 2 days, and an 80% reduction in employee effort. Using a named, Tier-1 global bank like Santander validates the entire preceding 14 slides of technical claims.
Finally, Slide 16 is a collage of awards and team photos. It lists the 'Celent Model Bank Award 2019,' 'Sunday Times Tech Track 100' (ranking 16th), and 'Deloitte UK Technology Fast 50' (ranking 21st). This slide functions as a 'trust' slide, replacing a traditional team bio slide by showing that the company and its founder (Charlie Delingpole, mentioned in the bottom right) are recognized leaders in the UK tech scene.
What Works in This Deck
Quantified Efficiency: The deck repeatedly uses hard percentages (74% reduction in false positives, 80% reduction in effort, 60% reduction in alerts) to justify the investment. · Data Scale as a Moat: By leading with the sheer volume of articles and profiles processed, they make the 'build vs. buy' decision easy for a bank. No bank wants to build a system that reads 200 million articles a month. · Tier-1 Validation: The Santander case study is the 'closer.' In fintech, one major bank logo is worth more than ten startup logos. · Clarity of Integration: Promising integration 'in an afternoon' addresses the biggest fear of enterprise software buyers: a multi-year, failed implementation project.
What Is Missing From This Deck
Team Slide: There is no slide dedicated to the founders' backgrounds or the leadership team's experience in compliance or AI. While the awards slide hints at this, a formal team slide is standard. · Competition: The deck ignores specific competitors (like Refinitiv/World-Check or Dow Jones). While they frame the enemy as 'legacy technology,' investors often want to see how a company differentiates from other modern startups. · Financials and Ask: There is no mention of revenue growth, ARR, or the specific terms of a funding round. This suggests the deck was used for business development or as a high-level overview rather than a final 'pitch' for a specific check. · Unit Economics: There is no information on CAC (Customer Acquisition Cost), LTV (Lifetime Value), or pricing models (per seat vs. per API call).
What a Founder Should Copy
The 'Single API' Slide: Slide 4 is a perfect example of how to boil a complex technical product down into a single, aspirational value proposition. · Taxonomy Transparency: If you are a data company, don't just say you have 'good data.' Show the taxonomy. Slides 13 and 14 prove the product's depth in a way that marketing copy cannot. · Workflow Visuals: Slide 11's comparison of 'Onboarding' vs. 'Monitoring' is a great way to show the 'before and after' or the 'initial vs. ongoing' value of a service. · Focus on 'False Positives': In any industry with high noise (security, compliance, devops), the most valuable metric is the reduction of 'false alarms.' ComplyAdvantage centers their entire pitch around this.
Frequently asked questions
- What is the primary value proposition of ComplyAdvantage?
- The primary value proposition is the replacement of legacy, manual compliance checks with a real-time, AI-driven database accessible via a single API. As shown on slide 4 and 12, the company focuses on 'proactive notification' of risk changes and 'afternoon' integration speeds, allowing financial institutions to automate AML (Anti-Money Laundering) and KYC (Know Your Customer) workflows while significantly reducing false positives.
- How does the deck handle the competitive landscape?
- The deck does not include a traditional competitor matrix or 'magic quadrant.' Instead, it frames the competition as 'legacy technology' which is described on slide 5 as 'out-of-date and ineffective.' By positioning itself against an entire category of obsolete manual processes rather than specific named rivals, ComplyAdvantage defines itself as the modern standard for the industry.
- What metrics does ComplyAdvantage use to prove its scale?
- The company relies on data-processing metrics rather than just financial ones. On slide 2, they highlight analyzing 10,000 unique media sources daily, adding 150,000 profiles monthly, and monitoring 3 million adverse media individuals. These figures demonstrate the technical 'moat' created by their proprietary data ingestion engine, which would be difficult for a new entrant to replicate.
- Is there a clear 'ask' or use of funds in this deck?
- No, this specific 16-slide deck omits a formal 'ask' or 'use of funds' slide. This is common in decks used for general corporate overviews or mid-process investor updates. While the catalogue data indicates they raised $108.2M, this deck focuses entirely on product capability, data taxonomy, and customer success stories rather than the mechanics of a specific funding round.
- How does the company demonstrate its impact on bank operations?
- The impact is demonstrated through time-to-value and efficiency metrics. Slide 15 features a testimonial from Santander stating that account opening cycles were reduced from 12 days to 2 days, representing an 80% reduction in effort. Slide 6 reinforces this with a retail bank case study showing a 50% reduction in customer onboarding time.