Front’s Series B deck is a benchmark for growth-stage SaaS companies. Rather than relying on abstract visions, the 24-slide presentation leans heavily into hard data, showcasing a 'default alive' status and exceptional net retention rates of 150% after one year (Slide 13). The deck effectively communicates a transition from a simple shared inbox to a comprehensive collaborative communication platform. It highlights a highly efficient sales engine where actual sales consistently exceed capacity (Slide 10) and a marketing spend that yields a 4.4x LTV/CAC ratio (Slide 12). By being transparent a…
Key takeaways
- The company demonstrates extreme product stickiness with users spending 2.5 hours per day in the app (Slide 19).
- Front achieved a 150% net retention rate at the one-year mark, indicating significant expansion within existing accounts (Slide 13).
- The deck highlights a 'default alive' status, projecting profitability within 10 months of the pitch (Slide 15).
- Sales efficiency is a core pillar, with the team delivering above calculated sales capacity in Q3 2017 (Slide 10).
- Marketing sustainability is proven through an LTV/CAC ratio that grew from 2.5 to 4.4 over three quarters (Slide 12).
- Usage metrics show exponential growth in internal collaboration, with comments and mentions scaling alongside message volume (Slide 9).
- The company maintains a high-performance culture with zero voluntary departures for employees tenured over three months (Slide 14).
- The product vision evolved from a 'shared email address' to a 'collaborative communication' platform (Slide 23).
Introduction: The Transparency of a Scaling SaaS Leader
Front’s Series B pitch deck is widely cited in the startup community for its high level of transparency and focus on unit economics. Raised in 2018, the $66M round was led by Sequoia Capital. The deck is less about a visionary future and more about the clinical demonstration of a business that has found product-market fit and is now optimizing its growth engine. With 24 slides, it provides a comprehensive look at how a modern SaaS company should present its traction, sales efficiency, and internal culture to late-stage investors.
Slides 1-5: Defining the Category and Product
Slide 1 is a minimalist title slide featuring the Front logo on a solid blue background. There is no tagline or date, keeping the focus entirely on the brand identity.
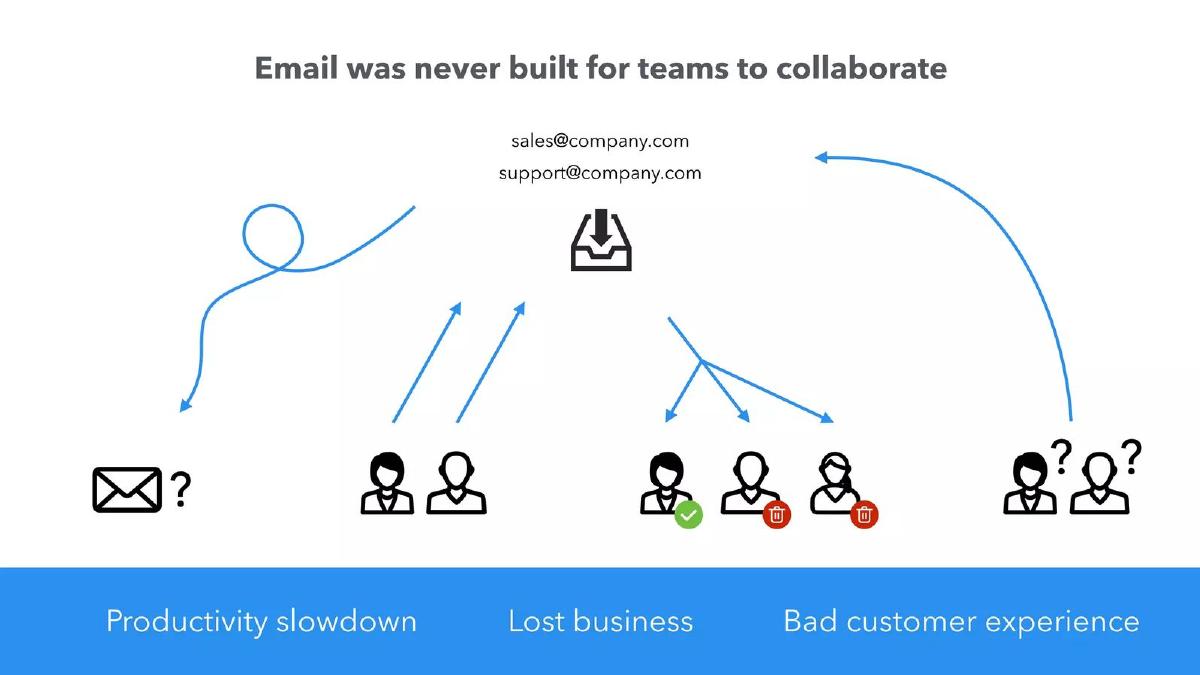
Slide 2 establishes the problem: 'Email was never built for teams to collaborate.' The slide uses simple icons to show the inefficiency of shared aliases like sales@ or support@. It highlights three specific pain points: productivity slowdown, lost business, and bad customer experience. This is a classic 'status quo' slide that sets the stage for the solution.
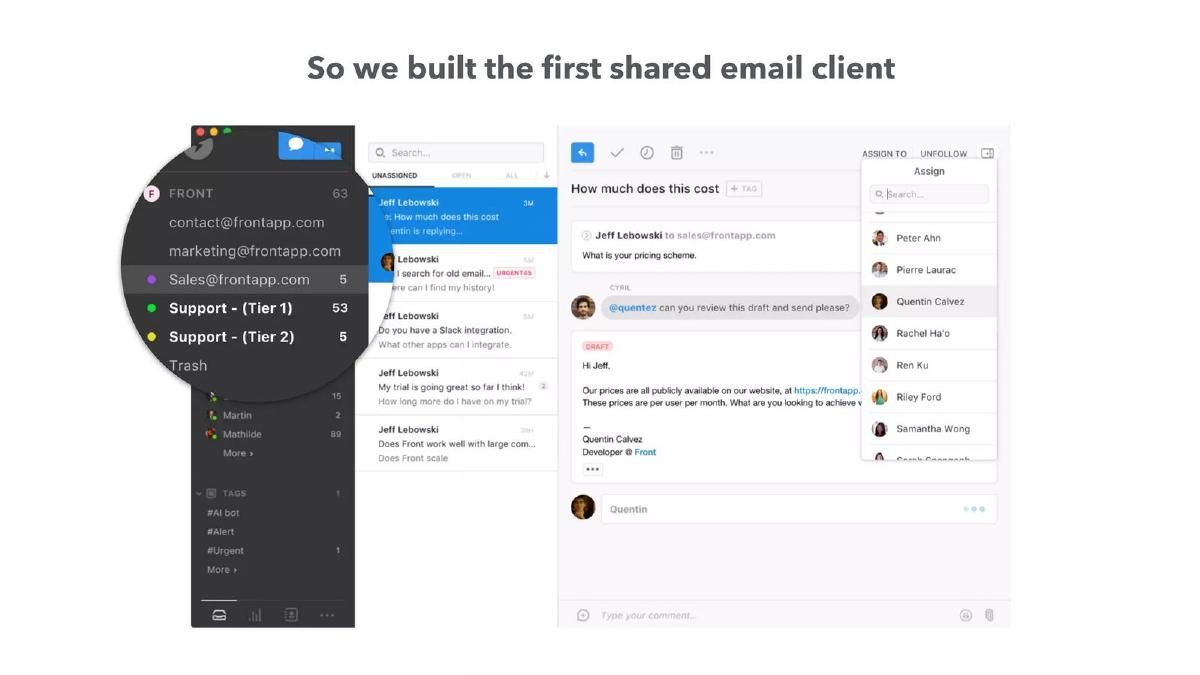
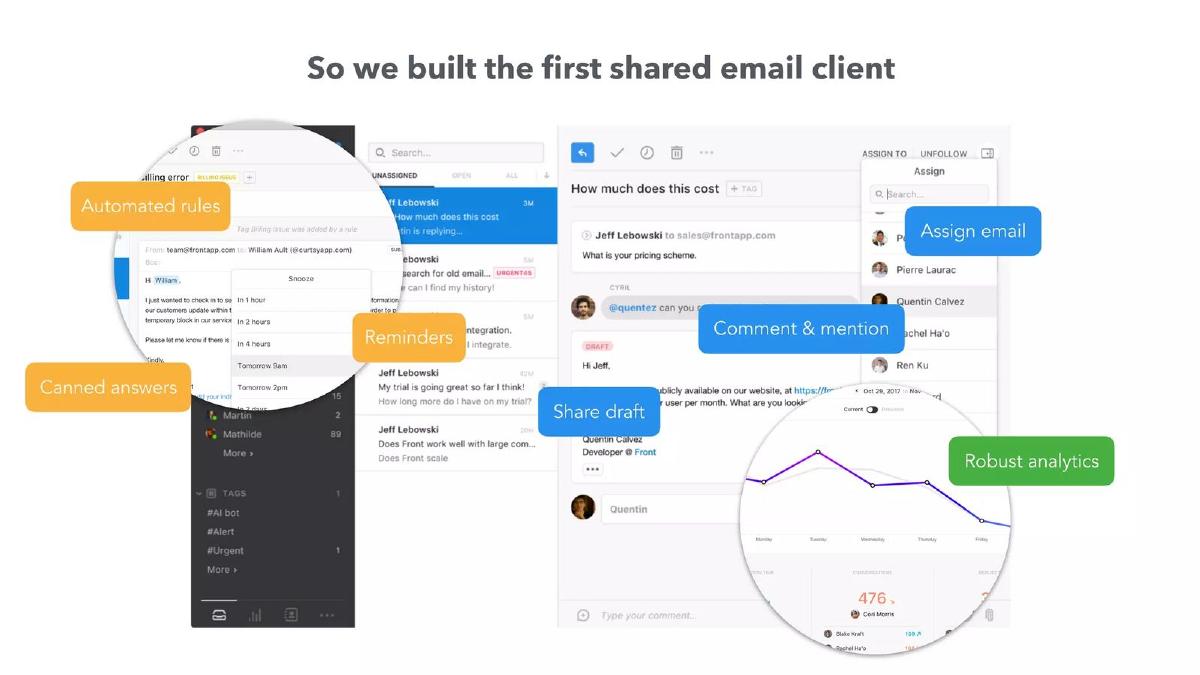
Slide 3 and 4 introduce the solution: 'So we built the first shared email client.' Slide 3 shows a clean screenshot of the interface, while Slide 4 uses callouts to highlight specific features like automated rules, canned answers, reminders, share draft, and robust analytics. By labeling these as 'firsts,' Front stakes a claim in category creation.
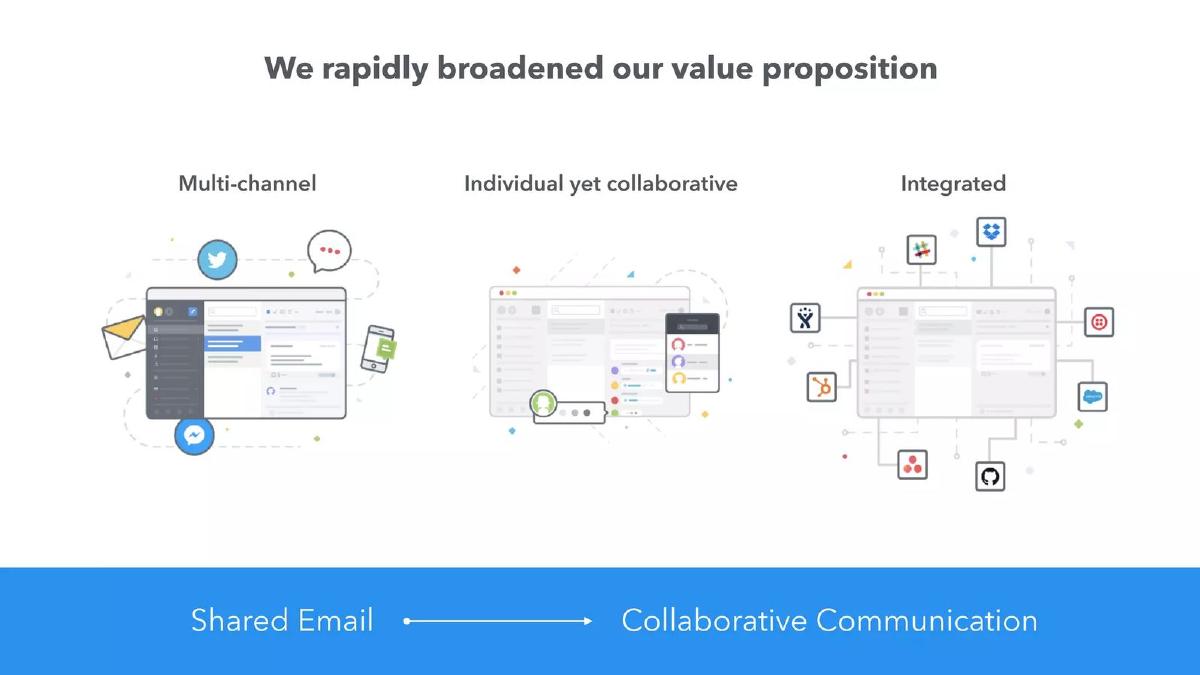
Slide 5 demonstrates the evolution of the value proposition. It shows a transition from 'Shared Email' to 'Collaborative Communication.' The slide illustrates three pillars: Multi-channel (integrating Twitter, SMS, and Facebook), Individual yet collaborative, and Integrated (showing logos for Slack, Dropbox, Salesforce, and GitHub). This slide is crucial for Series B, as it shows the company is expanding its Total Addressable Market (TAM) beyond just email.
Slides 6-9: The Traction and Usage Story
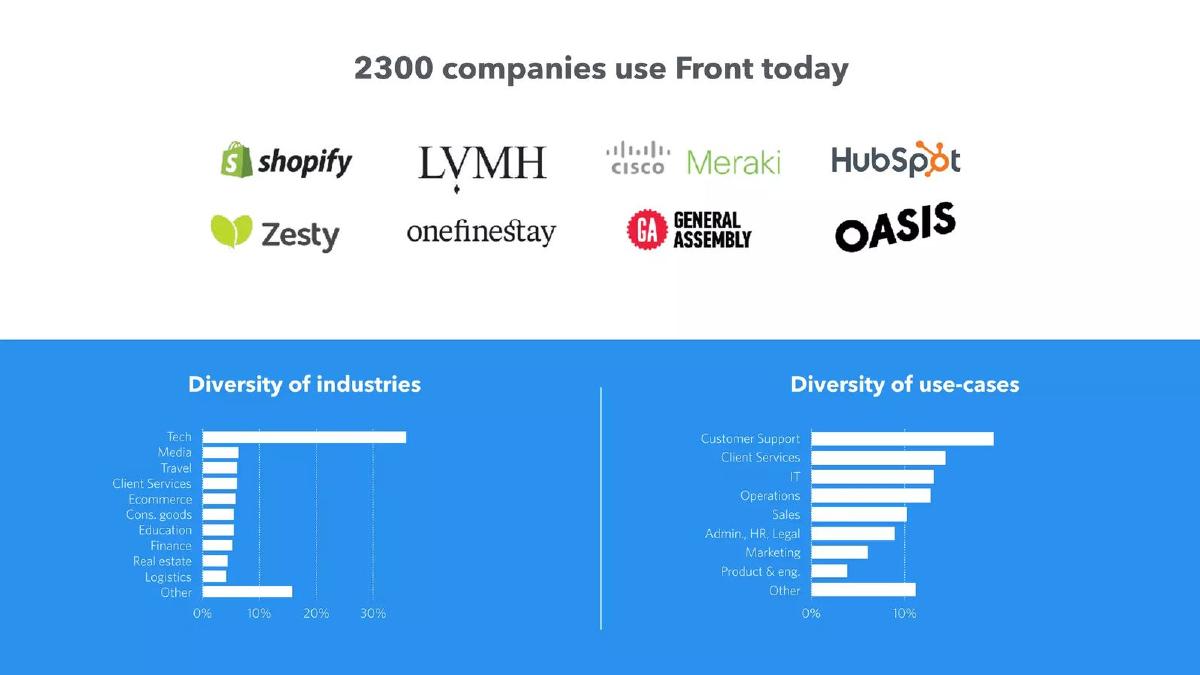
Slide 6 provides social proof with a '2300 companies use Front today' headline. It features high-profile logos including Shopify, LVMH, HubSpot, and General Assembly. Below the logos, two bar charts show a 'Diversity of industries' (Tech being the largest at roughly 35%) and a 'Diversity of use-cases' (Customer Support and Client Services leading the way). This proves the product is not a niche tool.
Slide 7 is a pure growth slide titled 'A very consistent growth of revenue.' It shows a bar chart of Monthly Recurring Revenue (MRR) or Annual Recurring Revenue (ARR) with a clear exponential curve. Notably, the Y-axis values are removed, but the shape of the curve tells the story of accelerating momentum.
Slide 8 addresses churn, a critical metric for any SaaS investor. The slide shows three lines: Gross churn, Net MRR churn, and Logo churn. The headline 'Churn keeps trending down...' is supported by the visual of the lines stabilizing and declining over time. The Net MRR churn line frequently dips below the zero axis, implying negative churn (expansion) in many months.
Slide 9 focuses on engagement. It shows two charts: one for 'Messages sent' vs. 'Comments & mentions,' and another for 'Individual email users.' Both show exponential growth. The fact that comments and mentions are scaling alongside messages proves that the 'collaborative' aspect of the product is being utilized, not just the email functionality.
Slides 10-12: The Sales and Marketing Engine
Slide 10 is titled 'Building a predictable sales organization (1/2).' This is a sophisticated slide for a Series B deck. It shows two charts: 'Growing team' (differentiating between fully ramped reps and those ramping up) and 'Delivering above capacity.' In Q3 17, the chart shows that actual sales (blue) exceeded the calculated sales capacity (grey). This is a strong signal that the company needs more capital to hire more reps because the current team is over-performing.
Slide 11 continues the sales story with 'ASP up every quarter' and 'More large deals.' It shows a line graph of Average Selling Price increasing from Q2 16 to Q3 17. It also includes a bar chart showing the number of large deals growing significantly in 2017. At the bottom, it lists three anonymized customer examples with 'xx ARR' and 'xx seats,' showing they are moving upmarket.
Slide 12 covers lead generation. It shows that as marketing spend increased from Q1 17 to Q3 17, lead growth followed, with a healthy mix of paid and unpaid leads. Most importantly, it shows the 'LTV / CAC' ratio increasing from 2.5 to 4.4 in just three quarters. This proves that their customer acquisition is becoming more efficient even as they spend more.
Slides 13-15: Unit Economics and Financial Health
Slide 13 is perhaps the most impressive slide in the deck. It shows a cohort analysis chart where 'All cohorts keep growing.' It explicitly states a '120% net retention rate at 6 months' and a '150% net retention rate at 1 year.' For a SaaS company, 150% net retention is world-class. It also notes that usage intensifies over time, with 3.9x more messages and 4.9x more comments per user after one year.
Slide 14 focuses on the 'solid foundations' of the team. It shows a headcount evolution chart reaching approximately 50 people by November 2017. It highlights 'Low attrition' with 0 voluntary departures among employees stayed longer than 3 months. It also includes Glassdoor metrics (5.0 stars, 100% CEO approval) and offsite ratings. This mitigates 'people risk' for the investor.
Slide 15 is the 'Capital Efficiency' slide. It shows that from Seed to Series A, they raised $3.1M, and from Series A to date, they raised $10M. It lists '$7m left' in cash and '18 months' of runway. The standout metric is 'Profitable in 10 months' under the 'Default alive' heading. This indicates the company is in a position of strength.
Slides 16-24: The Future and the Ask
Slide 16 looks at the business position, aiming for '$xx ARR by end of 2018' and a 'Positive operating margin by end of 2019.' It shows a chart of Gross margin staying steady at roughly 80% while operating margin (grey bars) moves from negative toward the zero line.
Slide 18 argues that Front is in a 'unique position' due to 'Unreasonable stickiness.' It cites 2.5 hours per user per day and a 64% DAU/MAU ratio. It also notes access to critical data like messages, files, contacts, and meetings.
Slide 19 and 20 outline the 'two areas of focus for 2018.' These include adding more users (maintaining leadership, becoming a great email client, shipping new products) and improving the platform (new Extension API, extending the collaborative model, launching an app-store).
Slide 21 and 22 present the 'Long-term vision.' Slide 21 shows a simple login screen, and Slide 22 directs viewers to their jobs page to learn more about the vision. This is a subtle way of showing they are always recruiting.
Slide 23 is the 'Raising our Series B' slide. It uses a growth curve to show their journey from a 'Shared email address' to 'Collaborative Communication' (where they are now) to a 'Good email client / Extensible platform' and finally a 'Confidential' future state. It marks various ARR milestones as '$xx ARR.'
What Works in the Front Pitch Deck
The primary strength of this deck is its data density . Front does not hide behind vague adjectives; they use specific ratios like LTV/CAC and Net Retention to prove their worth. The 'Default Alive' slide (Slide 15) is a masterstroke in fundraising strategy, as it removes the 'desperation' element from the pitch. Furthermore, the focus on sales rep ramping (Slide 10) shows a level of operational maturity that investors love to see at the Series B stage. It demonstrates that the founders understand the mechanics of scaling a sales team, not just building a product.
What is Missing from the Front Pitch Deck
The deck is notably missing a detailed competitive landscape . While it alludes to traditional email being the problem, it does not address other shared inbox competitors or collaborative tools like Slack or Zendesk directly. Additionally, the Team Slide is somewhat unconventional. While it mentions the CEO and shows a few headshots on Slide 12 and 14, it lacks the traditional 'Founders and Executive Team' slide with logos of previous companies (Google, Facebook, etc.) that is standard in most decks. Finally, the specific 'Ask' (the dollar amount they are looking to raise) is not explicitly stated on the slides, though the catalogue listing confirms they raised $66M.
What a Founder Should Copy
Founders should emulate Front's cohort analysis presentation (Slide 13). By showing that older cohorts spend more over time, you prove that your product is essential and has 'negative churn.' Another excellent element to copy is the Sales Capacity vs. Actual Sales chart (Slide 10). This is the most logical way to justify a large raise for 'scaling the team'—if you can show that your current reps are already over-capacity, the investment in new hires becomes a simple mathematical equation for growth rather than a risky bet. Lastly, the use of internal culture metrics (Slide 14) is a great way to prove that the company is a 'talent magnet,' which is a key differentiator in competitive markets.
Final Verdict: Front's Series B deck is a textbook example of how to use transparency as a competitive advantage. It shifts the conversation from 'what could be' to 'what is already working,' making the investment seem like a logical next step rather than a leap of faith.
Frequently asked questions
- What makes Front's Series B deck different from a Seed deck?
- Front's Series B deck focuses almost entirely on execution metrics rather than just the 'problem.' While a Seed deck sells a dream, this deck sells a proven machine. It includes detailed slides on sales rep ramping, cohort expansion, LTV/CAC ratios, and specific operating margins. The presence of a 'Default Alive' slide (Slide 15) is a hallmark of a mature startup that has moved past the experimental phase.
- How does Front demonstrate market demand in this deck?
- Instead of using third-party market research, Front uses its own growth data. Slide 6 shows 2,300 companies across diverse industries like Tech, Media, and Logistics. Slide 7 shows a consistent, upward-curving ARR bar chart. By showing that their Average Selling Price (ASP) is increasing every quarter (Slide 11), they prove that the market is willing to pay more for their evolving value proposition.
- Why did Front include Glassdoor ratings and offsite scores?
- In a Series B, investors look for 'organizational debt.' High turnover or a toxic culture can derail a scaling company. By including Slide 14, which shows a 5.0 Glassdoor rating and zero voluntary attrition, Front signals that their internal foundation is strong enough to handle the rapid headcount growth shown in their 'Headcount evolution' chart.
- What is the significance of the 'Default Alive' slide?
- Slide 15 is a power move. It states that Front has $7M in cash and 18 months of runway, and would be profitable in 10 months without further hiring. This gives the founders immense leverage in negotiations. It tells investors that the company doesn't *need* the money to survive, but will use it to grow faster, which is the ideal scenario for a Series B investor.
- How does the deck address competition?
- Interestingly, the deck does not have a traditional 'Competitor Matrix' slide. Instead, it frames the competition as the 'old way' of doing things—standard email. Slide 2 illustrates the chaos of traditional sales@ and support@ aliases. By positioning themselves as the 'first shared email client' (Slide 3), they define a new category rather than fighting for space in an old one.