Stickiness Slide: How to Prove Customers Would Find It Hard
"Sticky" and "high switching costs" are among the most common claims in pitch decks.
Stickiness Slide: Name What Makes Leaving Hard, Then Show Customers Staying
Many founders tell investors their product is "sticky" or that customers face "high switching costs". It is one of the most common defensibility claims in startup decks, and one of the least supported. Investors want to know two things: what exactly would a customer lose or have to redo if they left, and is there evidence that customers really do stay. This guide uses six real slides to show the difference between a stickiness claim that works as evidence and one that is only a label.
TL;DR
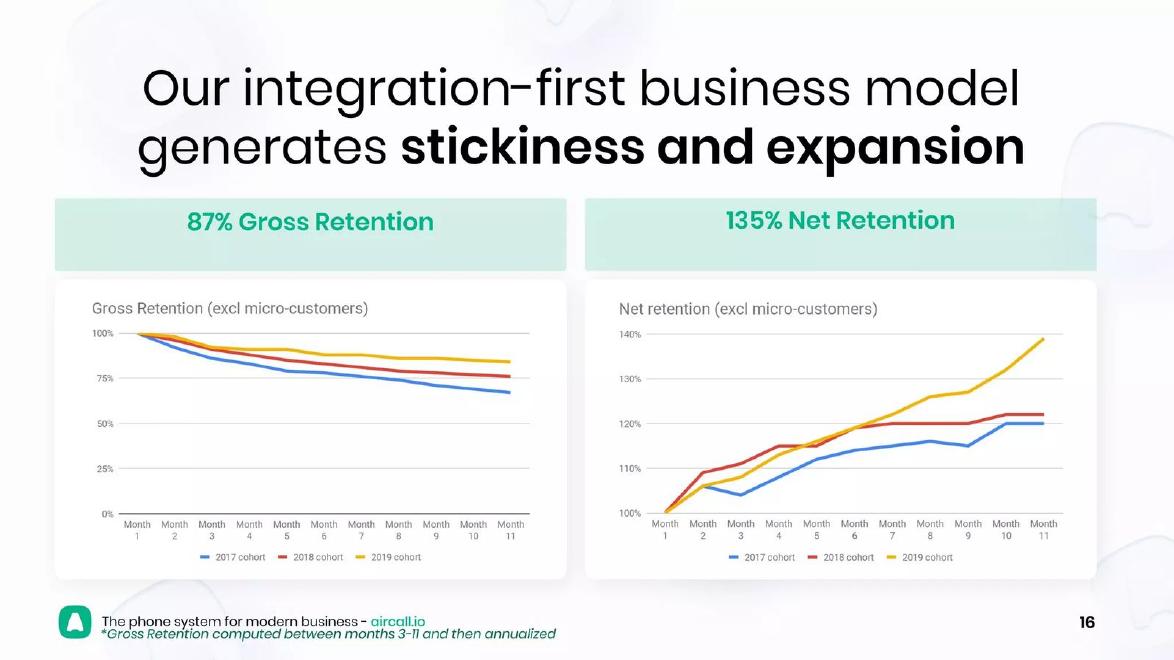
Say in one line what a customer would have to give up or rebuild to leave you, such as stored data, connected tools or retrained staff, and put a retention or usage figure on the same slide that shows customers staying. Aircall does this best: its title ties "stickiness and expansion" to its "integration-first business model", and two cohort charts show 87% gross retention and 135% net retention, with a footnote saying how gross retention was calculated.
Six stickiness slides, read in full
Each slide was rendered from the original deck at full size and read in full. Figures are as the slides state them; we did not check them against outside sources.
Aircall why us slide — slide 16
Business phone software. Series C deck, retention slide.
Aircall deck, slide 16. Exact stored slide matched to this analysis.
Our analysis: The clearest stickiness slide in the set.
Evidence and limitation: A named mechanism in the title, cohort retention charts, and the calculation method stated.
What a founder can adapt: Show retention by number of integrations, and say how much revenue the excluded micro-customers make up.
Supporting analysis
What the deck claims: "Our integration-first business model generates stickiness and expansion"; "87% Gross Retention"; "135% Net Retention"; charts by 2017, 2018 and 2019 cohort, "(excl micro-customers)"; "*Gross Retention computed between months 3-11 and then annualized".
Presentation choice: The claim and the figures that support it sit together, and the method is open.
When it does not fit: Calling a product sticky with no retention figure on the slide.
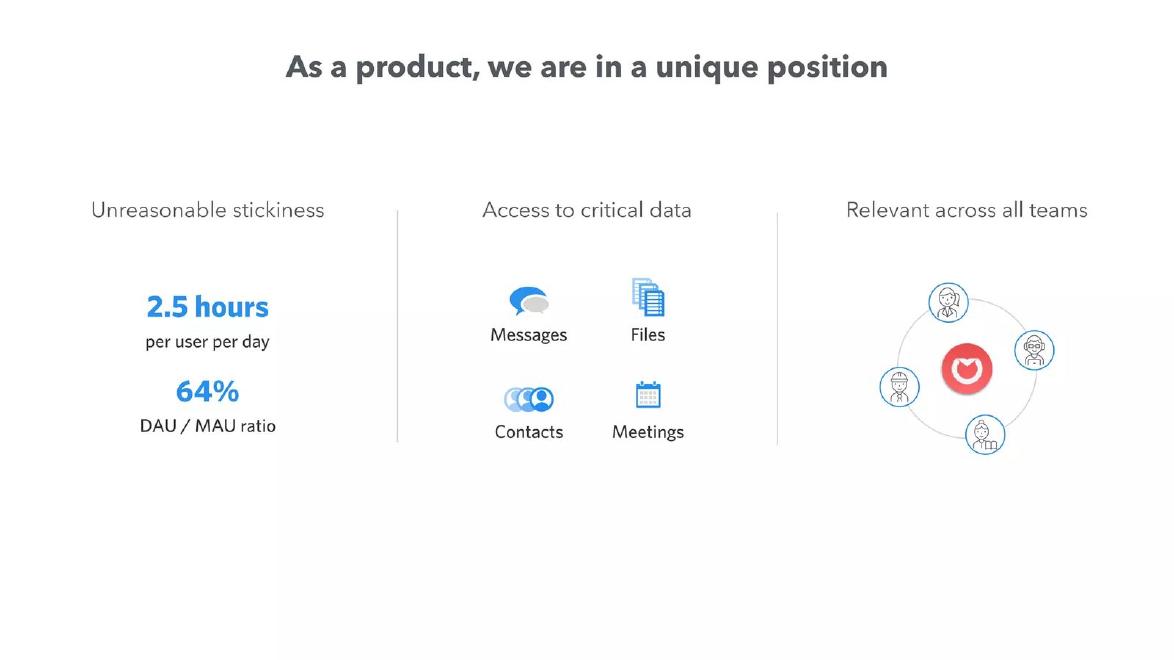
Front deck, slide 18. Exact stored slide matched to this analysis.
Our analysis: Shows reliance, not renewal; the mechanism and the figures are not joined.
Evidence and limitation: Strong daily usage figures; stored data implied as the reason to stay.
What a founder can adapt: Say in the title that leaving means moving message history and contacts, and add one retention figure.
Supporting analysis
What the deck claims: "As a product, we are in a unique position"; "Unreasonable stickiness: 2.5 hours per user per day; 64% DAU / MAU ratio"; "Access to critical data: Messages, Files, Contacts, Meetings"; "Relevant across all teams".
Presentation choice: Usage depth is real evidence that people depend on the product.
When it does not fit: A title that describes a "unique position" instead of a checkable claim.
Business current account with built-in accounting. "What makes us better?" slide.
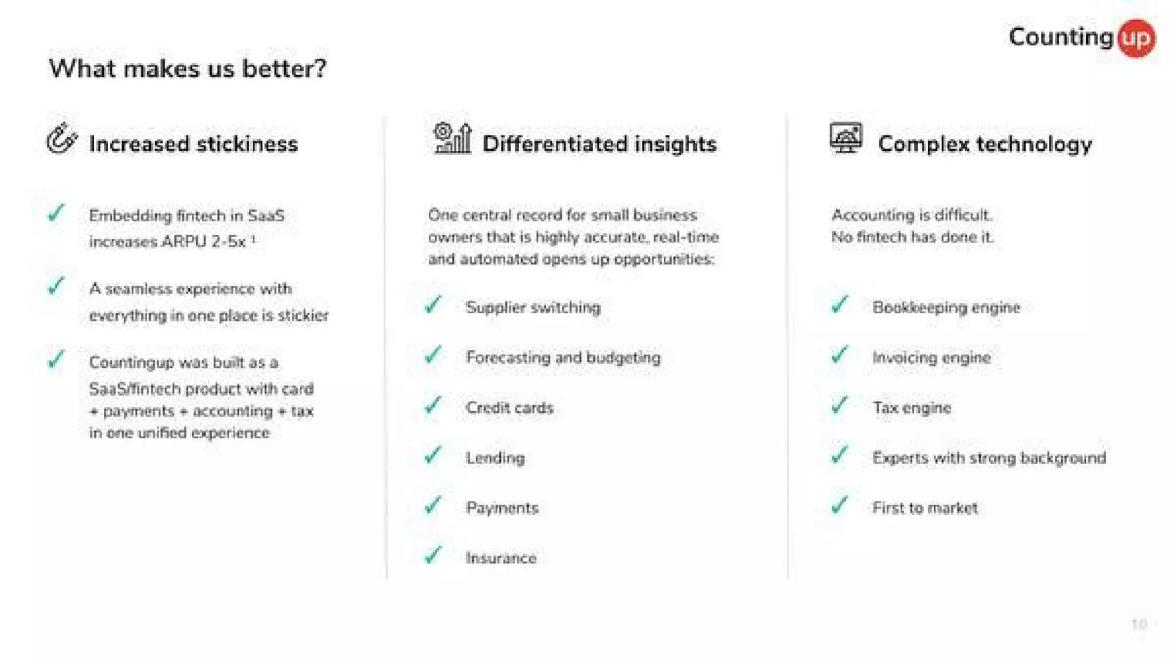
Countingup deck, slide 10. Exact stored slide matched to this analysis.
Our analysis: A good reason to expect stickiness, with no proof that Countingup's own customers stay.
Evidence and limitation: A clear mechanism; the only figure is a general industry claim with an off-slide source.
What a founder can adapt: Add retention or the share of customers using several functions, or say retention is not yet measurable.
Supporting analysis
What the deck claims: "Increased stickiness"; "Embedding fintech in SaaS increases ARPU 2-5x" (footnote 1); "A seamless experience with everything in one place is stickier"; "card + payments + accounting + tax in one unified experience".
Presentation choice: Shows how to name what a customer would have to move.
When it does not fit: Presenting an industry-wide figure as if it described your customers.
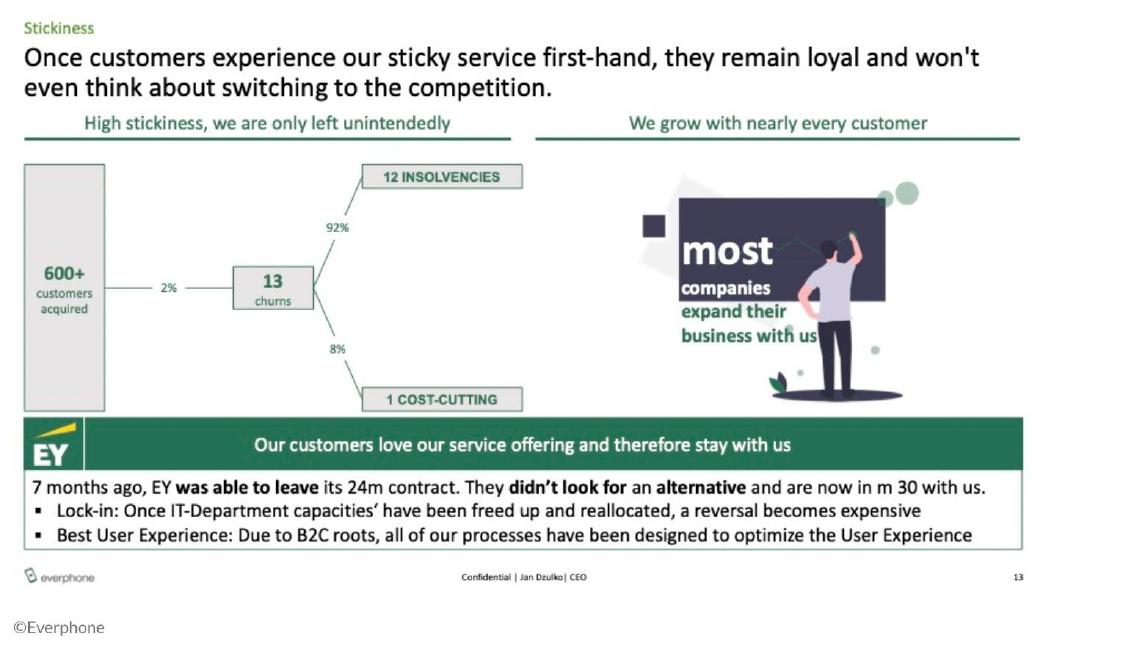
everphone deck, slide 13. Exact stored slide matched to this analysis.
Our analysis: Strong evidence undercut by an overclaiming title and no time period.
Evidence and limitation: Every churned customer counted and explained; a specific mechanism; one renewal story.
What a founder can adapt: State the period the 2% covers and how many customers have reached a renewal date.
Supporting analysis
What the deck claims: "600+ customers acquired" → "2%" → "13 churns": "12 insolvencies" (92%), "1 cost-cutting" (8%); "7 months ago, EY was able to leave its 24m contract. They didn't look for an alternative and are now in m 30 with us."; "Lock-in: Once IT-Department capacities' have been freed up and reallocated, a reversal becomes expensive".
Presentation choice: Explaining why each customer left is more persuasive than a churn rate alone.
When it does not fit: Claiming customers "won't even think about switching".
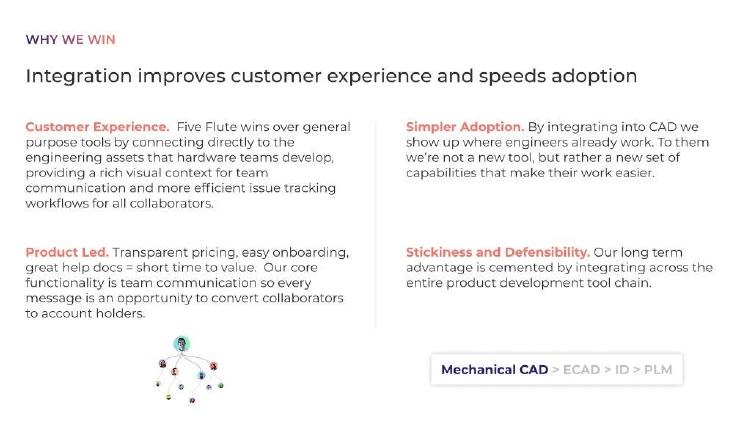
Issue tracking inside engineering design software. "Why we win" slide.
Five Flute deck, slide 9. Exact stored slide matched to this analysis.
Our analysis: An honest plan for stickiness, not a result.
Evidence and limitation: A qualitative mechanism, with the slide showing which part exists today.
What a founder can adapt: Add any early sign of customers staying, and soften "cemented".
Supporting analysis
What the deck claims: "Integration improves customer experience and speeds adoption"; "Stickiness and Defensibility. Our long term advantage is cemented by integrating across the entire product development tool chain."; "Mechanical CAD › ECAD › ID › PLM" with only the first highlighted.
Presentation choice: Shows how to present a future advantage without claiming it already holds.
When it does not fit: Describing planned integrations as a present advantage.
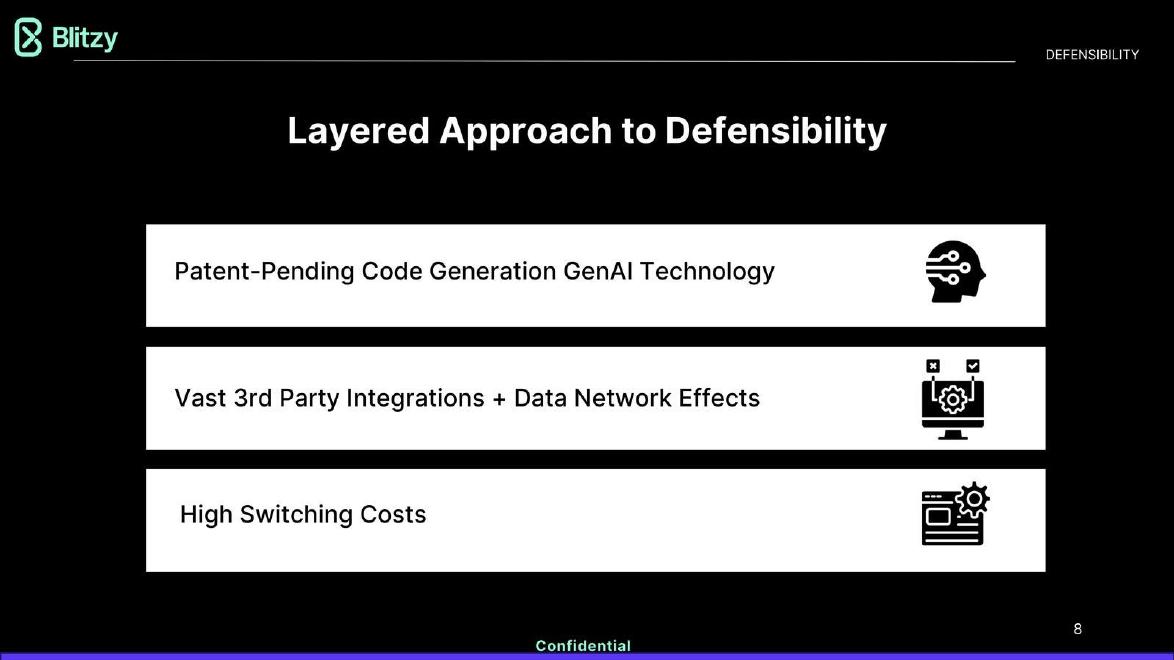
Blitzy deck, slide 8. Exact stored slide matched to this analysis.
Our analysis: A warning: the vocabulary of defensibility with nothing behind it.
Evidence and limitation: None: three labels with icons.
What a founder can adapt: Under "High Switching Costs", say what a customer would have to move and give one retention figure.
Supporting analysis
What the deck claims: "Layered Approach to Defensibility"; "Patent-Pending Code Generation GenAI Technology"; "Vast 3rd Party Integrations + Data Network Effects"; "High Switching Costs".
Presentation choice: Shows what investors see when the claim has no reason or figure.
When it does not fit: Listing switching costs as a heading with no explanation.
Whether each slide names what makes leaving hard, shows customers staying, states its method and separates today from plans.
Example
Mechanism named
Evidence customers stay
Method or period stated
Today vs planned
Aircall
Yes, integrations
Yes, cohort retention
Yes, footnote
Today
Front
Implied, stored data
Usage only
No
Today
Countingup
Yes, all-in-one
No
Source off slide
Today, unproven
everphone
Yes, IT staff moved
Yes, churn reasons
No period
Today
Five Flute
Yes, inside CAD
No
No
Shown on strip
Blitzy
No
No
No
Mixed
Key Takeaways
Name the mechanism: what a customer would lose by leaving.
Back it with retention, churn or usage figures on the same slide.
Explain why customers left, if any did.
Separate what is sticky today from what you plan to build.
"High switching costs" on its own is a label, not evidence.
Build your stickiness slide
Answer each prompt before writing the word "sticky".
Mechanism. What exactly would a customer have to move, rebuild or retrain to leave you?
Evidence. What figure shows customers staying: gross retention, churn, renewals or tenure?
Reasons. Why did the customers who left, leave?
Method. Over what period, and which customers are included or excluded?
Stage. Which parts of the mechanism exist today, and which are planned?
Copyable framework: Leaving [company] means [what the customer would lose or rebuild]. [Retention figure] over [period] ([who is included]). Of [n] customers who left, [reasons]. Planned: [what will deepen this].
Illustrative example 1 — written by us
Before: "High switching costs."
After: "Customers connect an average of 3 tools to us; leaving means rebuilding those links. 91% annual gross retention, 2023, all paying customers. Of 6 who left, 5 closed down."
What improved: Our illustrative rewrite; the figures are invented for the example. It names the mechanism, gives a retention figure with its period and scope, and explains churn.
The question this guide answers
Founders ask how to show investors that customers will stay once they sign up, and that a competitor cannot easily take them. The churn and retention guide covers how to present retention curves and cohort data. The net revenue retention guide covers expansion revenue. The data moat guide covers proprietary data as an advantage. None of them answers the narrower question this guide does: when you claim that leaving you is hard, how do you explain why, and how do you show it is true?
The question matters because the claim is cheap to make. Almost every software deck calls itself sticky. An investor who reads "high switching costs" without a reason or a figure learns nothing and may count it against the deck. A slide that names the specific thing a customer would have to rebuild, and shows how many customers stayed, turns a common phrase into one of the strongest arguments a startup can make.
How we chose and read the examples
We searched saved slide text in the teardown library for "switching costs", "stickiness", "sticky", "lock-in" and "embedded in the workflow". We left out listed companies and slides where the word appeared only in a sentence about the market or about competitors' lock-in. From the results we chose the smallest set that shows the full range: a claim with strong figures, figures without a stated mechanism, a mechanism without figures, a churn breakdown with a customer story, a qualitative argument, and a bare label.
Six slides from six startup decks remained: Aircall (business phone software), Front (shared inbox software), Countingup (accounting and business account app), everphone (company phones as a service), Five Flute (issue tracking for hardware engineers) and Blitzy (AI code generation). Each slide was rendered from the original deck at full size and read in full. Quotes and figures are the slides' own; we did not check them against outside sources.
The strongest pattern: a mechanism in the title, retention in the charts
Aircall titles its slide "Our integration-first business model generates stickiness and expansion". The title names a reason customers stay: Aircall connects to the other tools a business uses, so removing it means unpicking those connections. Below, two headline figures, "87% Gross Retention" and "135% Net Retention", sit over two charts: "Gross Retention (excl micro-customers)" and "Net retention (excl micro-customers)", each with a line for the 2017, 2018 and 2019 customer groups over 11 months.
Three things work. The claim and the evidence are on one slide, so the reader does not have to take the word "stickiness" on trust. The charts are split by the year customers joined, which shows the pattern holds across groups; the 2019 group retains best on both charts. And the slide is open about its method. Both chart titles say micro-customers are excluded, and a footnote reads "*Gross Retention computed between months 3-11 and then annualized".
Two things could be clearer. The slide does not show how integrations cause the retention. A line such as "customers with two or more integrations retain X%, against Y% for those with none" would connect the title to the charts. And excluding micro-customers and the first two months both flatter the figure; an investor will ask what retention looks like with them included. Saying how much revenue micro-customers make up would answer that before it is asked.
Usage figures without a stated reason
Front, which makes a shared inbox for teams, titles its slide "As a product, we are in a unique position". It has three columns. Under "Unreasonable stickiness" it gives "2.5 hours per user per day" and "64% DAU / MAU ratio", meaning that on an average day 64% of monthly users use the product. Under "Access to critical data" are four icons: "Messages", "Files", "Contacts", "Meetings". The third column, "Relevant across all teams", shows a ring of people around Front's logo.
The usage figures are strong evidence that people rely on the product every day. The middle column hints at the reason leaving would be hard: messages, files and contacts all live in Front. But the slide does not join the two. It never says that a customer who left would have to move that history, and it gives no retention or churn figure, so the reader sees heavy use but not whether teams renew. The title also describes a position rather than making a claim the reader can check.
The fix is short: a title such as "Teams keep their message history and contacts in Front, so they use it daily and stay", and one retention figure beside the usage figures.
A reason without evidence
Countingup, an app that combines a business current account with accounting software, titles its slide "What makes us better?". The first of three columns is "Increased stickiness", with three ticks: "Embedding fintech in SaaS increases ARPU 2-5x" (with a footnote marker, 1), "A seamless experience with everything in one place is stickier" and "Countingup was built as a SaaS/fintech product with card + payments + accounting + tax in one unified experience".
The slide names a real mechanism: a business whose bank account, card payments, accounting and tax all sit in one app would have to move all four to leave. That is a clear and believable reason. But the only figure is a revenue-per-user claim about embedding finance in software in general, with its source in a footnote that is not on the slide; it does not say whether it describes Countingup's own customers. "Is stickier" is stated as a principle. There is no retention, churn or tenure figure for Countingup itself.
This is a common pattern in early decks: the founder has thought clearly about why the product should be hard to leave but has not yet shown it is. If the company is too young for retention data, the honest version says so and gives the nearest early sign, such as the share of customers using two or more of the four parts.
A churn breakdown and one customer story
everphone, which rents and manages company phones, has the most detailed churn evidence in the set. The section label is "Stickiness" and the title reads "Once customers experience our sticky service first-hand, they remain loyal and won't even think about switching to the competition." Under "High stickiness, we are only left unintendedly", a diagram runs from "600+ customers acquired" through "2%" to "13 churns", which split into "12 insolvencies" (92%) and "1 cost-cutting" (8%). The point is that no customer left for a competitor.
Below, a band headed "Our customers love our service offering and therefore stay with us" tells one story: "7 months ago, EY was able to leave its 24m contract. They didn't look for an alternative and are now in m 30 with us." Two bullets give the reasons: "Lock-in: Once IT-Department capacities' have been freed up and reallocated, a reversal becomes expensive" and "Best User Experience".
This slide does several things well. It counts churn and explains every case. It names a specific mechanism, and an unusual one: the customer has already moved its own IT staff to other work, so taking phones back in-house would mean rebuilding a team. And the EY story shows a customer reaching the end of its contract and renewing without shopping around, which is exactly the behaviour a switching-cost claim predicts.
The weaknesses are in the framing. The title claims customers "won't even think about switching", which no data can show. The right half, "most companies expand their business with us", has no figure at all. The diagram gives no time period, so the reader cannot tell whether 2% churn is per year or since the company began. And the 600+ customers includes many recent ones who have not yet reached a renewal. Stating the period, and how many customers have reached the end of a contract, would make the 2% far more useful.
A qualitative argument: where the product sits in the workflow
Five Flute, which makes issue tracking that plugs into engineers' design software (CAD), puts its argument on a slide titled "Integration improves customer experience and speeds adoption" under the label "WHY WE WIN". Of four short paragraphs, the last is "Stickiness and Defensibility. Our long term advantage is cemented by integrating across the entire product development tool chain." A strip at the bottom reads "Mechanical CAD › ECAD › ID › PLM", with only the first step highlighted.
This is honest in a way many slides are not. The highlighted strip shows that Five Flute connects to one kind of tool today and plans to reach three more. So the stickiness paragraph describes a future advantage, and the reader can see that from the slide. The "Simpler Adoption" paragraph explains the mechanism well: "By integrating into CAD we show up where engineers already work. To them we're not a new tool, but rather a new set of capabilities that make their work easier."
What the slide cannot establish is that customers stay today. There is no retention, usage or renewal figure, so the argument is a plan, not a result. Qualitative reasoning like this is useful early, as long as the founder presents it as a plan, which this slide mostly does. The word "cemented" claims more than the strip shows.
Warning: "High Switching Costs" as a bare label
Blitzy, an AI code-generation company, titles its slide "Layered Approach to Defensibility". Three white bars read "Patent-Pending Code Generation GenAI Technology", "Vast 3rd Party Integrations + Data Network Effects" and "High Switching Costs", each with an icon. The slide is marked "Confidential".
"High Switching Costs" here is a label with nothing behind it. The slide does not say what a customer would lose by leaving, how long it would take to move to another tool, or whether any customer has stayed. The same is true of the other two bars: "Vast" integrations are not counted, and the patent is pending. An investor reading this learns only that the founder knows the vocabulary of defensibility.
The slide could become useful with one line under each bar. For switching costs, that line would say what is hard to move, for example code, settings or connections built up in Blitzy, and give one figure that shows customers staying.
What a stickiness claim needs to show
Across the six slides, the claims that persuade share four parts. First, a mechanism: the specific thing a customer would have to give up, move or rebuild. Aircall names connections to other tools, Countingup names four functions in one app, everphone names IT staff already moved to other work, and Five Flute names its place inside design software. Front implies stored messages and contacts. Blitzy names nothing.
Second, evidence that customers stay: gross retention, churn with reasons, renewals or tenure. Aircall and everphone give this. Front gives daily usage, which suggests reliance but is not the same as renewal. Countingup, Five Flute and Blitzy give none.
Third, honesty about method and period. Aircall states its exclusions and its calculation. everphone gives no period. Fourth, a clear line between what is true today and what is planned. Five Flute shows this with its strip; Blitzy mixes a pending patent with present claims.
A slide that has all four is rare in the library. A slide with only the first is common, and is a good draft, not a finished slide.
If you are too early for retention data
Many founders reach this slide before they have a year of customers. In that case, do not claim stickiness as a result. Describe the mechanism as a design choice, and give the nearest early sign you have: the share of customers who connected a second tool, imported their data, or added colleagues; how many hours of setup a typical customer puts in; or how many pilot customers converted to paid. Say plainly that retention is not yet measurable, and when it will be.
This reads as more credible than a confident label. Investors expect early companies to lack retention data. They do not expect a founder to claim a result the company is too young to have.
Common mistakes
Label without a reason. Say what a customer would have to move or rebuild.
Reason without evidence. Add retention, churn or renewal figures, or say they are not yet measurable.
Usage presented as retention. Daily use suggests reliance; show renewals too.
No period or scope. State the period and any excluded customers.
Plans presented as present. Mark which parts of the mechanism are still to be built.
Diagnostic checklist
One line naming what makes leaving hard.
A retention, churn or renewal figure on the same slide.
Reasons for churn, if any.
Period and exclusions stated.
Today and planned kept apart.
Frequently asked questions
Should I say my product has high switching costs?
Only with a reason and a figure. Name what a customer would lose by leaving, and show how many customers stayed.
Is daily usage enough to prove stickiness?
It helps, but it is not the same as renewal. Pair usage figures with retention or churn.
What if we are too early to have retention data?
Describe the mechanism as a design choice, give the nearest early sign, such as customers connecting a second tool, and say when retention will be measurable.
Should I explain why customers left?
Yes. A breakdown showing that customers left for reasons unrelated to a competitor, such as closing down, is strong evidence.
How we chose these examples
Corpus: published pitch deck teardowns on StartupFundraising.com. Founder-uploaded private decks are excluded.
Selection (2026-10-01): we searched extracted slide text for stickiness, switching-cost and lock-in phrases, excluded listed-company presentations and passing mentions, and kept the smallest set of six slides from six startup decks that covers the range of approaches.
Review: all six slides were rendered from the source decks at full size on 2026-10-01 and read in full against company, deck and page number (editorial model review, with AI assistance in drafting). No person has yet completed a human review. Figures were not checked against outside sources.