LTV to CAC Ratio on a Pitch Deck: Can Investors Rebuild It?
How founders show lifetime value (LTV) and customer acquisition cost (CAC) on a pitch deck: revenue versus margin, measured versus projected, sample size.
How to Show LTV and CAC on Your Pitch Deck So the Ratio Holds Up
Fifteen slides from real pitch decks that state a lifetime value, an acquisition cost, or the ratio between them. For each, we record what the slide says, whether the lifetime value is built from revenue or from margin, whether the figures are measured or projected, and whether an investor could rebuild the ratio from what the slide shows.
TL;DR
An LTV to CAC ratio is only as good as the two numbers behind it. Investors want to know four things: whether lifetime value is counted in revenue or in gross margin, how long a customer is assumed to stay and why, what costs are included in acquisition cost and over what period, and how many customers the figures are based on. A slide that shows those inputs lets an investor rebuild the ratio in a minute. A slide that shows only "8.78" or "876:1" asks them to take it on trust.
In this set, Liftit's table is the model: monthly revenue, cost, margin, churn, customer life, LTV and CAC for the last three months, and every figure multiplies through to its 8.41x (our check). Ministro shows its own arithmetic: its 3:1 counts one year of revenue as lifetime value, and on the gross profit printed beside it the ratio is 2:1 (our calculation). IvyClique's projected LTV of $76,000 would take about 17 years of subscription at its proposed $375 a month (our calculation). At the other end, Curastory shows "876:1" with no inputs at all, and Modern Picnic labels its boxes "actual data" but leaves LTV, CAC and the ratio blank.
LTV and CAC slides from real pitch decks
Each example records what the slide states, whether its lifetime value is built from revenue or margin, whether the figures are measured or projected, and what to copy or avoid. "Our calculation" marks arithmetic we did; the slides do not show it.
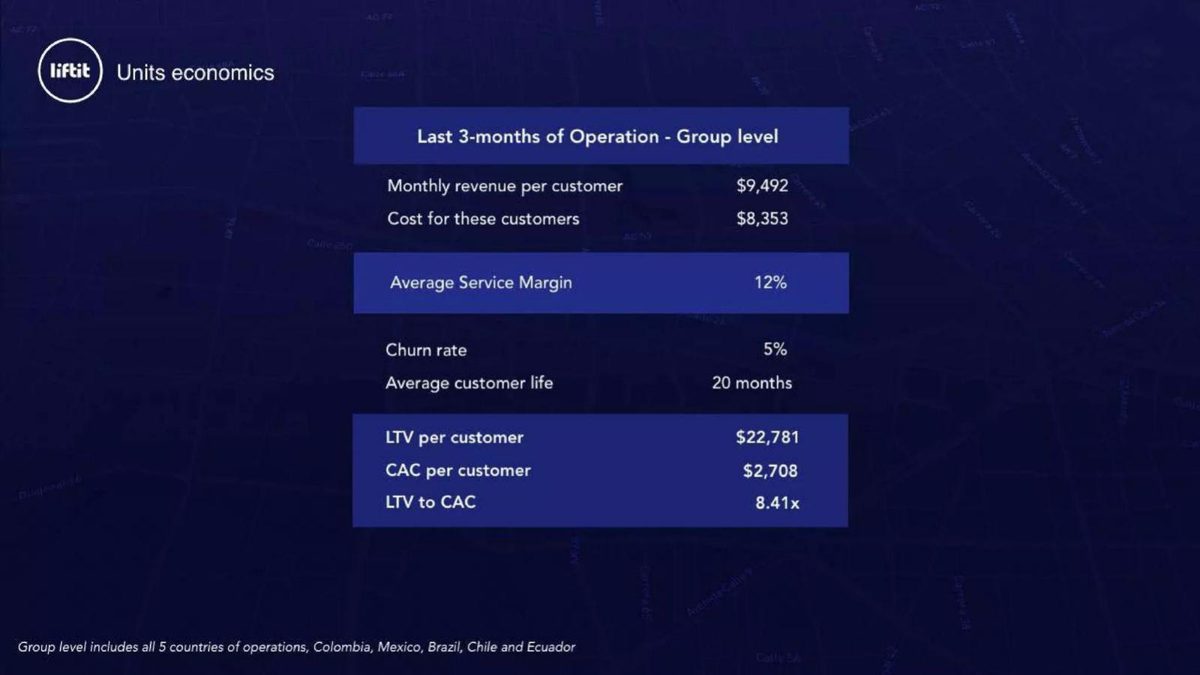
Liftit unit economics slide — slide 12
Last-mile logistics platform, five Latin American countries. "Units economics" page.
Liftit deck, slide 12. Exact stored slide matched to this analysis.
Our analysis: A margin-based ratio an investor can rebuild.
Evidence and limitation: Our checks: margin $1,139 (12.0%); 1/5% is 20 months; $1,139 times 20 is $22,780; ratio 8.41. All consistent.
What a founder can adapt: Say how CAC is calculated and how long churn has been measured.
Supporting analysis
What the deck claims: Last 3 months, group level: revenue per customer $9,492/month; cost $8,353; margin 12%; churn 5%; life 20 months; LTV $22,781; CAC $2,708; LTV to CAC 8.41x.
Presentation choice: Every input is shown and multiplies through.
When it does not fit: Don't base a 20-month life on only three months of churn without saying so.
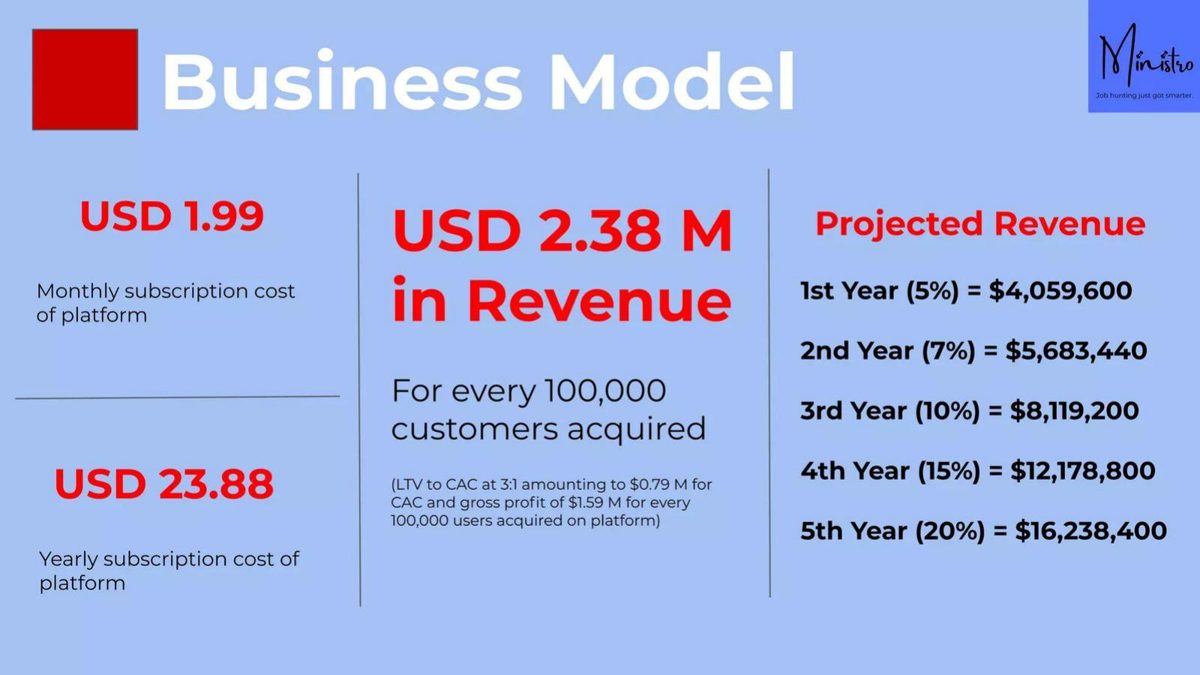
Ministro deck, slide 10. Exact stored slide matched to this analysis.
Our analysis: A revenue-based ratio with the margin figure beside it.
Evidence and limitation: Our calculation: LTV is one year of revenue; ratio 3.0 on revenue, 2.0 on the slide's own gross profit.
What a founder can adapt: Headline the gross-profit ratio and state the assumed customer life.
Supporting analysis
What the deck claims: USD 1.99/month, USD 23.88/year; "USD 2.38 M in Revenue For every 100,000 customers acquired (LTV to CAC at 3:1 amounting to $0.79 M for CAC and gross profit of $1.59 M...)".
Presentation choice: Shows enough arithmetic to check.
When it does not fit: Don't call one year of revenue lifetime value.
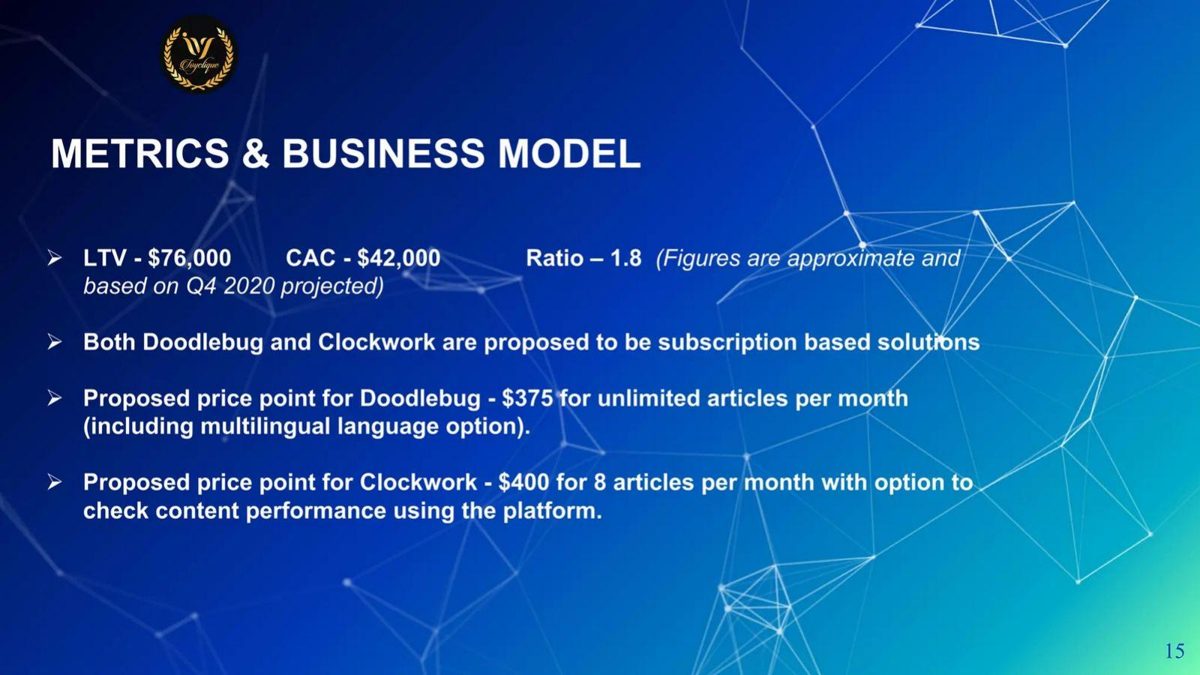
Content software. "Metrics & Business Model" page (projected for Q4 2020).
IvyClique deck, slide 15. Exact stored slide matched to this analysis.
Our analysis: Honestly labelled, but the implied customer life is very long.
Evidence and limitation: Our calculations: ratio 1.81; $76,000 is about 203 months (17 years) at $375.
What a founder can adapt: State the assumed customer life and margin.
Supporting analysis
What the deck claims: "LTV - $76,000 CAC - $42,000 Ratio - 1.8 (Figures are approximate and based on Q4 2020 projected)"; proposed prices $375 and $400 per month.
Presentation choice: Labels the figures as projected and approximate.
When it does not fit: Don't project an LTV that needs customers to stay for decades.
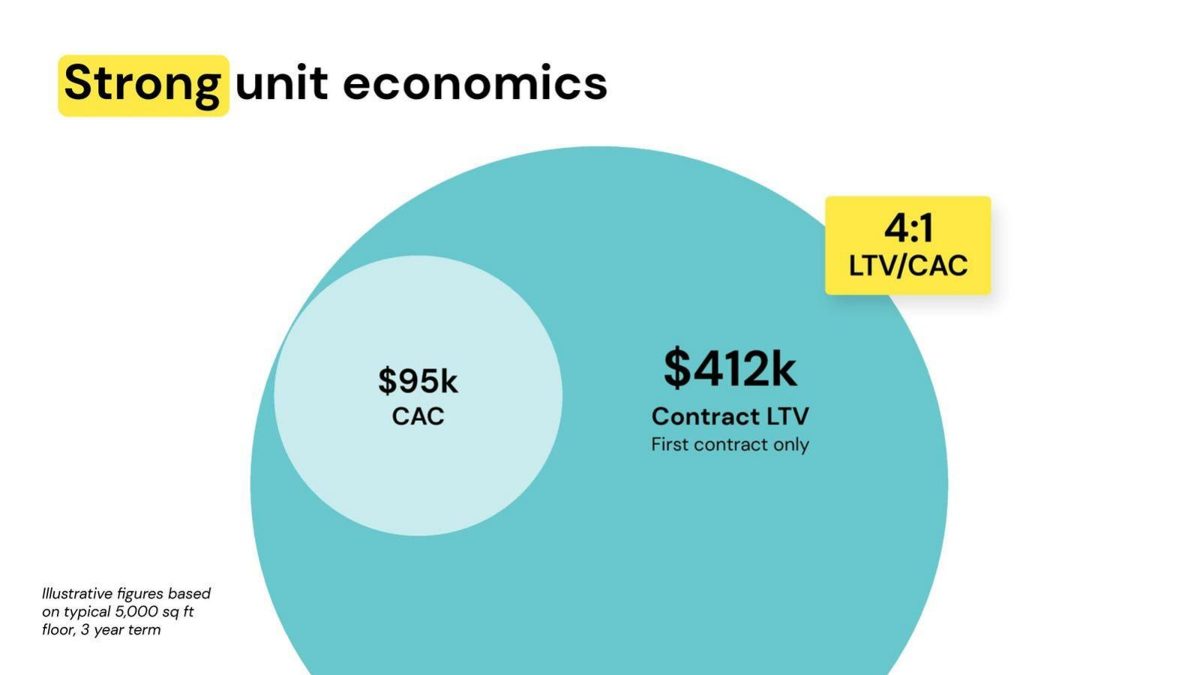
Flexible office provider. "Strong unit economics" page.
Kitt deck, slide 17. Exact stored slide matched to this analysis.
Our analysis: A conservative, clearly labelled illustration.
Evidence and limitation: Our calculation: 4.34, rounded down to 4:1. Revenue or margin not stated.
What a founder can adapt: Say whether the $412k is margin and what the CAC includes.
Supporting analysis
What the deck claims: "$95k CAC"; "$412k Contract LTV First contract only"; "4:1 LTV/CAC"; "Illustrative figures based on typical 5,000 sq ft floor, 3 year term".
Presentation choice: Counts only the first contract and rounds down.
When it does not fit: Don't drop the illustrative label when the figures move to another slide.
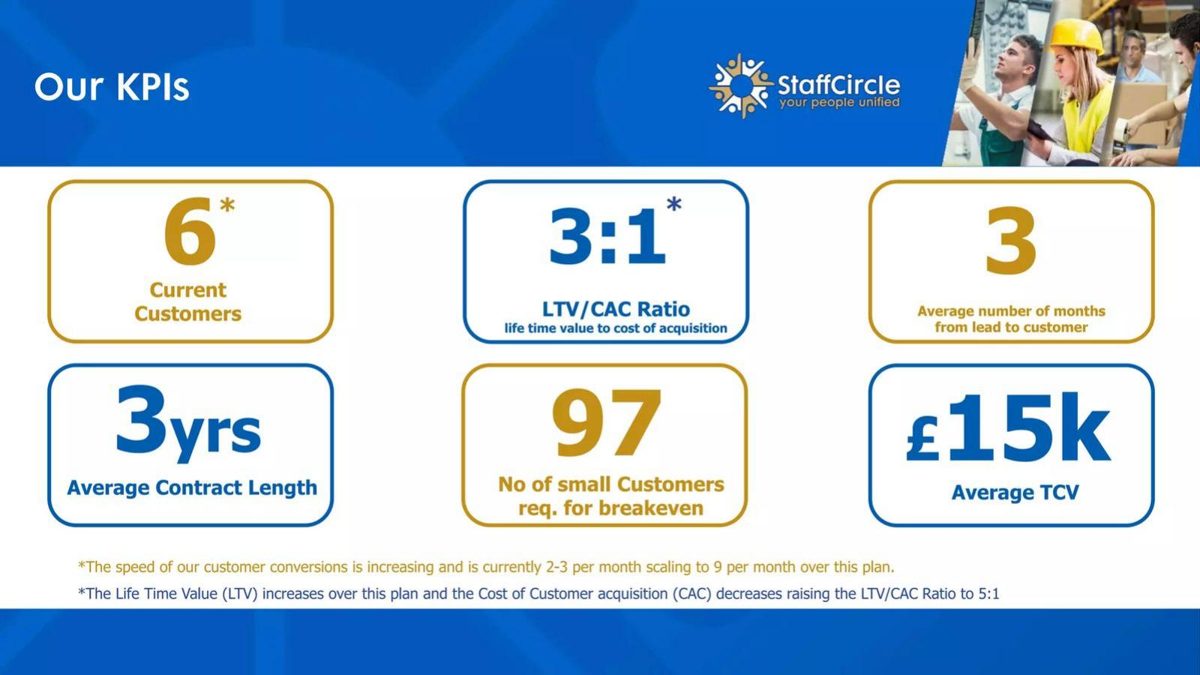
StaffCircle deck, slide 12. Exact stored slide matched to this analysis.
Our analysis: A ratio shown beside its sample size.
Evidence and limitation: Our calculation: if LTV equals the £15k contract, CAC is about £5,000. Six customers is a small base.
What a founder can adapt: Say what changes in the plan move the ratio to 5:1.
Supporting analysis
What the deck claims: "6 Current Customers"; "3:1 LTV/CAC Ratio"; "3yrs Average Contract Length"; "£15k Average TCV"; footnote: the ratio rises "to 5:1" over the plan.
Presentation choice: The customer count lets an investor weigh the ratio.
When it does not fit: Don't project a better ratio without naming the lever.
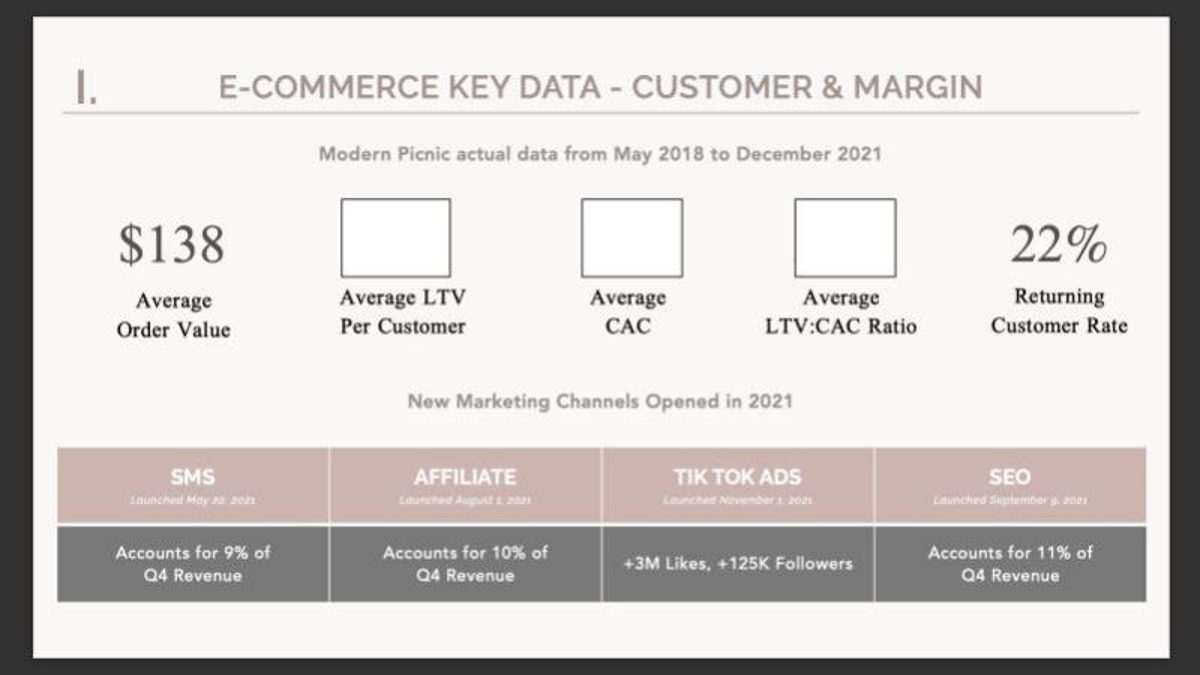
Accessories brand. "E-Commerce Key Data - Customer and Margin" page.
Modern Picnic deck, slide 19. Exact stored slide matched to this analysis.
Our analysis: A promised ratio not delivered.
Evidence and limitation: The three key boxes are blank in the copy we have.
What a founder can adapt: If figures are removed before sharing, mark them as available on request.
Supporting analysis
What the deck claims: "Modern Picnic actual data from May 2018 to December 2021"; "$138 Average Order Value"; "22% Returning Customer Rate"; LTV, CAC and ratio boxes empty.
Presentation choice: Shows order value and repeat rate, two LTV inputs.
When it does not fit: Don't leave empty boxes under an "actual data" heading.
Columns report what each slide states or leaves out; checks are our calculations.
Example
Ratio shown
LTV basis
Measured or projected
Rebuildable?
Liftit
8.41x
Margin
Measured, 3 months
Yes
Ministro
3:1
One year of revenue
Projected
Yes; 2:1 on gross profit
Contactually
None (our 8.9)
Not stated
Not stated
Partly
IvyClique
1.8
Not stated
Projected
Ratio only; life implied about 17 years
Kitt
4:1
First contract
Illustrative
Yes (4.34)
StaffCircle
3:1
Not stated
6 customers
No
FuelFinance
7/1
Not stated
Not stated
No; lives disagree
Map15
None (our 8)
Not stated
24 sales
Ratio only
MySwimPro
None (our 1.8)
Not stated
Paid channel
Ratio only
Option Alpha
$64 vs under $1
Not stated
Organic only
Ratio only
Front
2.5 to 4.4
Not stated
3 quarters
No
Magroove
8.78
Not stated
10 months
No
UNest
None (our 50 to 67)
Estimated range
Early
No
Curastory
876:1
Not stated
Beta
No
Modern Picnic
Blank
Blank
"Actual"
No
Key Takeaways
Build LTV from margin, not revenue. Liftit uses its 12% service margin; Ministro's 3:1 falls to 2:1 on its own gross profit (our calculation).
Show the inputs. Liftit's revenue, cost, churn and life multiply through to its LTV and ratio exactly (our check).
Say whether figures are measured or projected. IvyClique and Kitt label theirs as projected and illustrative; Map15's rests on 24 cars sold.
Check the customer life is believable. IvyClique's $76,000 LTV implies about 17 years at its proposed price (our calculation).
Don't blend channels into one ratio. Option Alpha's "$64 vs under $1" is organic traffic only.
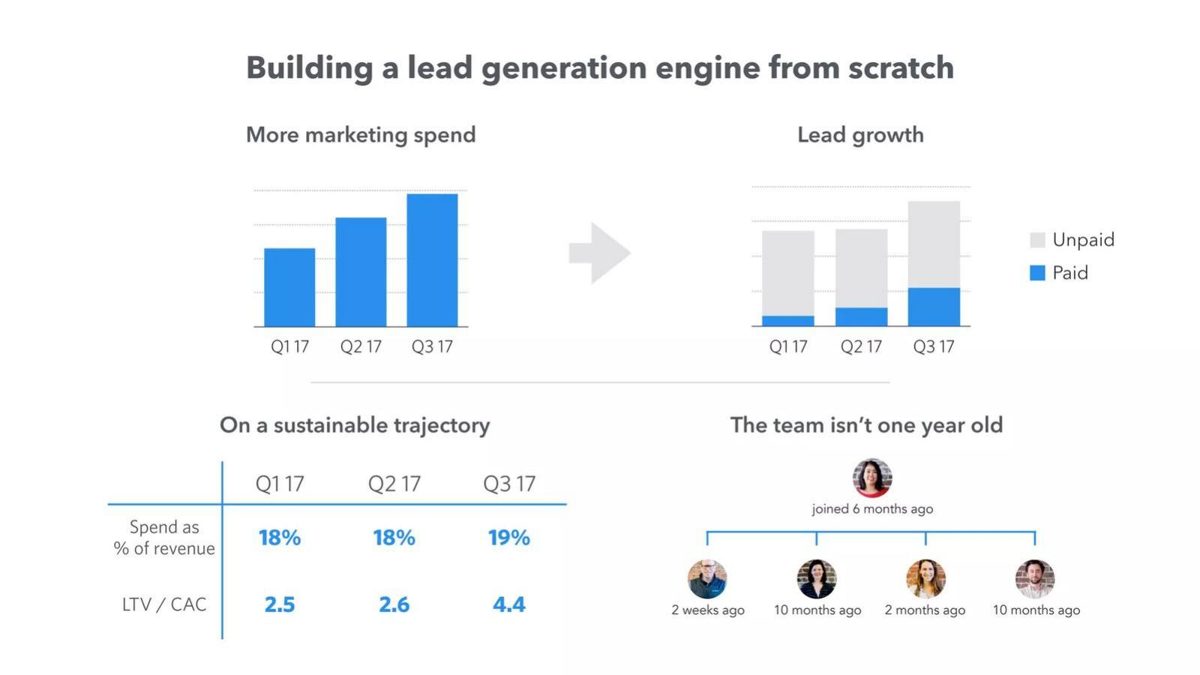
Show the trend. Front's LTV/CAC rose from 2.5 to 4.4 over three quarters while spend held near 18% of revenue.
Build your LTV to CAC line
Fill in each field. If a value is an assumption, say so on the slide.
Revenue. Average revenue per customer per month?
Margin. Gross margin on that revenue?
Life. Monthly churn, or assumed life and why?
LTV. Monthly margin times life?
CAC. Total sales and marketing spend divided by new customers, over what period and which channels?
Base. How many customers and months are the figures based on?
Copyable framework: Revenue $[X]/month at [Y]% gross margin; churn [Z]%/month ([months] of data), so life about [L] months. LTV $[margin times life]. CAC $[C] ([channels], [period], [N] customers). LTV:CAC [ratio].
Illustrative example 1 — written by us
Before: LTV to CAC at 3:1
After: Gross profit per customer $15.90 a year against CAC $7.90: 2:1 in year one, assuming customers stay one year (projected).
What improved: Uses Ministro's own figures per customer and headlines the gross-profit ratio.
What an LTV to CAC ratio tells an investor
The ratio compares what a customer is worth over their whole relationship with the company against what it cost to win them. A ratio of 3 or more is a common rule of thumb for a healthy business, which is why so many slides in this set print "3:1" or "3x". But the rule assumes a particular definition: lifetime value counted in gross margin (what is left after the direct cost of serving the customer), acquisition cost including all sales and marketing spend, and both measured on the same group of customers over the same period.
Most of the slides in this set do not say which definition they use. The most common gap is revenue versus margin. A customer who pays $1,000 over their lifetime but costs $800 to serve is worth $200 to the company, not $1,000. Counting revenue inflates the ratio by the inverse of the margin: at a 20% margin, a revenue-based ratio is five times the margin-based one.
The second gap is customer life. Lifetime value is usually monthly margin divided by monthly churn (a customer who has a 5% chance of leaving each month stays about 20 months on average). Early companies often do not have enough history to measure churn, so they assume a life. The assumption should be stated, because a long assumed life is the easiest way to make a ratio look strong.
The third gap is sample and period. A ratio measured on 24 sales, six customers or one quarter is a starting signal, not a proof. A ratio that includes only organic sign-ups is not the ratio the company will see once it pays for growth. Investors do not expect early companies to have perfect data; they expect the slide to say what the data is.
Slides that let an investor rebuild the ratio
Liftit's page 12, "Units economics", shows "Last 3-months of Operation - Group level" across five countries: monthly revenue per customer $9,492, cost for these customers $8,353, average service margin 12%, churn 5%, average customer life 20 months, LTV per customer $22,781, CAC per customer $2,708 and LTV to CAC 8.41x. Our checks: $9,492 minus $8,353 is $1,139, which is 12.0% of revenue; one divided by 5% monthly churn is 20 months; $1,139 times 20 is $22,780; and $22,781 divided by $2,708 is 8.41. Every figure is consistent. The LTV is built from margin, not revenue, and the period is stated. The limit is the window: three months of churn is a short basis for a 20-month life, and the slide does not say how CAC was calculated.
Ministro's page 10, "Business Model", prices a subscription at USD 1.99 a month or USD 23.88 a year, and says "USD 2.38 M in Revenue For every 100,000 customers acquired (LTV to CAC at 3:1 amounting to $0.79 M for CAC and gross profit of $1.59 M for every 100,000 users acquired on platform)". Our checks: 100,000 times $23.88 is $2.388M, so lifetime value here is one year of revenue. $0.79M plus $1.59M is $2.38M, and $2.38M divided by $0.79M is 3.0. But on the gross profit the slide itself gives, $1.59M divided by $0.79M is 2.0. The slide shows enough to find this, which is to its credit, but the ratio it headlines counts revenue as value and assumes each customer stays exactly one year.
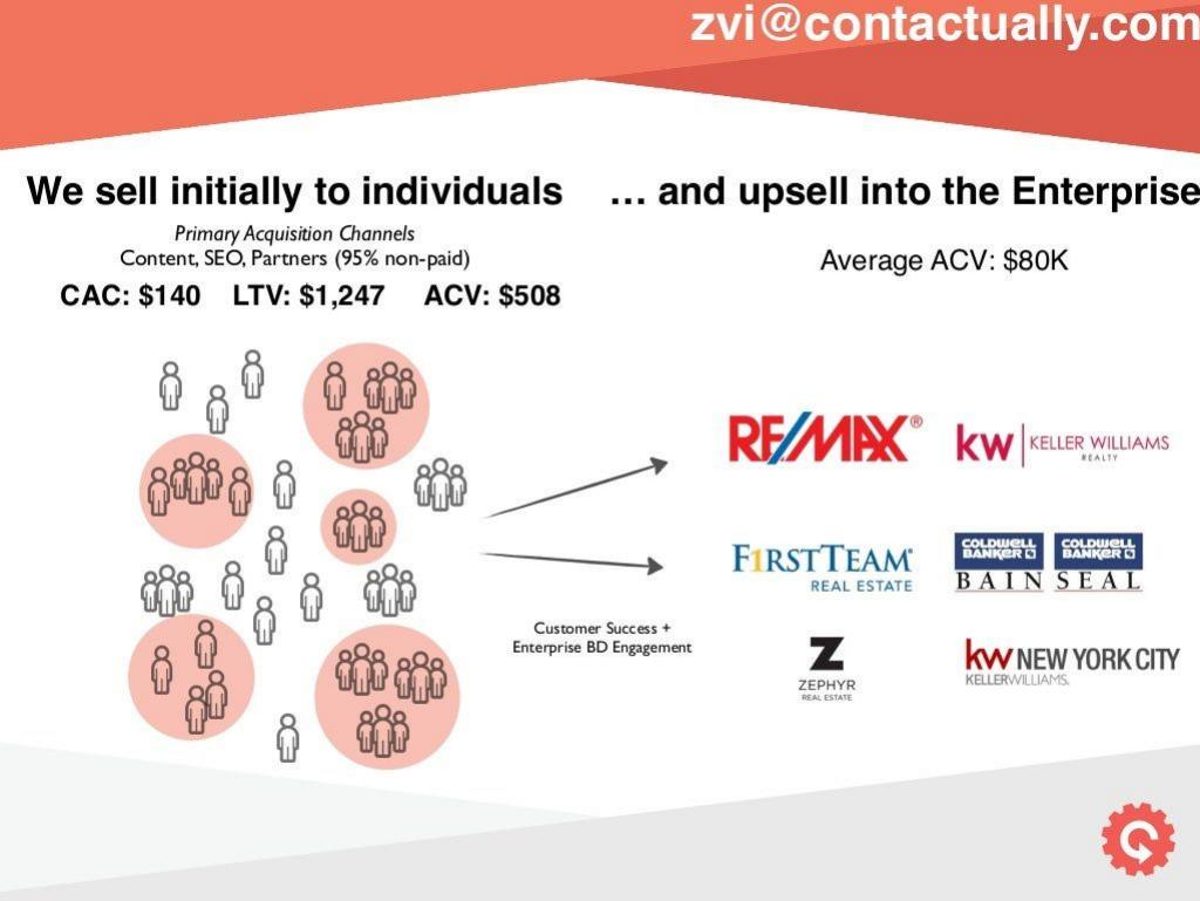
Contactually's page 7, "We sell initially to individuals ... and upsell into the Enterprise", gives "CAC: $140 LTV: $1,247 ACV: $508" for individual users, with acquisition through "Content, SEO, Partners (95% non-paid)", and "Average ACV: $80K" for enterprise accounts. Our calculations: the LTV to CAC ratio is about 8.9, and the LTV equals about 2.5 years of annual contract value. The slide does not say whether $1,247 is revenue or margin, and a CAC built 95% from unpaid channels may not hold once paid channels are added. The enterprise ACV has no matching CAC or LTV.
Projected and illustrative ratios
IvyClique's page 15, "Metrics & Business Model", gives "LTV - $76,000 CAC - $42,000 Ratio - 1.8 (Figures are approximate and based on Q4 2020 projected)", with proposed prices of $375 a month for one product and $400 a month for the other. Our calculations: $76,000 divided by $42,000 is 1.81, matching. At $375 a month, $76,000 is about 203 months of revenue, roughly 17 years; at $400 it is about 190 months. The honest parts are the label (projected, approximate) and the modest ratio. The slide does not say how long customers are assumed to stay, whether the LTV is revenue or margin, or why acquisition would cost $42,000 for a $375-a-month subscription.
Kitt's page 17, "Strong unit economics", shows "$95k CAC", "$412k Contract LTV First contract only" and "4:1 LTV/CAC", with the note "Illustrative figures based on typical 5,000 sq ft floor, 3 year term". Our calculation: $412k divided by $95k is 4.34, which the slide rounds down to 4:1. Rounding down and counting only the first contract are both conservative choices, and the illustrative label is clear. The slide does not say whether $412k is revenue or margin, or what the $95k acquisition cost includes.
StaffCircle's page 12, "Our KPIs", shows "6 Current Customers", "3:1 LTV/CAC Ratio", "3 Average number of months from lead to customer", "3yrs Average Contract Length", "97 No of small Customers req. for breakeven" and "£15k Average TCV". A footnote says "The Life Time Value (LTV) increases over this plan and the Cost of Customer acquisition (CAC) decreases raising the LTV/CAC Ratio to 5:1". The strength is putting the customer count beside the ratio: an investor can see the 3:1 rests on six customers. Our calculation: if LTV equals the £15k contract value, a 3:1 ratio implies acquisition cost of about £5,000. The slide does not say what the plan changes to move the ratio to 5:1.
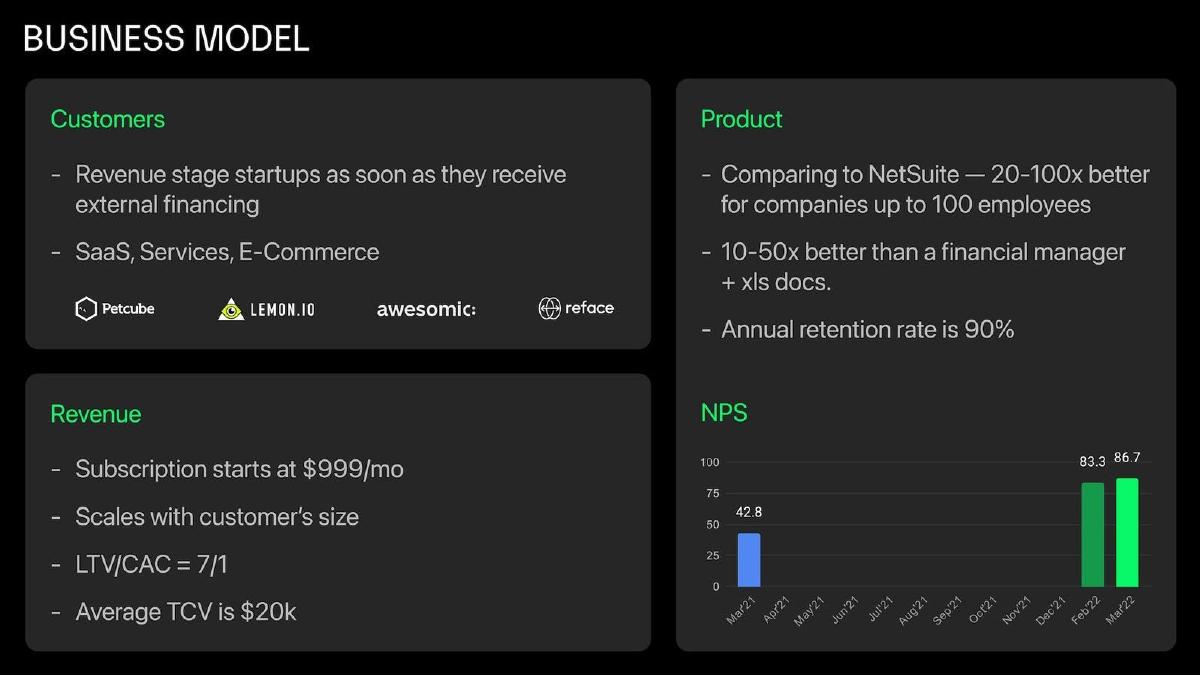
FuelFinance's page 6, "Business Model", lists "Subscription starts at $999/mo", "LTV/CAC = 7/1", "Average TCV is $20k" and "Annual retention rate is 90%". Our calculations: $20,000 at $999 a month is about 20 months of subscription, while a 90% annual retention rate would imply an average life of about 10 years if it held. The two figures describe very different customer lives, and the slide does not say which one the 7/1 is built on.
Ratios measured on a small or narrow base
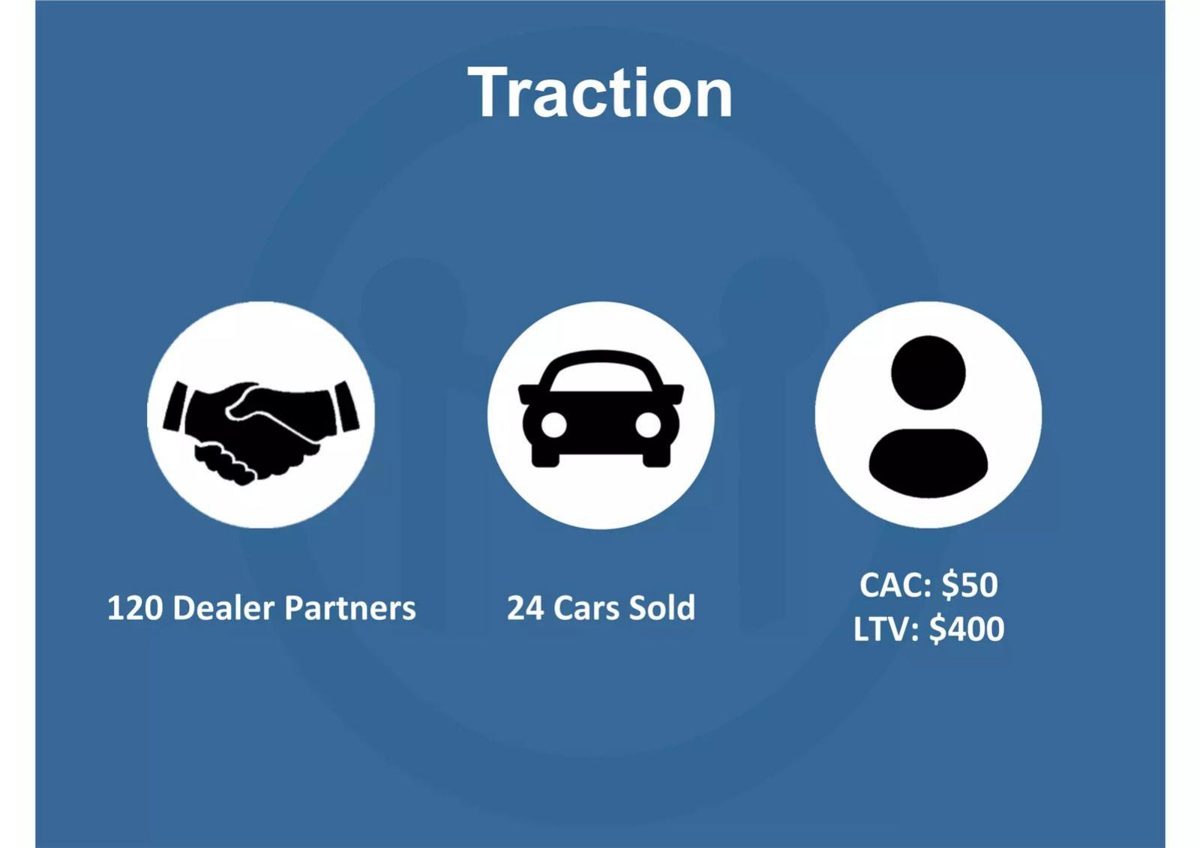
Map15's page 9, "Traction", shows "120 Dealer Partners", "24 Cars Sold" and "CAC: $50 LTV: $400". Our calculation: a ratio of 8. The slide does not say whether the customer is the car buyer or the dealer, and 24 sales is a small base for a lifetime figure; a car buyer's lifetime value in particular is hard to observe after a few months.
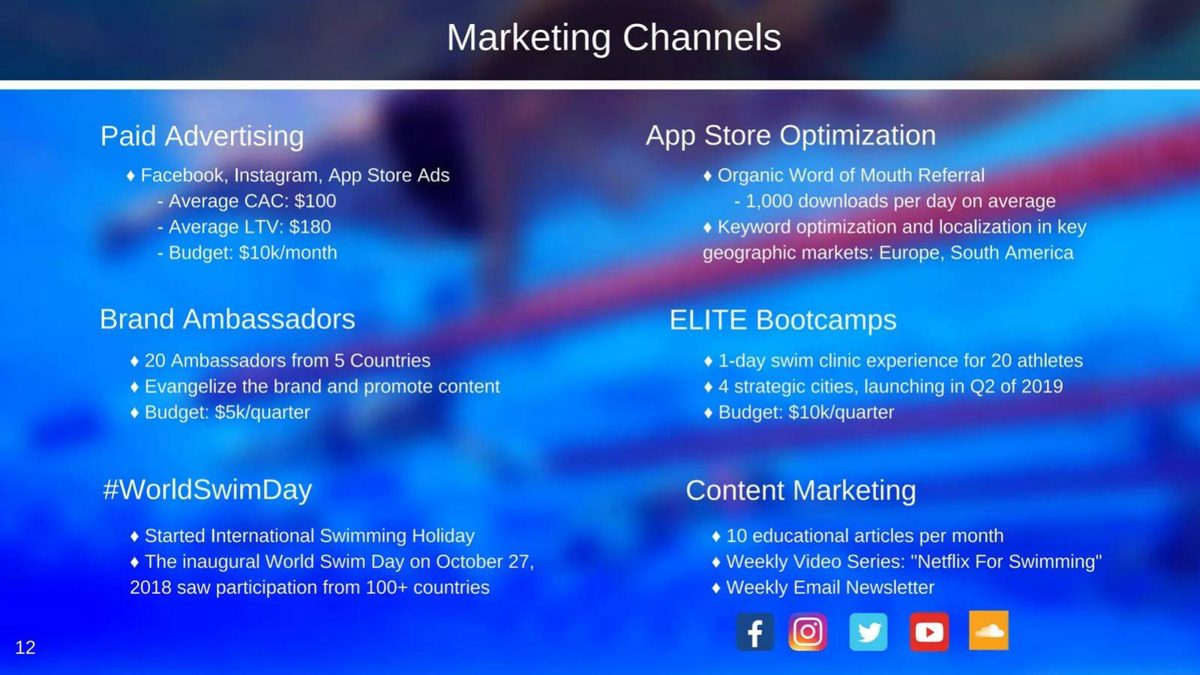
MySwimPro's page 12, "Marketing Channels", gives for paid advertising on Facebook, Instagram and App Store Ads "Average CAC: $100", "Average LTV: $180" and "Budget: $10k/month". Our calculations: a ratio of 1.8, and at $100 per customer the budget buys about 100 paying customers a month. This is a modest, channel-specific figure, which is more useful to an investor than a blended one. It is below the common 3:1 rule of thumb, and the slide does not say how the company plans to improve it or whether $180 is revenue or margin.
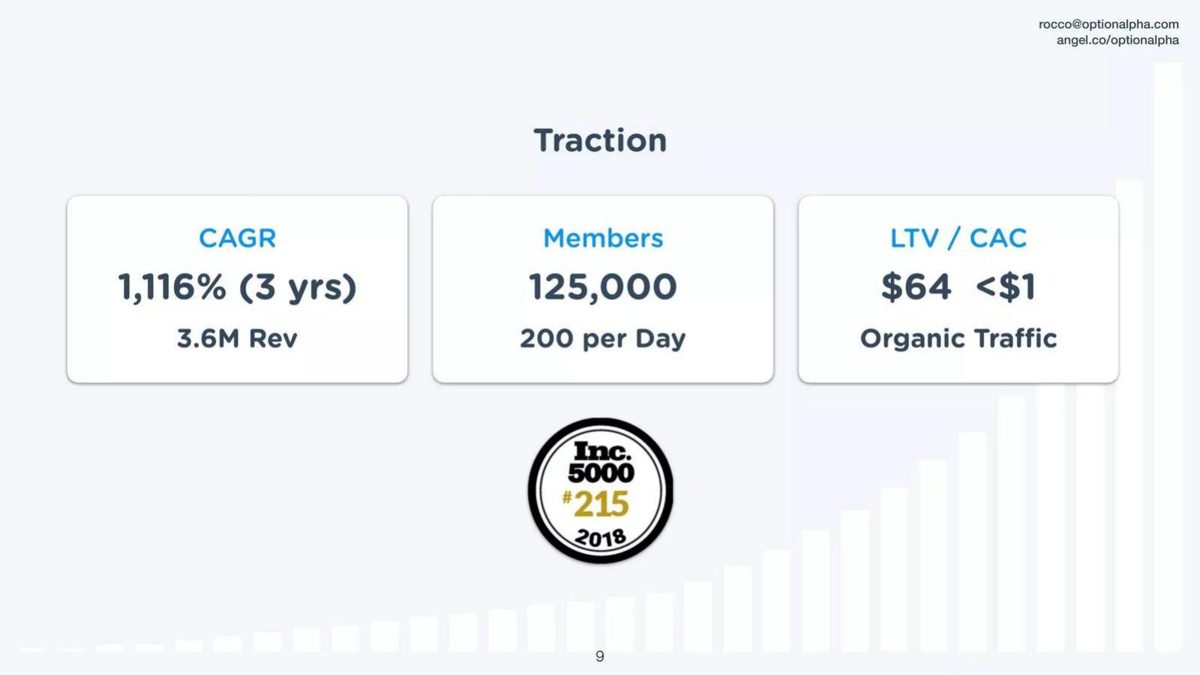
Option Alpha's page 9, "Traction", shows "LTV / CAC $64 under $1 Organic Traffic" (the slide uses a less-than sign) beside "125,000 Members" and "3.6M Rev". Our calculation: a ratio of more than 64. The slide is clear that the acquisition cost is for organic traffic only, which is honest, but it means the ratio says nothing about what paid growth would cost.
Front's page 12, "Building a lead generation engine from scratch", shows marketing spend as a share of revenue of 18%, 18% and 19% for Q1 to Q3 2017, and LTV / CAC of 2.5, 2.6 and 4.4. Showing three quarters is more credible than one, and pairing the ratio with spend as a share of revenue shows the improvement did not come from cutting marketing. The slide does not define either LTV or CAC or give the underlying values.
Ratios with no visible basis
Magroove's page 16, "Marketing", says "70k+ artists signed up in the first 10 months, with a LTV/CAC ratio of 8.78" under "Google, Facebook and Instagram". Two decimal places suggest precision, but the slide gives no LTV, no CAC and no customer life. Ten months of sign-ups is a short basis for a lifetime figure, and sign-ups are not paying customers unless the slide says so.
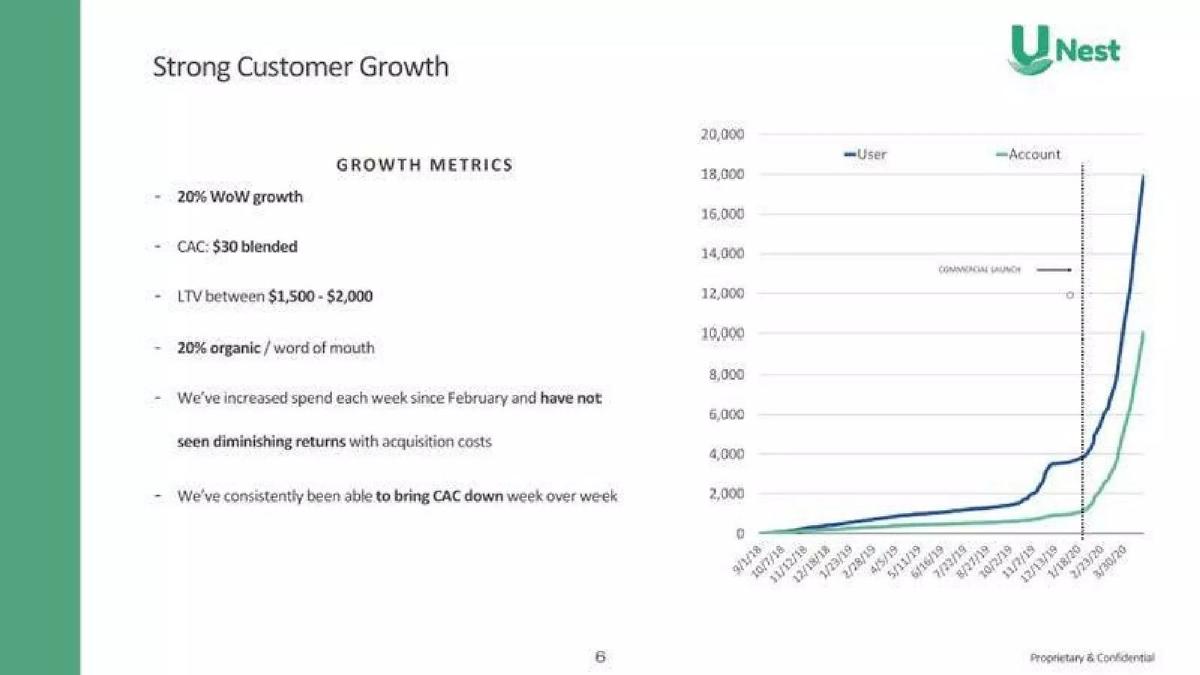
UNest's page 6, "Strong Customer Growth", lists "CAC: $30 blended" and "LTV between $1,500 - $2,000", with "We've consistently been able to bring CAC down week over week". Our calculation: a ratio of 50 to 67. The chart shows a commercial launch only a few months before the end of its data, so the LTV range must be an estimate, and the slide does not say how it was made.
Curastory's page 16, "Customer Acquisition Channels", shows "876:1 CLTV:CAC" beside "15% Beta Users 2,230 Sign-ups" and a channel chart. A ratio of 876 would mean acquisition cost is almost zero relative to value. With no LTV, no CAC and a beta user base, investors cannot tell what it measures.
Modern Picnic's page 19, "E-Commerce Key Data - Customer and Margin", is headed "Modern Picnic actual data from May 2018 to December 2021" and shows "$138 Average Order Value" and "22% Returning Customer Rate", but the boxes for "Average LTV Per Customer", "Average CAC" and "Average LTV:CAC Ratio" are empty in the copy we have. Whether the figures were removed before sharing or never filled in, the slide promises the ratio and does not deliver it. If you remove numbers before sharing a deck, say so on the slide.
How to show LTV and CAC on your slide
Show the inputs in a small table, as Liftit does: revenue per customer, gross margin, churn or assumed life, LTV, CAC, ratio. Every figure should multiply through to the next.
Count LTV in gross margin. If you only have revenue, say so and give the margin beside it so an investor can adjust.
State the customer life and where it comes from: measured churn over a stated period, or an assumption. If it is an assumption, keep it short.
Say what CAC includes (paid media only, or all sales and marketing including salaries) and which channels. Give channel ratios separately if they differ, as MySwimPro does.
Give the base: how many customers, over what months. StaffCircle's customer count beside its ratio is a good habit.
Label projections and illustrations as such, as IvyClique and Kitt do, and show a trend when you have one, as Front does.
Round conservatively. Kitt's 4.34 shown as 4:1 invites trust; Magroove's 8.78 invites a question about where the decimals come from.
Common mistakes
LTV in revenue. Count gross margin; revenue inflates the ratio.
Long assumed life. State the life and its basis; don't let decades of revenue carry the ratio.
No inputs. Show LTV, CAC and the parts they are built from.
Organic-only CAC. Say which channels, and add a paid CAC if you will pay for growth.
Tiny sample. Give the customer count and period.
False precision. Round conservatively; two decimals need a visible basis.
Diagnostic checklist
LTV is counted in gross margin, or the margin is shown beside it.
Customer life is stated with its basis.
CAC says which costs and channels it includes.
The customer count and period are given.
Projected or illustrative figures are labelled.
The ratio can be rebuilt from the figures on the slide.
Figures agree with contract value and retention elsewhere on the slide.
Frequently asked questions
What LTV to CAC ratio do investors expect?
Around 3 or more is a common rule of thumb, but only if LTV is margin-based. Ministro's revenue-based 3:1 is 2:1 on its own gross profit (our calculation).
Should LTV use revenue or gross margin?
Gross margin. Liftit builds its LTV from a 12% service margin; on revenue the same customer would look about eight times more valuable.
How do I show LTV if I don't have much churn data?
State the assumed life and label it as an assumption, as IvyClique labels its figures projected. Keep the assumption short; long lives inflate the ratio.
Should I show one blended ratio or one per channel?
Per channel when they differ. MySwimPro's paid-channel 1.8 is more useful than a blended figure; Option Alpha's organic-only ratio says nothing about paid growth.
Is a very high ratio a good thing to show?
Only with its inputs. Curastory's 876:1 and UNest's 50 to 67 invite scepticism without the numbers behind them.
How we chose these examples
Search (2026-09-30): the durable corpus index (docs/seo/artifacts/corpus-search, 70,729 unique pages, deduplicated by deck-file sha256 + page) was searched for "LTV/CAC", "LTV:CAC" and LTV or lifetime value within a short distance of CAC; about 110 pages matched after excluding public companies and SPACs.
Seventeen candidate pages were rendered from the original public deck files and read from the images; fifteen are used: Liftit 12, Ministro 10, Contactually 7, IvyClique 15, Kitt 17, StaffCircle 12, FuelFinance 6, Map15 9, MySwimPro 12, Option Alpha 9, Front 12, Magroove 16, UNest 6, Curastory 16 and Modern Picnic 19.
Left out after image review: Hardbacon 20 and Mentimeter 4 (each a bare LTV and CAC pair with no basis, the same lesson as UNest). Not used because the page already appears in another guide: Kredivo 31, Borzo 6, Afrocenchix 5, Veremark 15, Plantt 38 and Minut 5. Not rendered: public-company and SPAC pages (Clover Health, Matterport, Latch, Hims and Hers), and pages where the LTV and CAC values are redacted (Apollo, Arist, Bigblue, Tive).
Figures are as printed on each slide; we did not have the companies' underlying data. How we built this: drafted and checked with AI assistance (editorial model review against the original slide images); no human editor has reviewed this guide.