Payback Period on a Pitch Deck: Whose Money, Paid Back
How founders show CAC payback, customer payback and location payback on a pitch deck: what is being paid back, from revenue or gross profit.
How to Show a Payback Period on Your Pitch Deck, and Make It Reproducible
Fifteen slides from real pitch decks that state a payback period. For each, we record what is being paid back, what pays it back, whether the figure is measured or a target, and whether the slide's own numbers reproduce it.
TL;DR
A payback period is how long it takes for money spent to come back. On pitch decks the phrase covers at least three different things: CAC payback (how many months of a customer's gross profit it takes to recover what the company spent acquiring them), customer payback (how quickly the product pays for itself for the buyer) and unit payback (how quickly a new location, kitchen or machine recovers its set-up cost). A payback figure earns trust when the slide says which of these it is, whether it is calculated from revenue or gross profit, which customers or period it is measured on, and gives the inputs so a reader can reproduce it.
In this set, Evvnt gives every input: CAC of $177 and gross profit of $58.98 per month give 3.0 months, matching its stated "3 months" (our calculation). Kredivo and Nas.com show payback as a curve by customer cohort. Rippling breaks its 17-month figure into cross-sell and marginal versions with footnoted definitions. Several other slides state a payback with no inputs, and Arya's "Payback under 8 months" does not say what is being paid back.
Payback period slides from real pitch decks
Each example shows the exact page from the original public deck above its analysis and links to the full teardown. Figures are the companies' own and have not been verified. Calculations are ours and are labelled. Page numbers are PDF pages.
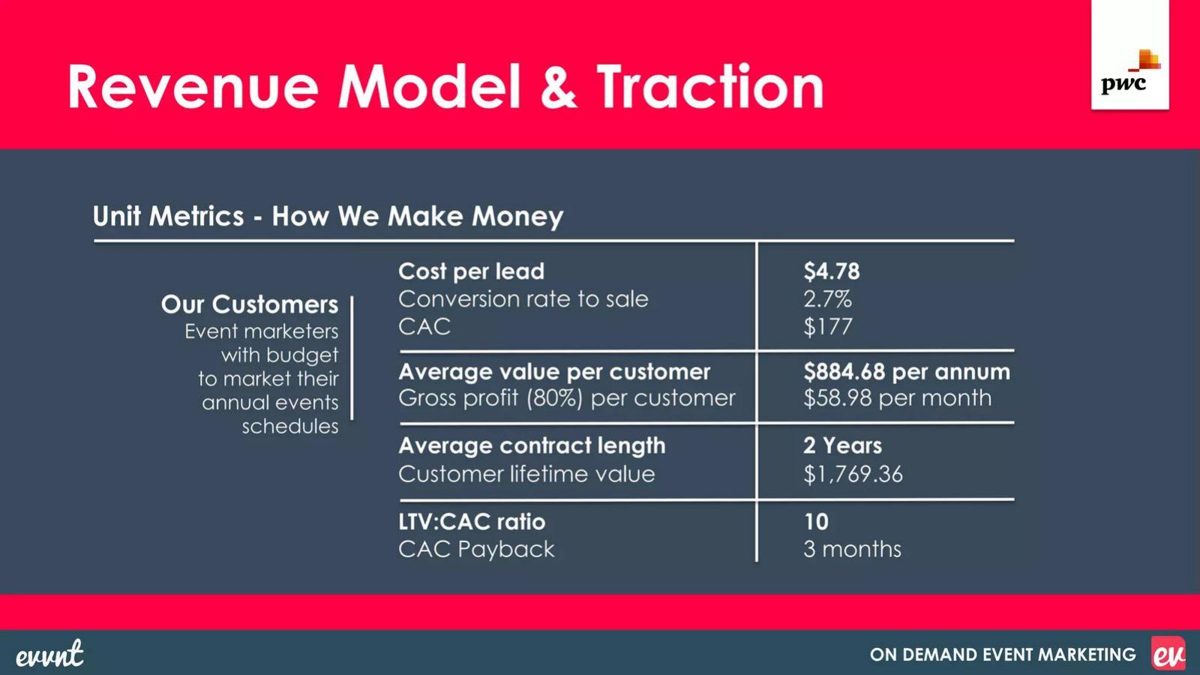
Evvnt unit economics slide — slide 10
Event marketing software. "Revenue Model & Traction" slide in an 18-page deck.
Evvnt deck, slide 10. Exact stored slide matched to this analysis.
Our analysis: Every input is on the slide, and the CAC and payback reproduce: $4.78 ÷ 2.7% ≈ $177; $177 ÷ $58.98 ≈ 3.0 months (our calculations).
Evidence and limitation: The lifetime value is two years of revenue; on gross profit it is $1,415.52 and LTV:CAC about 8.0, not 10 (our calculation).
What a founder can adapt: Use the same chain from cost per lead to payback, and use gross profit throughout.
Supporting analysis
What the deck claims: "Cost per lead $4.78"; "Conversion rate to sale 2.7%"; "CAC $177"; "Average value per customer $884.68 per annum"; "Gross profit (80%) per customer $58.98 per month"; "Average contract length 2 Years"; "Customer lifetime value $1,769.36"; "LTV:CAC ratio 10"; "CAC Payback 3 months".
Presentation choice: Every input is on the slide, and the CAC and payback reproduce: $4.78 ÷ 2.7% ≈ $177; $177 ÷ $58.98 ≈ 3.0 months (our calculations).
When it does not fit: The lifetime value is two years of revenue; on gross profit it is $1,415.52 and LTV:CAC about 8.0, not 10 (our calculation).
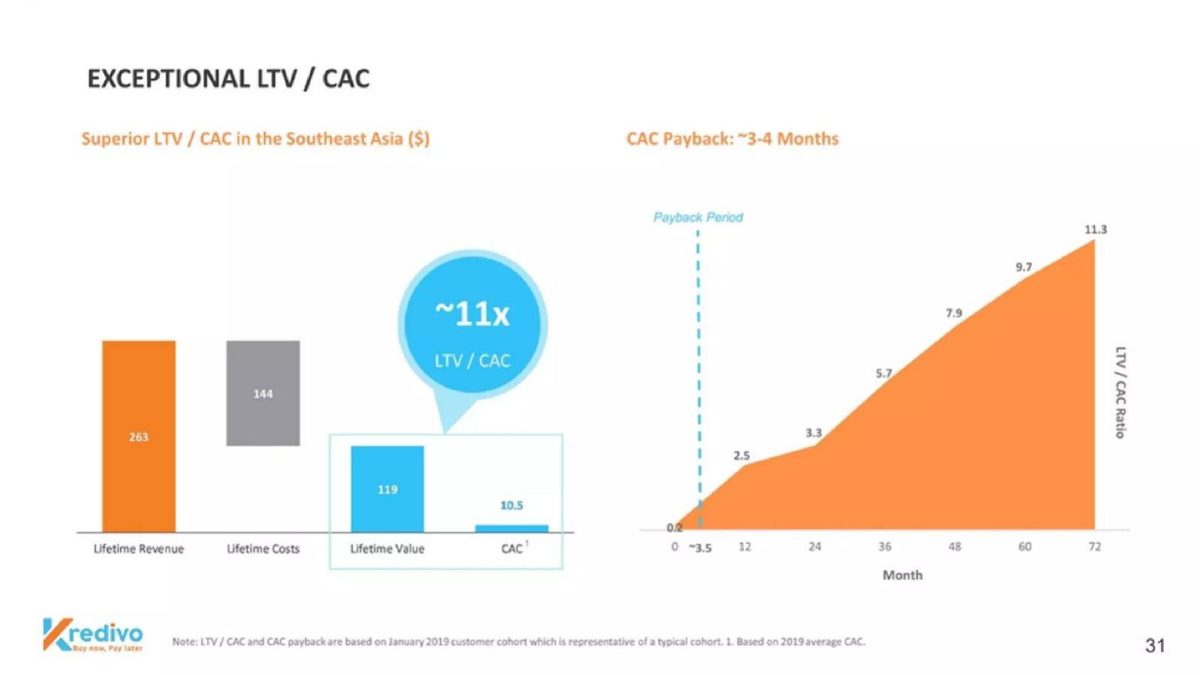
Buy-now-pay-later lender in Southeast Asia. "Exceptional LTV / CAC" slide in a 50-page presentation.
Kredivo deck, slide 31. Exact stored slide matched to this analysis.
Our analysis: It separates revenue from costs, names the cohort, and the ratio reproduces: 119 ÷ 10.5 ≈ 11.3 (our calculation).
Evidence and limitation: One "representative" cohort; show a second one so a reader can see the claim holds.
What a founder can adapt: Name your cohort and the CAC period in a footnote in the same way.
Supporting analysis
What the deck claims: "Lifetime Revenue" 263, "Lifetime Costs" 144, "Lifetime Value" 119, "CAC" 10.5, "~11x LTV / CAC"; "CAC Payback: ~3-4 Months" with a curve marked at ~3.5 months and reaching 11.3 at month 72. Note: based on the January 2019 customer cohort, CAC based on 2019 average.
Presentation choice: It separates revenue from costs, names the cohort, and the ratio reproduces: 119 ÷ 10.5 ≈ 11.3 (our calculation).
When it does not fit: One "representative" cohort; show a second one so a reader can see the claim holds.
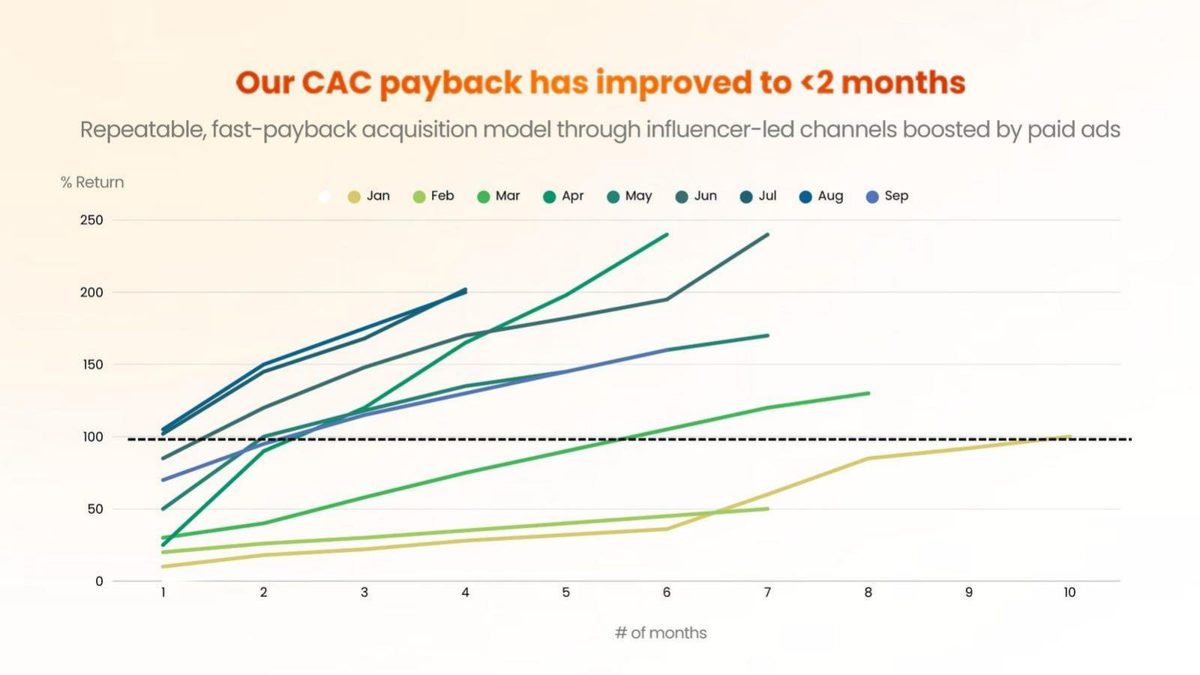
Community platform for creators. Slide 21 of a 24-page deck.
Nas.com deck, slide 21. Exact stored slide matched to this analysis.
Our analysis: The cohort chart shows the improvement rather than asserting it: by our reading, January took about ten months to reach 100%, while recent cohorts pass it in their first month or two.
Evidence and limitation: Recent cohorts have the shortest history; say how many customers each line covers.
What a founder can adapt: Say whether "return" is revenue or gross profit.
Supporting analysis
What the deck claims: "Our CAC payback has improved to <2 months"; "Repeatable, fast-payback acquisition model through influencer-led channels boosted by paid ads". A chart plots % return by month for cohorts from January to September against a 100% line.
Presentation choice: The cohort chart shows the improvement rather than asserting it: by our reading, January took about ten months to reach 100%, while recent cohorts pass it in their first month or two.
When it does not fit: Recent cohorts have the shortest history; say how many customers each line covers.
OneScreen (target) unit economics slide — slide 13
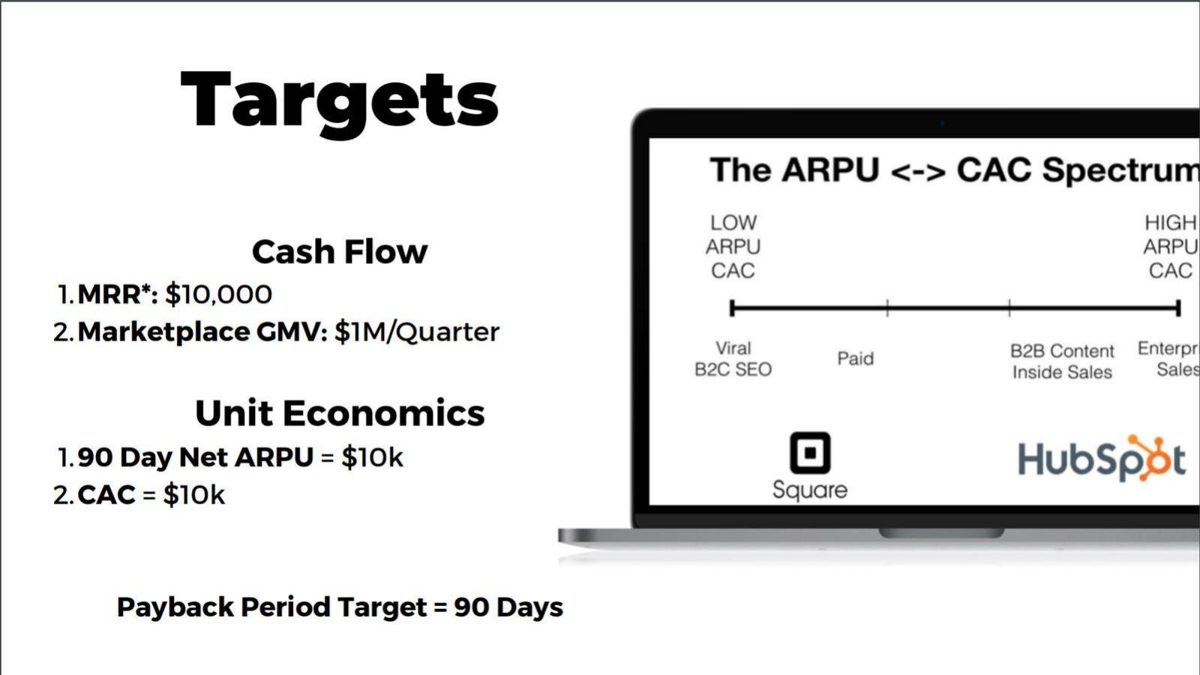
Out-of-home advertising marketplace. "Targets" slide in a 14-page deck.
OneScreen deck, slide 13. Exact stored slide matched to this analysis.
Our analysis: It is labelled as a target and shows how the payback follows from the two inputs.
Evidence and limitation: A target set equal to CAC produces the payback by definition; it says nothing about whether customers stay.
What a founder can adapt: Say whether net ARPU is before or after the cost of delivering the campaigns.
Supporting analysis
What the deck claims: Cash flow: "MRR: $10,000", "Marketplace GMV: $1M/Quarter". Unit economics: "90 Day Net ARPU = $10k", "CAC = $10k", "Payback Period Target = 90 Days".
Presentation choice: It is labelled as a target and shows how the payback follows from the two inputs.
When it does not fit: A target set equal to CAC produces the payback by definition; it says nothing about whether customers stay.
HR and IT software. Page 14 of a 15-page Series F memo.
Rippling deck, slide 14. Exact stored slide matched to this analysis.
Our analysis: The blended figure appears first, each narrower figure says what it excludes, and the benchmark is sourced.
Evidence and limitation: Marginal payback excludes shared marketing costs; never quote it without the blended figure.
What a founder can adapt: Show blended payback before any subset, and footnote what each includes.
Supporting analysis
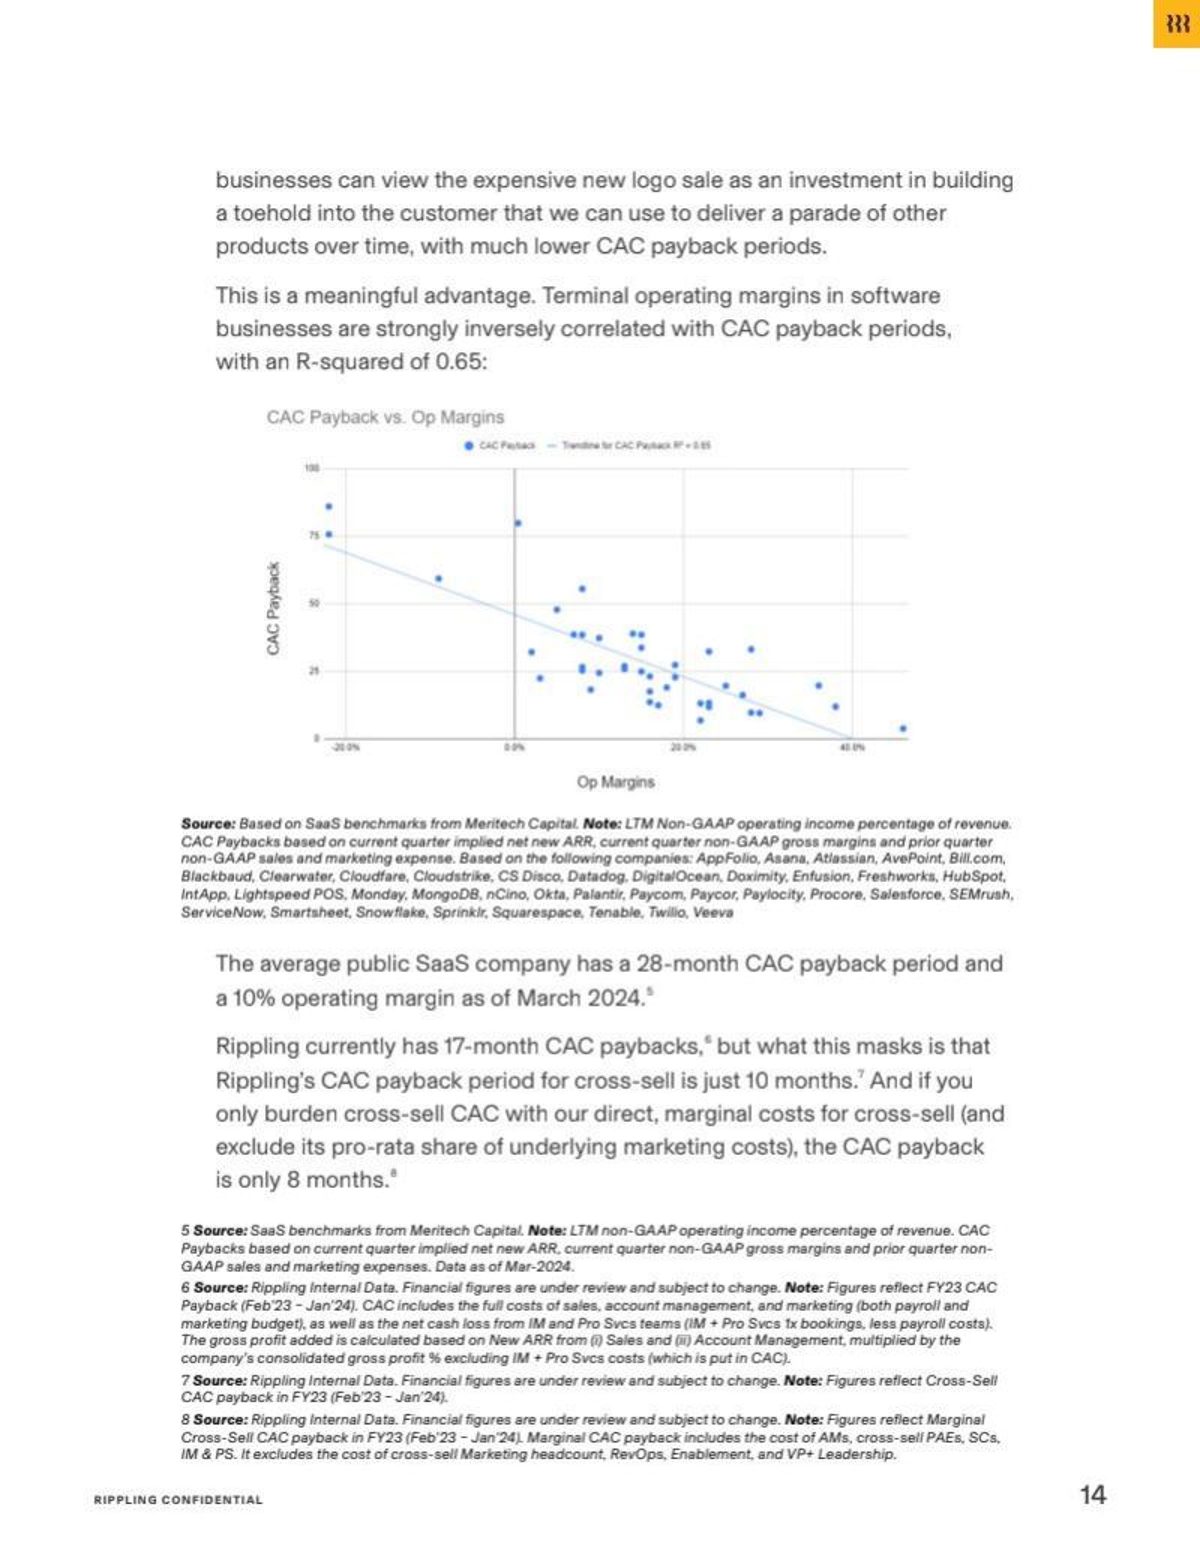
What the deck claims: "The average public SaaS company has a 28-month CAC payback period and a 10% operating margin as of March 2024" (Meritech Capital); "Rippling currently has 17-month CAC paybacks"; cross-sell "just 10 months"; marginal cross-sell "only 8 months". Footnotes define each and say figures are "under review and subject to change".
Presentation choice: The blended figure appears first, each narrower figure says what it excludes, and the benchmark is sourced.
When it does not fit: Marginal payback excludes shared marketing costs; never quote it without the blended figure.
Data labeling. "Supply Acquisition" slide in a 29-page Series C deck.
Scale AI deck, slide 28. Exact stored slide matched to this analysis.
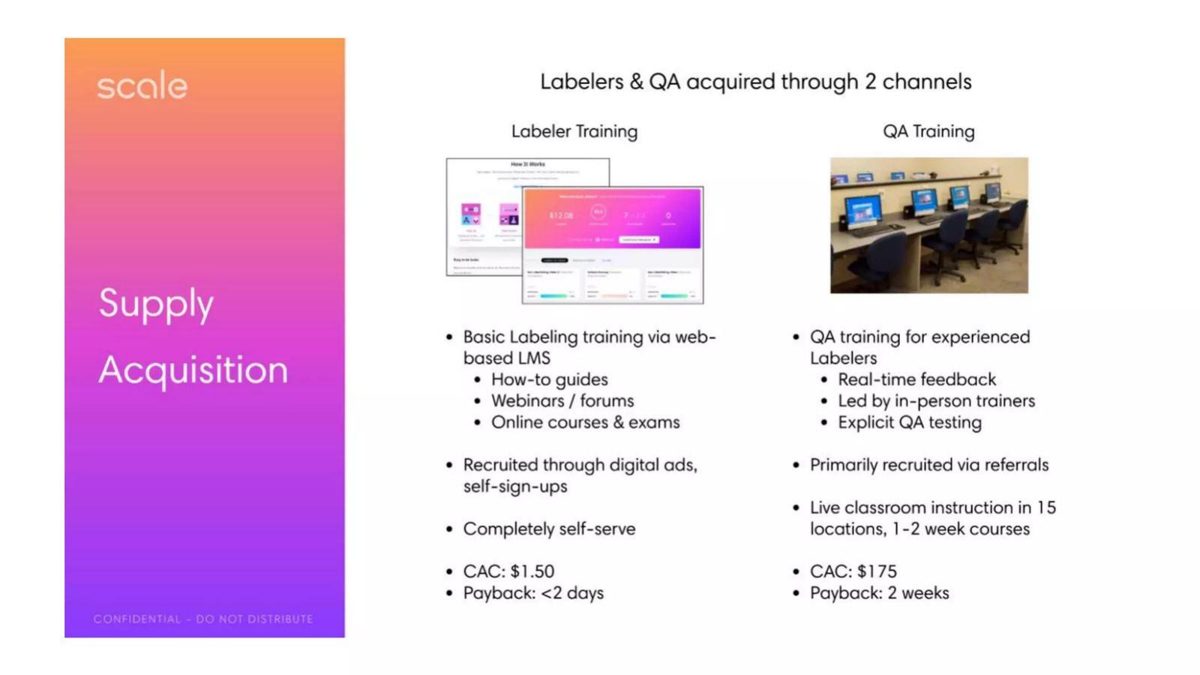
Our analysis: Payback is applied to the supply side, by channel, with the acquisition cost beside each.
Evidence and limitation: A short payback on workers matters only if they stay; add retention.
What a founder can adapt: Say what pays the cost back (margin on completed work) and how long recruits stay.
Supporting analysis
What the deck claims: Labelers "Recruited through digital ads, self-sign-ups", "CAC: $1.50", "Payback: <2 days"; QA "Primarily recruited via referrals", "CAC: $175", "Payback: 2 weeks".
Presentation choice: Payback is applied to the supply side, by channel, with the acquisition cost beside each.
When it does not fit: A short payback on workers matters only if they stay; add retention.
Product analytics. "Sales KPIs" slide in a 12-page deck; most figures are blacked out in the public copy.
Mixpanel deck, slide 8. Exact stored slide matched to this analysis.
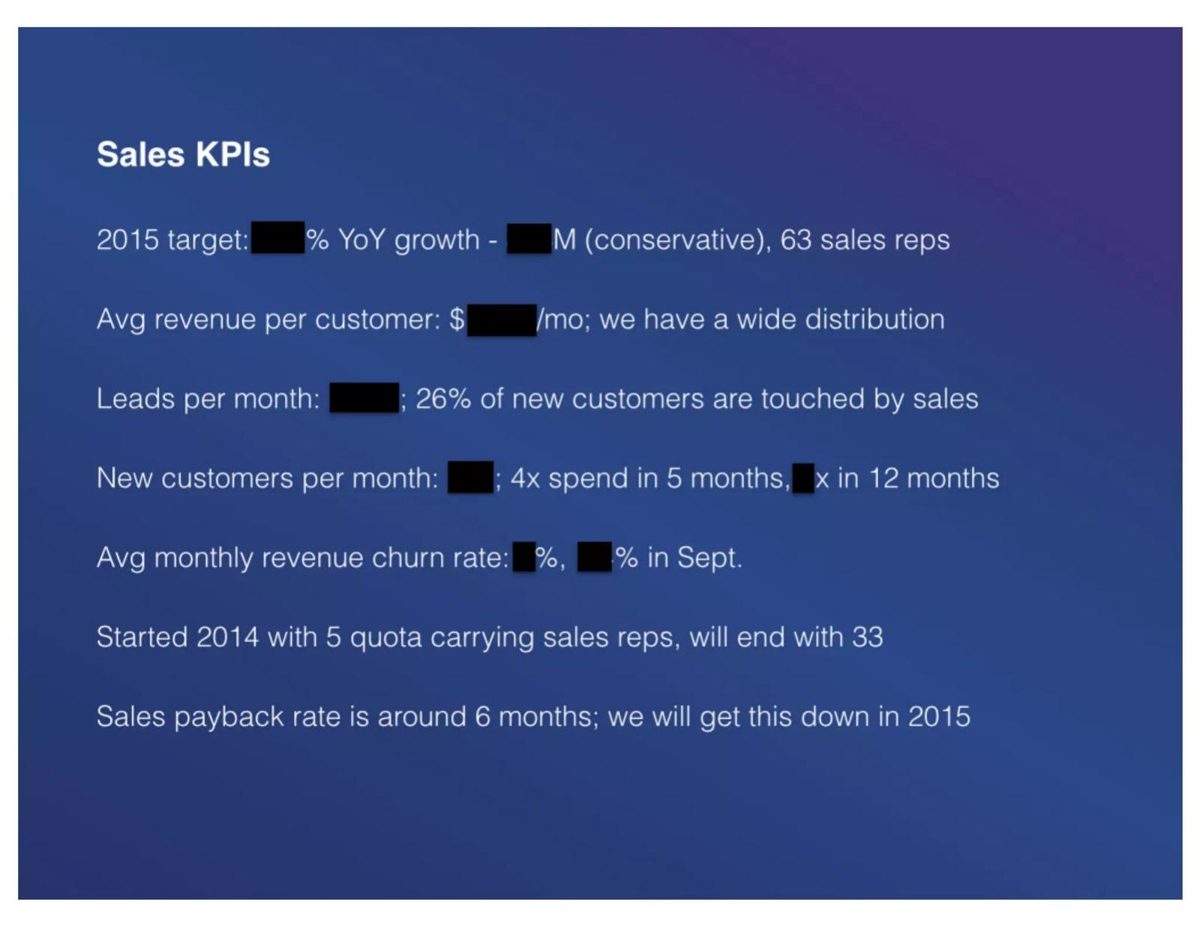
Our analysis: It states the current figure and admits it needs to improve, next to the sales hiring plan it depends on.
Evidence and limitation: "Around 6 months" with no inputs cannot be checked.
What a founder can adapt: Define sales payback (which costs, which revenue) and give a target for the coming year.
Supporting analysis
What the deck claims: "Started 2014 with 5 quota carrying sales reps, will end with 33"; "Sales payback rate is around 6 months; we will get this down in 2015".
Presentation choice: It states the current figure and admits it needs to improve, next to the sales hiring plan it depends on.
When it does not fit: "Around 6 months" with no inputs cannot be checked.
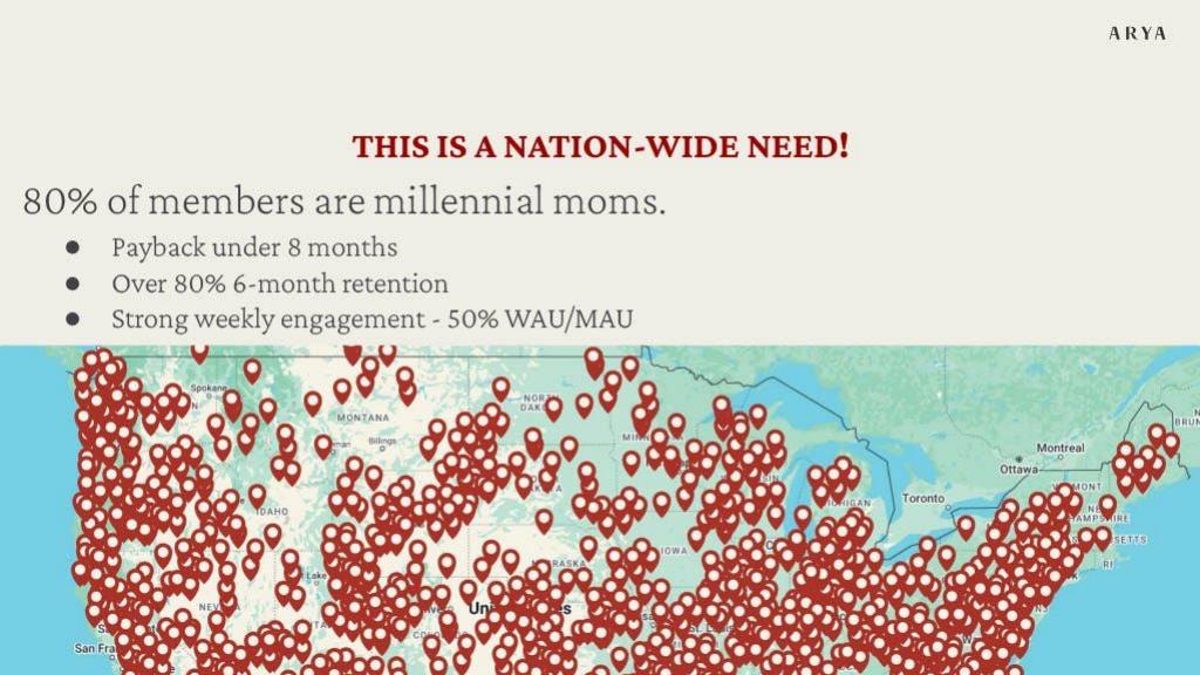
Membership service for mothers. "This is a nation-wide need!" slide in a 17-page deck, with a map of members.
Arya deck, slide 11. Exact stored slide matched to this analysis.
Our analysis: Payback sits beside retention, so a reader can see most members stay long enough to pay back.
Evidence and limitation: "Payback" alone doesn't say what is being paid back.
What a founder can adapt: Name it CAC payback and give the inputs.
Supporting analysis
What the deck claims: "80% of members are millennial moms"; "Payback under 8 months"; "Over 80% 6-month retention"; "Strong weekly engagement - 50% WAU/MAU".
Presentation choice: Payback sits beside retention, so a reader can see most members stay long enough to pay back.
When it does not fit: "Payback" alone doesn't say what is being paid back.
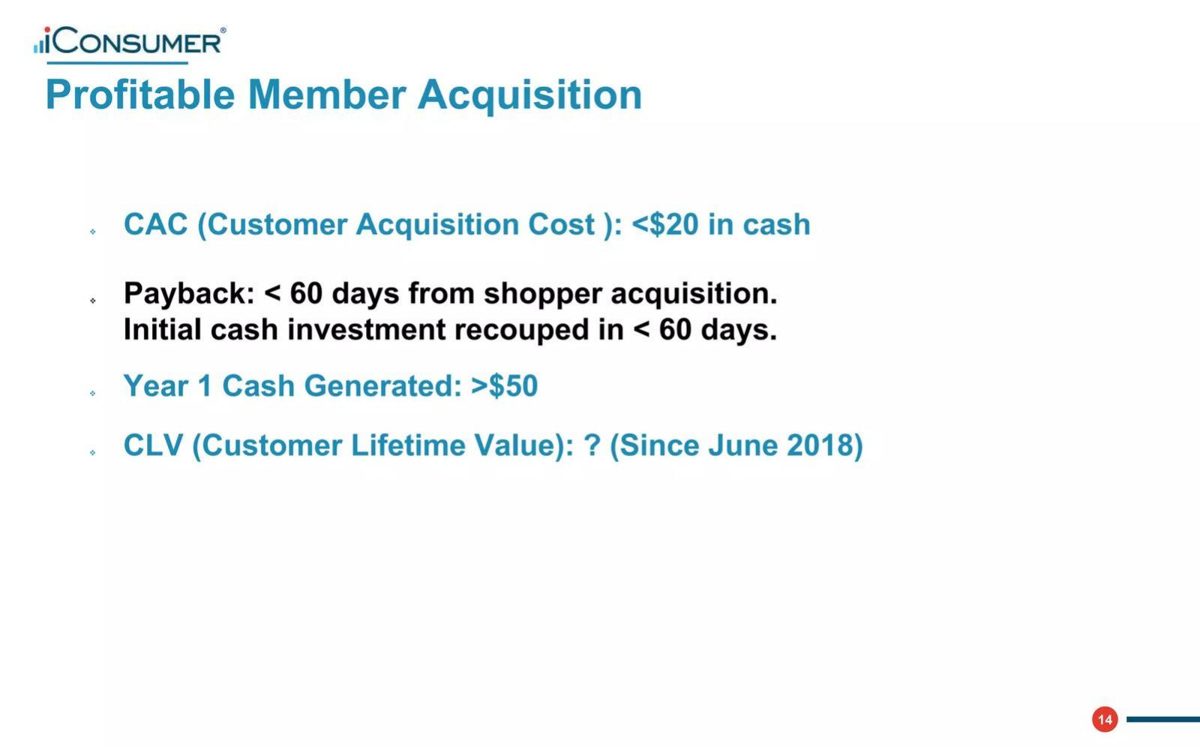
Shopping rewards. "Profitable Member Acquisition" slide in a 19-page deck.
iConsumer deck, slide 14. Exact stored slide matched to this analysis.
Our analysis: It gives cash CAC and first-year cash per member, and leaves lifetime value open instead of inventing it.
Evidence and limitation: "Cash" CAC may exclude staff costs; say what it covers.
What a founder can adapt: Say when "since June 2018" data will be enough to estimate lifetime value.
Supporting analysis
What the deck claims: CAC (Customer Acquisition Cost) of less than $20 in cash; payback in less than 60 days from shopper acquisition ("Initial cash investment recouped"); Year 1 cash generated of more than $50; "CLV (Customer Lifetime Value): ? (Since June 2018)".
Presentation choice: It gives cash CAC and first-year cash per member, and leaves lifetime value open instead of inventing it.
When it does not fit: "Cash" CAC may exclude staff costs; say what it covers.
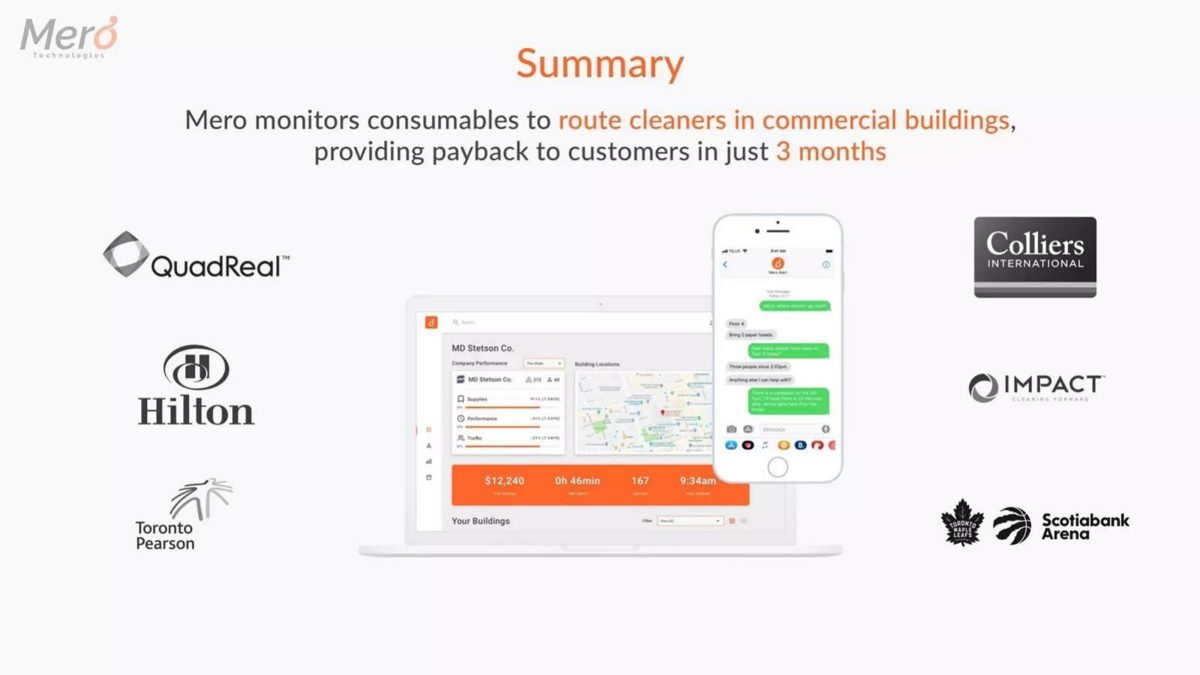
Sensors that route cleaning staff in commercial buildings. "Summary" slide in a 14-page deck with customer logos.
Mero Technologies deck, slide 13. Exact stored slide matched to this analysis.
Our analysis: It is clearly a customer payback claim, in the buyer's terms.
Evidence and limitation: Logos beside a payback claim imply each customer saw it; say whose figures it is.
What a founder can adapt: Attribute the 3 months to a named customer's savings and price.
Supporting analysis
What the deck claims: "Mero monitors consumables to route cleaners in commercial buildings, providing payback to customers in just 3 months"; logos include QuadReal, Hilton, Toronto Pearson, Colliers, Impact and Scotiabank Arena.
Presentation choice: It is clearly a customer payback claim, in the buyer's terms.
When it does not fit: Logos beside a payback claim imply each customer saw it; say whose figures it is.
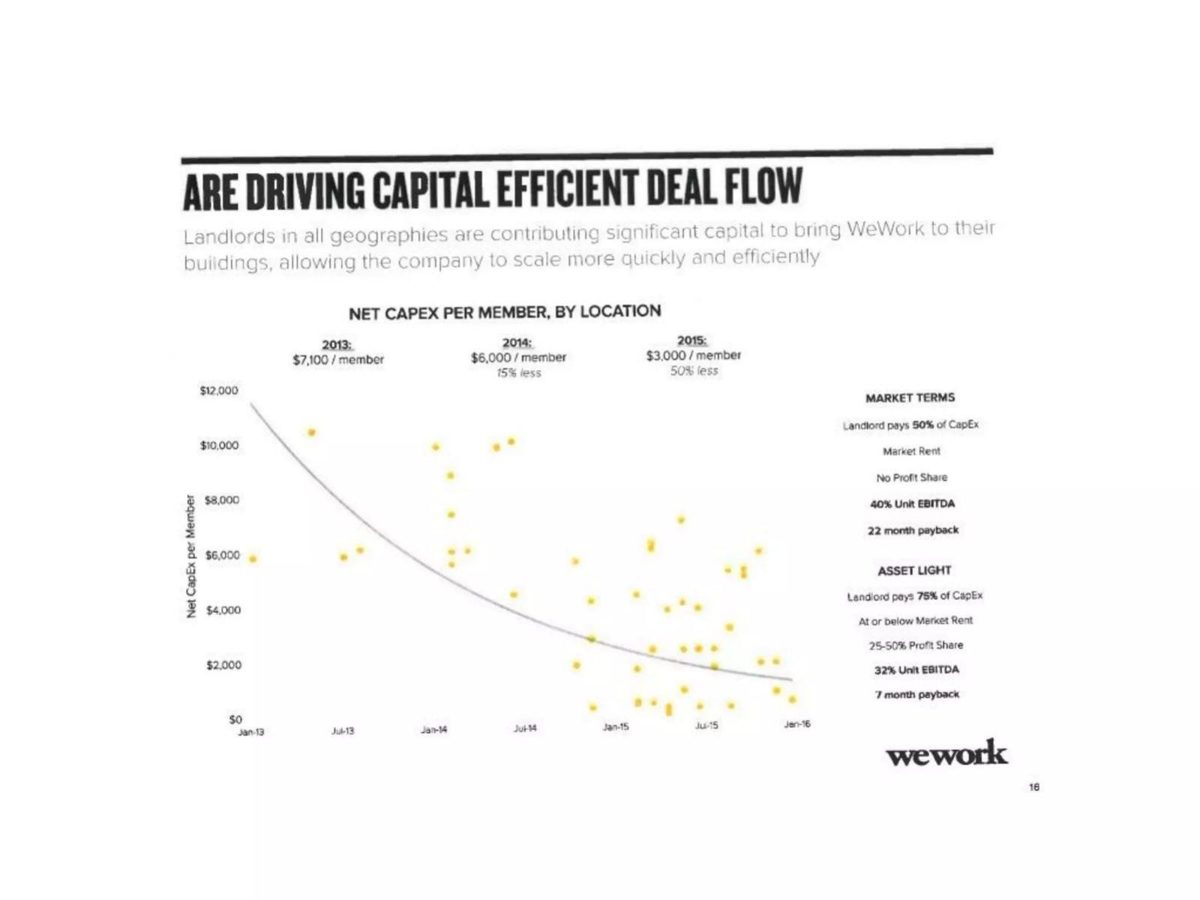
Shared offices. "Are driving capital efficient deal flow" slide in a 36-page deck, with net capex per member falling from $7,100 (2013) to $3,000 (2015).
WeWork deck, slide 18. Exact stored slide matched to this analysis.
Our analysis: Two deal structures side by side show the trade between margin and payback.
Evidence and limitation: A falling capex trend and a best-case deal type on one slide can read as the typical location; say how many are on each terms.
What a founder can adapt: Show the capex per unit and monthly EBITDA that produce each payback.
Supporting analysis
What the deck claims: Market terms: landlord pays 50% of capex, market rent, no profit share, "40% Unit EBITDA", "22 month payback". Asset light: landlord pays 75% of capex, at or below market rent, 25–50% profit share, "32% Unit EBITDA", "7 month payback".
Presentation choice: Two deal structures side by side show the trade between margin and payback.
When it does not fit: A falling capex trend and a best-case deal type on one slide can read as the typical location; say how many are on each terms.
Delivery-only restaurant brands. "Restaurants Business Model" slide in a 28-page deck.
Muncher deck, slide 19. Exact stored slide matched to this analysis.
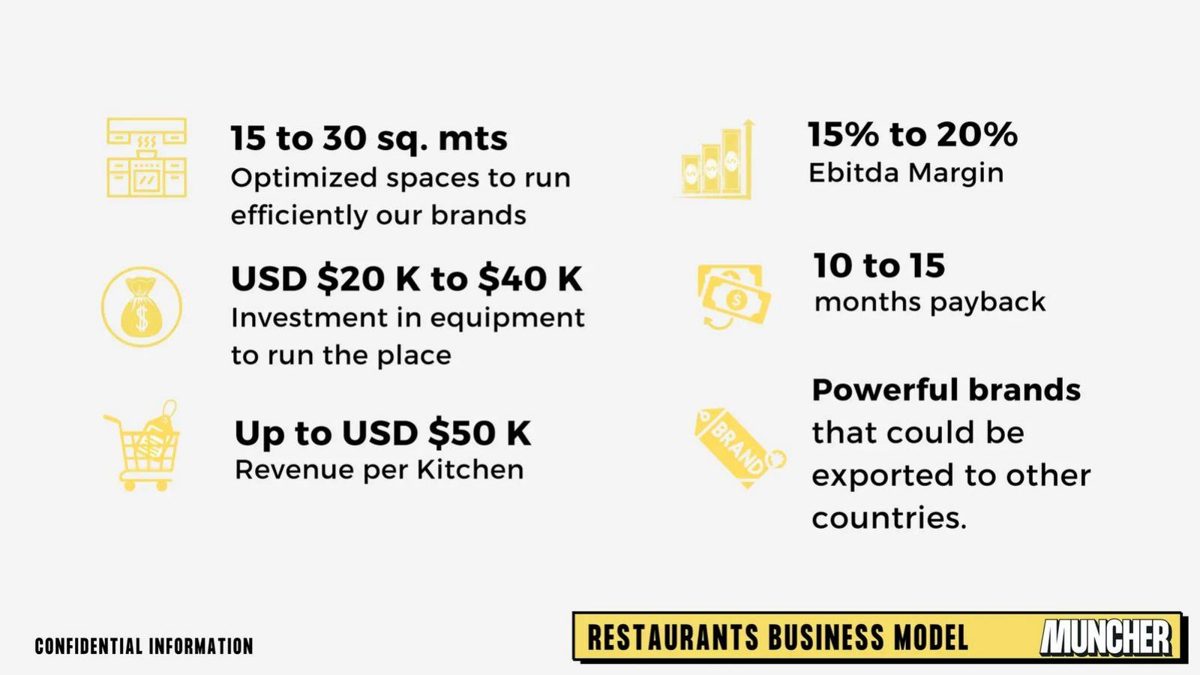
Our analysis: Investment, revenue and margin are all on the slide, so a reader can try the calculation.
Evidence and limitation: Neither monthly (under five months) nor annual (over four years) revenue gives 10 to 15 months (our calculation).
What a founder can adapt: State the revenue period so the payback reproduces.
Supporting analysis
What the deck claims: "15 to 30 sq. mts"; "USD $20 K to $40 K Investment in equipment"; "Up to USD $50 K Revenue per Kitchen"; "15% to 20% Ebitda Margin"; "10 to 15 months payback".
Presentation choice: Investment, revenue and margin are all on the slide, so a reader can try the calculation.
When it does not fit: Neither monthly (under five months) nor annual (over four years) revenue gives 10 to 15 months (our calculation).
Each cell reports only what the slide itself states. "Not stated" means the page gives no figure.
Example
Payback
Type
Inputs shown
Measured or target
Reproducible?
Evvnt
3 months
CAC
CAC, gross profit
Stated as current
Yes (our calc.)
Kredivo
~3–4 months
CAC
LTV, CAC, curve
January 2019 cohort
Ratio yes
Nas.com
<2 months
CAC
Cohort curves
Measured, by cohort
From chart
OneScreen (13)
90 days
CAC
Net ARPU, CAC
Target
Yes, by construction
OneScreen (14)
78 days
CAC
None
Stated as actual
No
Rippling
17 / 10 / 8 months
CAC, blended and subsets
Footnoted definitions
FY23
Definitions only
Scale AI
<2 days / 2 weeks
Supply acquisition
CAC
Not stated
No
Mixpanel
~6 months
Sales
Redacted
Current
No
Althea
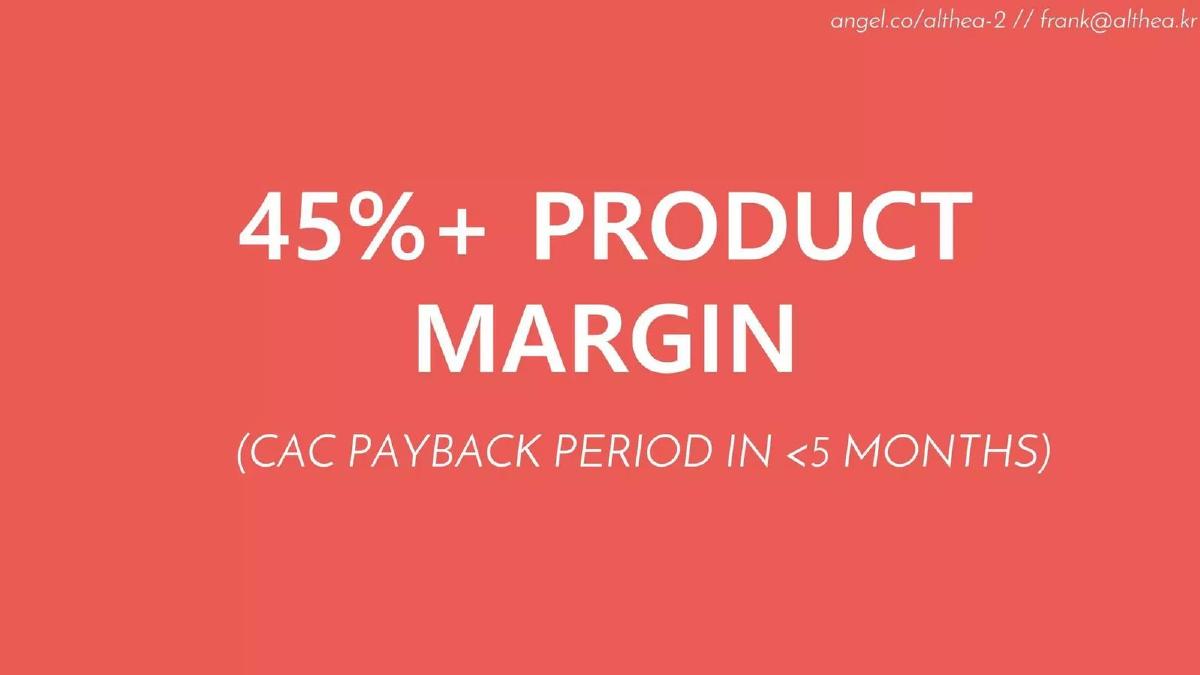
<5 months
CAC
Margin only
Not stated
No
Arya
<8 months
Not stated
None
Not stated
No
iConsumer
<60 days
CAC (cash)
CAC, year-1 cash
Current
Partly
Mero
3 months
Customer
None
Not stated
No
Viso
3 months
Customer
ROI
Not stated
No
WeWork
22 / 7 months
Location
Terms, unit EBITDA
Not stated
No capex per location
Muncher
10–15 months
Kitchen
Investment, revenue, margin
Not stated
No: revenue period missing
Key Takeaways
Say what is being paid back. Mero and Viso describe the customer's payback on the product; Evvnt and Kredivo describe the company's payback on acquisition spend.
Use gross profit, not revenue. Evvnt's 3-month CAC payback uses its $58.98 monthly gross profit, and the arithmetic reproduces (our calculation).
Show the inputs. iConsumer gives a cash CAC under $20 and first-year cash of over $50, but its lifetime value is written as "?".
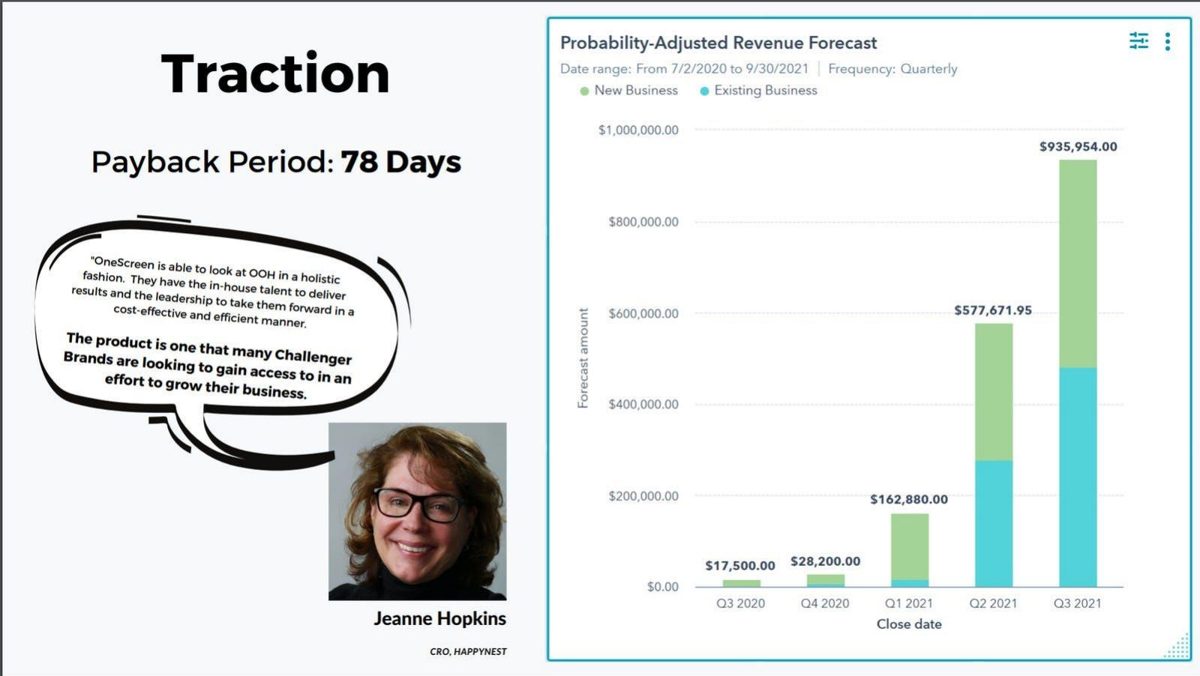
Label targets. OneScreen shows "Payback Period Target = 90 Days" on one slide and "Payback Period: 78 Days" on the next, keeping the two apart.
Show cohorts. Nas.com's chart shows its January cohort taking about ten months to reach 100% return, while later cohorts pass it in one or two months.
Define the blend. Rippling separates 17-month blended, 10-month cross-sell and 8-month marginal CAC payback, each with a footnote defining it.
Write your payback line
Fill in what you know. Leave a field blank rather than guess, and label any target as a target.
Type. CAC payback, customer payback or unit payback?
Cost. What is in CAC (or the unit investment)? Which channels and staff costs?
Return. Monthly gross profit per customer (or per unit), and the margin used.
Group. Which cohort or period is it measured on, and how many customers?
Blend. If you quote a subset, what is the blended figure?
What improved: Placeholder figures showing the format: type, inputs, cohort and channel split make the payback reproducible.
Three different paybacks
CAC payback is the one investors usually mean. It divides the cost of acquiring a customer by the gross profit that customer produces each month. A 12-month CAC payback means a company needs a year of a customer's gross profit before the acquisition spend is recovered; if customers leave sooner, the company loses money on them.
Customer payback is a sales argument: the buyer's savings or extra revenue cover the price of the product within a period. Mero's summary slide says it provides "payback to customers in just 3 months"; Viso claims "695% ROI in 3 years, 3 months payback". These are claims about the buyer's economics, not the startup's, and belong on the value-proposition or case-study slide with evidence from a named customer.
Unit payback applies to businesses that open physical units. WeWork's page 18 compares a "22 month payback" for a building on market terms with a "7 month payback" for an "asset light" deal where the landlord pays more of the build-out; Muncher states "10 to 15 months payback" on a kitchen. The unit is the location, and the cost being recovered is the investment in it.
All three are useful. The problem arises when a slide says "payback" without saying which, as Arya's page 11 does: "Payback under 8 months" sits between "80% of members are millennial moms" and "Over 80% 6-month retention", and a reader has to guess that it means CAC payback.
Revenue or gross profit
CAC payback calculated from revenue flatters the figure by the gross margin. A company with 50% margins and a CAC equal to three months of revenue has a six-month payback on gross profit, not three.
Evvnt's page 10 is the clearest example of doing it properly, and also shows how easy it is to mix the two. It lists "Cost per lead $4.78", "Conversion rate to sale 2.7%", "CAC $177", "Average value per customer $884.68 per annum", "Gross profit (80%) per customer $58.98 per month", "Average contract length 2 Years", "Customer lifetime value $1,769.36", "LTV:CAC ratio 10" and "CAC Payback 3 months".
Our calculations: $4.78 ÷ 2.7% is $177, matching the stated CAC. $884.68 ÷ 12 × 80% is $58.98, matching the monthly gross profit. $177 ÷ $58.98 is 3.0 months, matching the payback, which is calculated on gross profit. The lifetime value, however, is $884.68 × 2 years = $1,769.36, which is revenue, not gross profit; on gross profit it would be $58.98 × 24 = $1,415.52, and the LTV:CAC ratio about 8.0 rather than 10. The slide uses gross profit for one figure and revenue for the other without saying so.
Kredivo's page 31 separates the two explicitly: "Lifetime Revenue" of 263 less "Lifetime Costs" of 144 gives a "Lifetime Value" of 119, against a "CAC" of 10.5. 119 ÷ 10.5 is 11.3 (our calculation), which matches both the "~11x" callout and the curve's final point of 11.3 at month 72.
Measured on whom, and when
A payback period changes with the group of customers it is measured on. Customers acquired through referrals may pay back in weeks; customers from paid ads may take a year. An average hides that, and so does a figure from a single good month.
Kredivo footnotes its chart: "LTV / CAC and CAC payback are based on January 2019 customer cohort which is representative of a typical cohort", with CAC "Based on 2019 average CAC". The chart marks the payback period at about 3.5 months, consistent with the "~3-4 Months" headline. Naming the cohort lets a reader ask the obvious follow-up question: what did other cohorts look like?
Nas.com answers that question on the slide. Its page 21, titled "Our CAC payback has improved to <2 months", plots percentage return by month for monthly cohorts from January to September against a dashed line at 100%. By our reading of the chart, the January cohort reaches 100% at about month ten, the February cohort had not reached it by month seven, and the most recent cohorts start above 100% in their first month. The headline is true of the recent cohorts; the chart shows the reader it is a recent improvement, not the history.
Mixpanel's page 8 lists sales KPIs with most figures blacked out in the public copy, ending with "Sales payback rate is around 6 months; we will get this down in 2015". It gives no cohort or definition, but it is candid about the direction of travel.
Targets and actuals
OneScreen shows how to keep a target and an actual apart. Its page 13, headed "Targets", lists "90 Day Net ARPU = $10k", "CAC = $10k" and "Payback Period Target = 90 Days"; by construction, if a customer's first 90 days of net revenue equals the cost of acquiring them, the payback is 90 days. Its page 14, headed "Traction", reports "Payback Period: 78 Days" beside a quote from a customer and a probability-adjusted revenue forecast.
The pairing is honest about which figure is which. What the slides do not say is whether the 78 days uses the same net ARPU definition as the target, or on how many customers it was measured. The target also uses revenue ("Net ARPU") rather than gross profit; for a marketplace, net revenue may already be close to gross profit, but the slide does not say.
iConsumer's page 14 is headed "Profitable Member Acquisition" and states a cash CAC of less than $20, payback in less than 60 days ("Initial cash investment recouped" within that time) and first-year cash generated of more than $50. Its last line reads "CLV (Customer Lifetime Value): ? (Since June 2018)". Leaving the lifetime value as a question mark rather than inventing one is honest, and the slide gives a reason: the company has not had customers long enough to know.
Blended, cross-sell and marginal payback
Rippling's page 14, from a later-stage memo-style deck, is the most detailed treatment in this set. It cites benchmarks from Meritech Capital: "The average public SaaS company has a 28-month CAC payback period and a 10% operating margin as of March 2024", and plots CAC payback against operating margin for a list of public software companies, reporting an R-squared of 0.65.
It then gives three figures for itself: "Rippling currently has 17-month CAC paybacks", "Rippling's CAC payback period for cross-sell is just 10 months", and "if you only burden cross-sell CAC with our direct, marginal costs for cross-sell (and exclude its pro-rata share of underlying marketing costs), the CAC payback is only 8 months". Each figure has a footnote saying what costs are included and which period (FY23, Feb '23 to Jan '24) it covers, and the footnotes note that the internal figures are "under review and subject to change".
The lesson for earlier-stage decks is the structure, not the length. If you quote a better payback for a subset of customers or a narrower cost base, show the blended figure beside it and state what was excluded.
Payback on the supply side and on physical units
Scale AI's page 28, "Supply Acquisition", applies payback to recruiting the people who label data rather than to customers: labelers recruited "through digital ads, self-sign-ups" at "CAC: $1.50" with "Payback: <2 days", and QA staff "primarily recruited via referrals" at "CAC: $175" with "Payback: 2 weeks". The slide does not say what pays the cost back (presumably the margin on work those people complete), but it applies the concept consistently to both channels.
WeWork's page 18 compares two deal types. "Market terms": "Landlord pays 50% of CapEx", "Market Rent", "No Profit Share", "40% Unit EBITDA", "22 month payback". "Asset light": "Landlord pays 75% of CapEx", "At or below Market Rent", "25-50% Profit Share", "32% Unit EBITDA", "7 month payback". The comparison shows the trade: a lower margin but a much faster payback because WeWork puts in less of its own capital.
Muncher's page 19 gives "USD $20 K to $40 K Investment in equipment", "Up to USD $50 K Revenue per Kitchen", "15% to 20% Ebitda Margin" and "10 to 15 months payback". Our calculation shows why the revenue period matters: if $50K is monthly revenue, 17.5% EBITDA is about $8,750 a month and a $40K investment pays back in under five months; if it is annual, the same investment takes more than four years. Neither reading gives 10 to 15 months, and the slide does not say which period the revenue covers.
How to build your payback line
Write the formula on the slide: CAC ÷ monthly gross profit per customer = months. Give both inputs and say where they come from: which channels are in CAC (paid only, or all sales and marketing including salaries), and what margin was used. Name the group of customers it was measured on and the period.
If payback has improved, show it by cohort as Nas.com does, or give the old and new figures with dates. If you quote a subset (a cheap channel, cross-sell, a narrower cost base), give the blended figure beside it. Keep targets labelled as targets.
Keep customer payback and unit payback on the slides where they belong, and make them reproducible in the same way: price paid, savings or revenue per month, and whose figures they are. A customer payback claim is strongest when it comes from a named customer's own numbers.
Common mistakes
Unnamed payback. Say whether it is CAC, customer or unit payback.
Revenue instead of gross profit. CAC payback on revenue flatters the figure by the gross margin.
No inputs. Give CAC and monthly gross profit so the figure reproduces.
Best cohort only. Show cohorts or state which one the figure uses.
Subset without the blend. Quote the blended figure beside any channel or cross-sell payback.
Buyer payback as company economics. A customer's ROI is a sales claim, not your unit economics.
Diagnostic checklist
The type of payback is named.
CAC (or unit investment) and monthly gross profit are on the slide.
The cohort or period is stated.
Blended payback appears beside any subset.
Targets are labelled as targets.
The stated figure reproduces from the slide's own numbers.
Frequently asked questions
How do I calculate CAC payback for a pitch deck?
Divide the cost of acquiring a customer by the monthly gross profit that customer produces. Evvnt's $177 CAC and $58.98 monthly gross profit give 3.0 months, matching its stated 3 months (our calculation). Use gross profit, not revenue, and say which costs are in CAC.
What is a good CAC payback period?
It depends on how long customers stay and on the business. Rippling cites Meritech Capital's figure of 28 months for the average public SaaS company as of March 2024; the early-stage slides here state from under 2 months to 8 months. Show your own figure with its inputs and cohort rather than a benchmark.
Is customer payback the same as CAC payback?
No. Customer payback (Mero's "payback to customers in just 3 months") is how quickly the product pays for itself for the buyer. CAC payback is how quickly you recover what you spent to win that buyer. Put each on its own slide and name it.
Should I show payback by cohort?
Yes, if you have the data. Nas.com's cohort chart shows the improvement from about ten months for its January cohort to under two months for recent ones, which a single figure would hide.
How we chose these examples
Search (2026-09-30): the durable corpus index (docs/seo/artifacts/corpus-search, 70,729 unique pages, deduplicated by deck-file sha256 + page) was searched for payback periods stated in days, weeks or months (23 hits, some describing oil and gas wells). Existing guides were read first: the unit economics, per-order unit economics, SaaS traction, deal size and go-to-market guides mention payback only in passing, so this guide asks a question none of them answers: what a payback figure measures and how to make it reproducible.
Sixteen candidate pages were rendered from the original public deck files and read from the images; fifteen are used: Evvnt 10, Kredivo 31, Nas.com 21, OneScreen 13 and 14, Rippling 14, Scale AI 28, Mixpanel 8, Althea 5, Arya 11, iConsumer 14, Mero 13, Viso 6, WeWork 18 (the $355M deck) and Muncher 19. OneScreen appears twice because page 13 sets a target and page 14 reports an actual. Kredivo and Viso appear in other guides on different pages with different lessons. Fifteen images were stored from the original PDFs on 2026-09-30.
Left out: the other WeWork deck copy (source file unavailable), AGS 3, 18 and 19 (gaming-machine payback in a public-company presentation, overlapping WeWork's unit lesson), Jus Mundi 10 (figures redacted except the payback), and September 14 (oil and gas well payback).
All calculations are ours and labelled; chart readings are our readings of the slide images. How we built this: drafted and checked with AI assistance (editorial model review against the original slide images); no human editor has reviewed this guide.