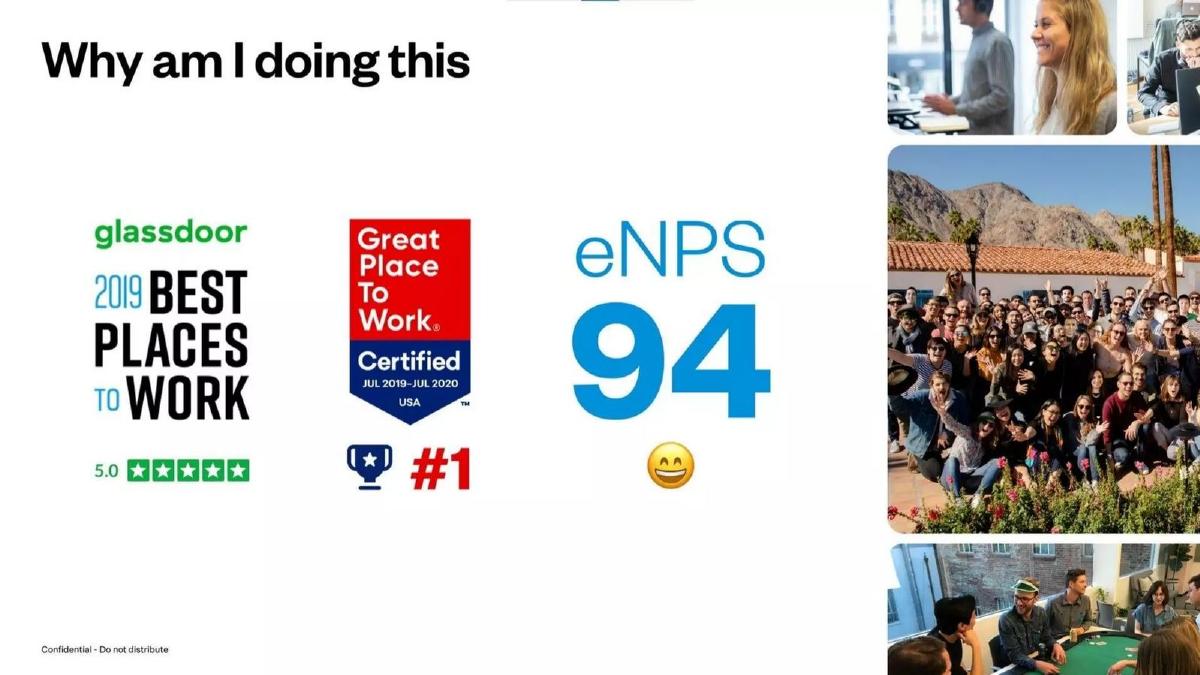
Front raised $59 million in its Series C round (part of a total $203.6 million raised to date) using a deck that prioritizes culture, efficiency, and high-retention growth. The deck stands out by beginning with 'Why am I doing this,' highlighting a 94 eNPS and Glassdoor awards to prove organizational health before diving into financials. The core of the pitch relies on impressive SaaS benchmarks: 137% net dollar retention and the fact that 54% of users joined in the year leading up to the pitch. By mapping out a $5.5B ARR potential across specific 'strong fit' verticals like Logistics and Sup…
Key takeaways
- The deck leads with culture, citing a 94 eNPS and a #1 ranking on Great Place to Work (Slide 3).
- Front reports a highly efficient growth model where 54% of current users joined in 2019 (Slide 7).
- Retention is a primary strength, with the company boasting 137% net dollar retention (Slide 7).
- The company identifies a $5.5B ARR potential by targeting specific 'strong fit' use cases like Supply Chain and Accounting (Slide 9).
- Product usage has shifted from 80% shared inbox in Q1 2017 to a more balanced mix of shared and individual usage by Q3 2019 (Slide 10).
- Technical depth is proven by the fact that 18% of customers directly leverage the company's API (Slide 12).
- The deck uses a quadrant map to show that their sweet spot is users who both rely on email and need complex workflows (Slide 6).
- Market sizing is broken down by vertical, with Supply Chain departments representing the largest opportunity at $1.2B (Slide 9).
The Strategy of the Series C Narrative
Front’s Series C pitch deck is a departure from the standard problem-solution format typically seen in seed or Series A rounds. By the time a company reaches Series C, the 'problem' is assumed to be validated by the market. The narrative here shifts toward organizational durability and market expansion . The deck, which helped secure a $59 million round, focuses on the efficiency of their growth and the depth of their customer relationships.
Introduction and Cultural Foundation
Slide 1 is a minimalist title slide featuring the company logo and the 'Work happier' tagline. This sets a tone of simplicity and focus that carries through the visual design of the entire deck.
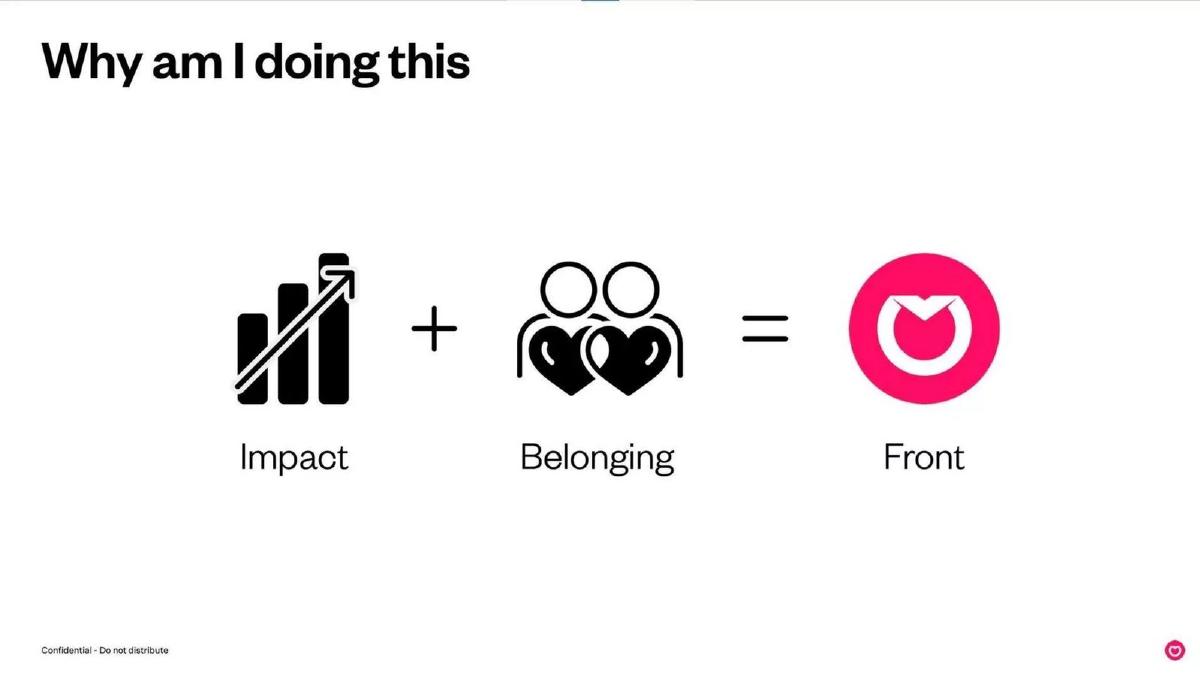
Slide 2 asks, 'Why am I doing this?' It uses a simple equation: Impact + Belonging = Front. This is a highly personal opening for a later-stage deck, likely designed to align the founder’s vision with the long-term interests of institutional investors.
Slide 3 provides the data to back up the 'Belonging' claim. It showcases a 94 eNPS (Employee Net Promoter Score), a 5.0 rating on Glassdoor, and a #1 ranking on the 'Great Place to Work' list for 2019-2020. For a Series C investor, these aren't just 'feel-good' metrics; they are indicators of low employee churn and high productivity, which are essential for scaling a company from hundreds to thousands of employees.
Defining the Bottleneck and the Solution
Slide 4 addresses the core problem: the traditional email model is a bottleneck for productivity. The slide uses a simple graphic showing four isolated users with 'X' marks between them, noting that '1 inbox only ever accessible to 1 user' leads to no visibility, duplicated work, and email overload. The '+1K' badge on the envelope icon visualizes the pain of the modern knowledge worker.
Slide 5 presents the solution: 'Front flips the email model upside down.' The graphic changes to show the same four users surrounding a single, shared pink inbox. The value propositions are clearly stated as Information access , Efficiency and speed , and Focus . This is a textbook example of using 'Before and After' visuals to explain a product's core utility.
Market Segmentation and Positioning
Slide 6 is one of the most strategic slides in the deck. It maps various job titles along two axes: 'Communication form' (Email vs. Any form) and 'Workflow needs' (Complex vs. None). By plotting roles like 'Insurance broker' and 'Recruiting' in the top-right quadrant, Front identifies its Ideal Customer Profile (ICP) . It admits that a 'Software Engineer' (bottom-left) might not need Front, which builds credibility with investors by showing the company knows where it doesn't fit.
Growth and Retention Metrics
Slide 7 is the 'money slide.' It displays three charts: ARR growth, Quarterly revenue cohorts, and User cohorts. The headline notes that growth from 2014-2018 was 'mostly organic.' The key figures are staggering: 5,500+ customers and 137% net dollar retention . The fact that 54% of current users joined in 2019 (as of the end of Q3) demonstrates an accelerating growth curve, which is exactly what Series C investors want to see.
Slide 8 reinforces the transition from organic to 'deliberate' growth. It lists specific buyer personas, such as 'VP Operations @ 3PL & 4PL' and 'Head of Client Services @ growing Accounting firm.' This slide tells investors that Front has moved beyond 'selling to anyone' and has developed a repeatable sales playbook for specific industries.
The $5.5B Opportunity
Slide 9 quantifies the market opportunity with high precision. Instead of citing a generic multi-billion dollar TAM, Front lists 10 specific verticals and their 'ARR potential.' Examples include Logistics ($360M) , Supply Chain departments ($1.2B) , and Accounting ($900M) . Totaling $5.5B, this bottom-up market sizing is much more persuasive than a top-down approach. The slide also includes an LTV/CAC chart and a note that cash spent to reach a certain ARR was equal to the ARR reached, signaling high capital efficiency.
Product Evolution and Customer Sentiment
Slide 10 shows the 'foundations of a great email product' through a stacked bar chart. It tracks the 'Share of users per type of usage' from Q1 17 to Q3 19. The data shows a healthy diversification: while 'Shared inbox' usage remains the core, 'Mixed usage' (both shared and individual) has grown significantly. This suggests that Front is becoming the primary email client for its users, not just a secondary tool for support tickets.
Slide 11 uses customer testimonials to prove the product's 'stickiness.' One quote describes Front as 'the intersection of all the information' and a place where 'everyone ends up residing to solve a given problem.' This supports the narrative that Front is becoming a 'platform' rather than just an 'app.'
Slide 12 provides the technical proof of platform status. It cites 52 integrations with 3rd parties , that 55% of customers use the platform (likely referring to the ecosystem beyond just email), and that 18% directly leverage the API . High API usage is a strong indicator of 'lock-in,' as it means customers have built their own custom workflows on top of Front.
Slide 13 is a simple 'Thank you' slide on a blue background, concluding the core narrative.
What Works in This Deck
Extreme Specificity: The breakdown of the $5.5B market by vertical (Slide 9) is far more convincing than a generic market slide. It shows the company has a deep understanding of its unit economics across different industries. · Retention as a Growth Engine: By highlighting 137% net dollar retention (Slide 7), Front proves that their existing customers are their best sales team. This reduces the pressure on new customer acquisition and makes the business model highly attractive. · Cultural Transparency: Leading with eNPS and Glassdoor data (Slide 3) is a bold move that addresses the 'human capital' risk of scaling, which is a major concern for later-stage VCs. · Visual Clarity: The deck uses a consistent color palette (pink, blue, white) and very little text. It relies on clear charts and simple iconography to tell the story, making it easy to digest in a partner meeting.
What Is Missing from This Deck
The Team Slide: While the culture is highlighted, the specific backgrounds of the executive leadership team are not included in these 13 slides. At Series C, investors want to see 'battle-tested' executives who have scaled companies before. · The Financial Ask: There is no slide detailing how much capital is being raised or how it will be allocated (e.g., % to R&D vs. % to Sales). · Competitive Landscape: While Slide 6 hints at positioning, there is no direct comparison to major incumbents like Zendesk, Salesforce, or traditional Outlook/Gmail. · Unit Economics Detail: While LTV/CAC is mentioned, the actual dollar values for CAC and the payback period are not explicitly stated on the slides.
What a Founder Should Copy
The 'Job Axis' Map: If you are building a horizontal tool, copy the quadrant map from Slide 6. It is the best way to show investors that you understand which segments of the market are your 'high-gravity' users and which are not. · Cohort-Based Growth Charts: The revenue cohort chart on Slide 7 is the gold standard for SaaS decks. It visually demonstrates that older customers are not churning and are actually spending more over time. · Vertical Market Sizing: Instead of saying 'The market is $10B,' list 5-10 specific industries you can win and explain why. This proves you have a 'Go-To-Market' strategy, not just a product. · API Usage as a Metric: If you have an API, track how many customers use it. Including this (Slide 12) proves that your product is a platform that other companies are building their businesses on, which significantly increases your valuation multiple.
Frequently asked questions
- What is the most impressive metric in the Front Series C deck?
- The most significant metric is the 137% net dollar retention shown on Slide 7. In the world of SaaS, any figure over 120% is considered world-class, as it indicates that the company is growing significantly just by expanding within its existing customer base, even before accounting for new sales. This metric proves high product stickiness and a successful 'land and expand' strategy.
- Why does Front start the deck with culture and eNPS?
- Slide 3 highlights a 94 eNPS and Glassdoor awards. For a Series C company, investors are looking for 'scale-up' potential. High employee satisfaction and a strong culture are leading indicators that the company can attract and retain the talent necessary to manage rapid growth without imploding, which is a common risk at this stage.
- How does Front define its target market in this deck?
- Instead of a vague 'Total Addressable Market,' Slide 9 identifies ten specific 'strong fit' verticals. They quantify the ARR potential for each, ranging from $200M for Boutique Hotels to $1.2B for Supply Chain departments. This level of specificity shows investors that the company has moved past general experimentation and knows exactly which sales levers to pull.
- What does the 'email and workflow' quadrant on Slide 6 represent?
- This slide serves as a sophisticated competitive positioning map. It places various job roles (like IT Manager vs. Marketing Manager) on axes of 'Email Reliance' and 'Workflow Complexity.' By doing this, Front identifies exactly where their product provides the most value: for roles that live in email but require complex, collaborative steps to finish a task.
- Does the deck include a team slide or a specific financial ask?
- Based on the 13 slides provided, this deck omits a traditional team slide and a specific 'Ask' slide detailing how the funds will be spent. While these may have been in the full 25-slide version, their absence in the core narrative suggests the pitch was heavily focused on the momentum of the business and the clarity of the market opportunity.