Cobre Del Mayo (CDM) presents a comprehensive case study in mining operational efficiency. Dated August 2014, the deck centers on the Piedras Verdes (PV) mine in Mexico. The narrative follows a clear arc: acquisition by Invecture in 2009, followed by a shift from contract to owner-operated mining and a transition to a crush-conveyor stacked heap leach system. These changes resulted in production growing from roughly 1,000 tons per month in early 2009 to 2,661 tons by June 2014. Financially, the company highlights a LTM 2Q14 EBITDA of $77.2M and a competitive C1 cash cost of $1.98/lb, placing…
Key takeaways
- Monthly production at the Piedras Verdes mine increased from 543 tons at acquisition in 2009 to 2,661 tons in June 2014 (Slide 7).
- The company successfully transitioned from contract mining to owner operation, including the purchase of the former contractor's equipment fleet (Slide 7).
- LTM 2Q14 sales reached $236.9M, with $207.2M coming from cathode production and $29.7M from copper contained in ore (Slide 10).
- EBITDA margins peaked at 44% in FY 2012 before settling at 33% for the LTM 2Q14 period (Slide 10).
- C1 cash costs were reduced from $3.63/lb in FY 2010 to $1.98/lb in the LTM 2Q14 period (Slide 13).
- The company's leverage stood at 2.38x Net Debt / LTM EBITDA as of 2Q14, with a total debt figure of $240.5M (Slide 10).
- The corporate structure is complex, involving multiple Mexican entities under Invecture Group and Lawrie Associates in the UK (Slide 28).
- Market analysis suggests that actual copper prices have historically outperformed broker consensus and long-term forecasts (Slide 19).
Introduction and Cover
Slide 1: Title Slide
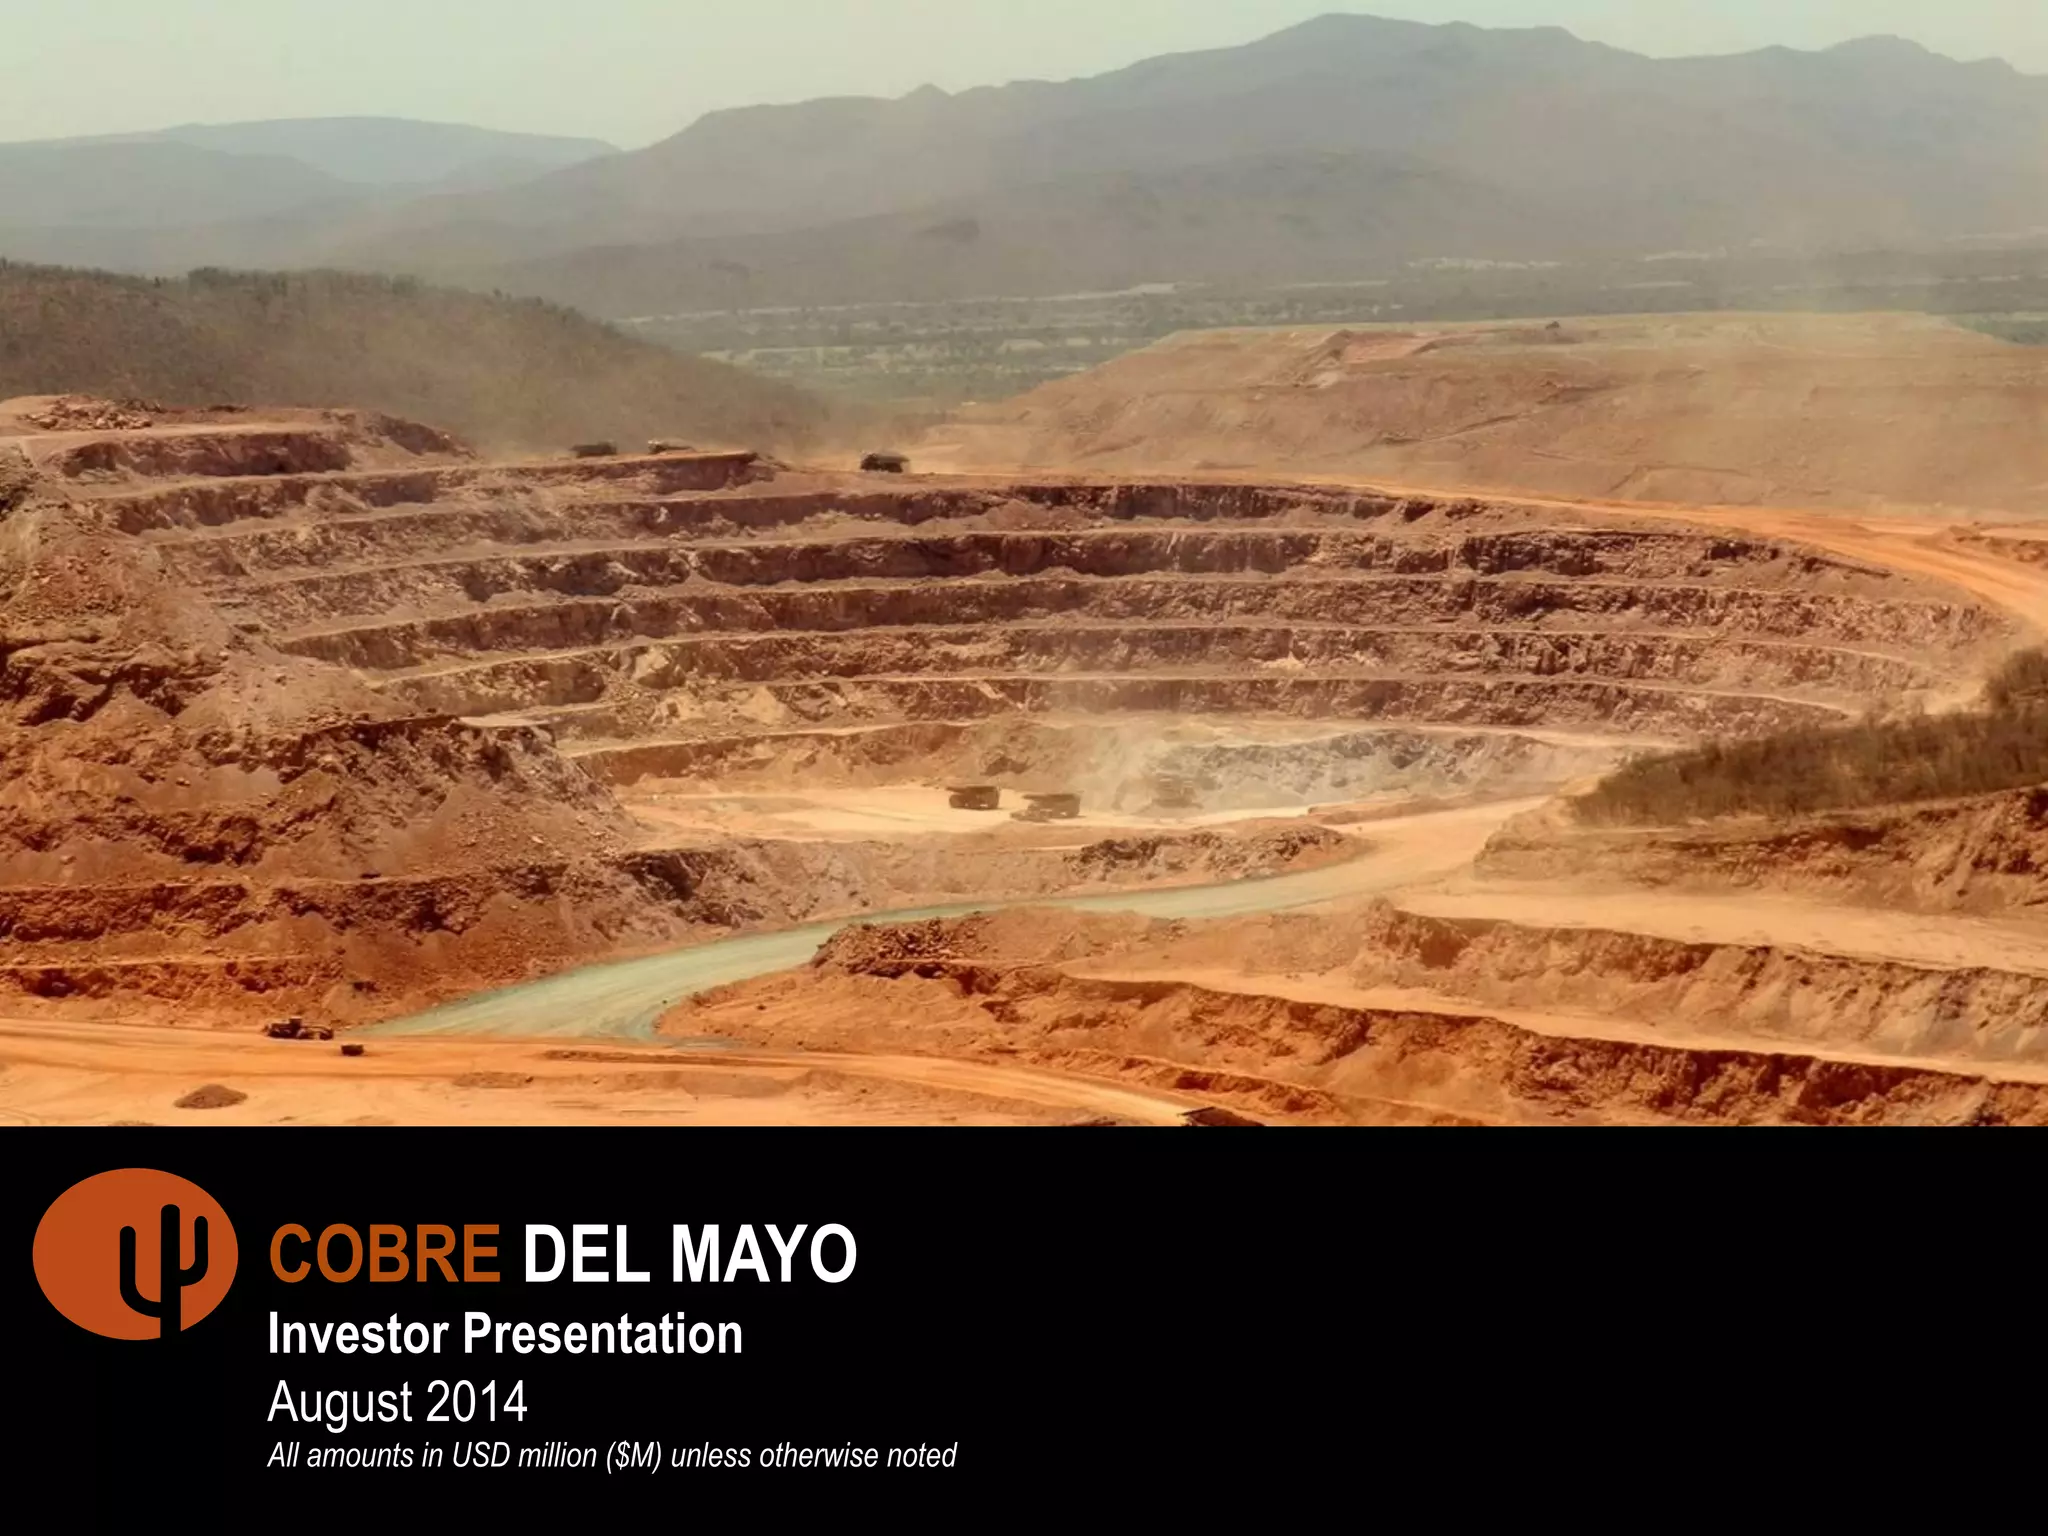
The presentation opens with a high-resolution aerial photograph of an open-pit mine, establishing the industrial scale of the operation. The title identifies the company as Cobre Del Mayo and specifies this is an "Investor Presentation" from August 2014 . A small note at the bottom clarifies that all amounts are in USD millions ($M) unless otherwise noted. The branding is professional, using a minimalist orange and black color scheme.
Section I: Company Overview
Slide 2: Section Divider
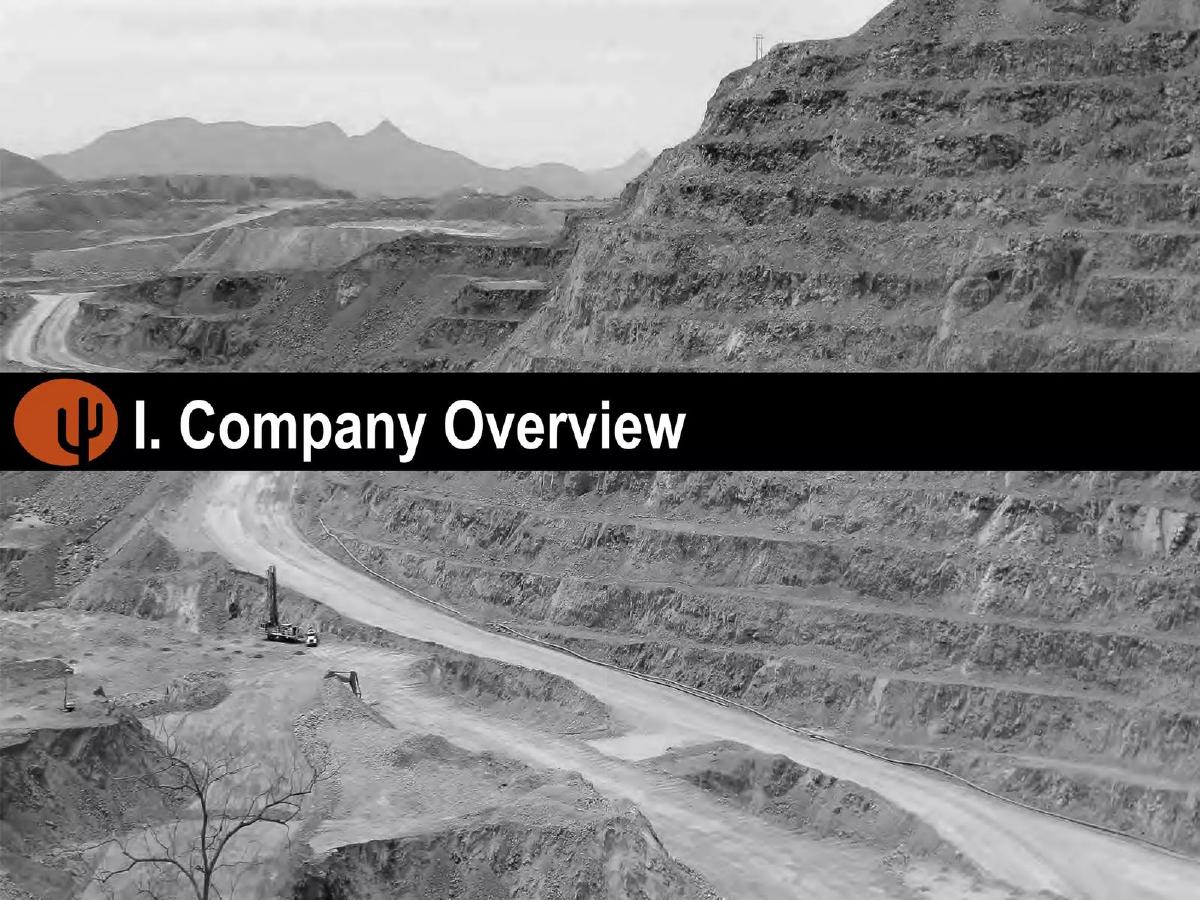
A black-and-white photograph of the mine benches serves as the background for the "I. Company Overview" section header. This transition slide maintains the industrial aesthetic of the deck.
Slide 7: Conversion of Piedras Verdes Mine to Stable Operation
This slide is a critical piece of the "turnaround" narrative. It lists six key initiatives implemented after the acquisition by Invecture. These include changing from contract mining to owner operation, purchasing the former contractor's equipment fleet, and re-engineering the crushing and conveying systems. The slide highlights a transition from truck dump Run of Mine (ROM) to a crush-conveyor stacked heap leach process. A bar chart titled "Monthly Production Evolution (t)" visualizes the results. Production started at 543 tons in June 2009 (at the time of acquisition) and shows a steady upward trend, reaching 2,661 tons by June 2014. A trend line emphasizes the consistent growth over this five-year period.
Slide 10: Cobre del Mayo Today
This slide provides a snapshot of the company's operational and financial health as of mid-2014. Key bullet points state that the PV Mine has been operating at an average of 82.5 tpd (tons per day) of copper cathode since January 2012. Financial highlights for LTM 2Q14 include sales of $236.9M and EBITDA of $77.2M . The slide also notes credit metrics: a leverage of 2.38x Net Debt / LTM EBITDA and a capitalization of 55.0% Debt / Total Capitalization. Two charts at the bottom show the historical progression of production/sales and EBITDA/margins. EBITDA margins are shown to have fluctuated, peaking at 44% in FY 2012 before dropping to 33% in the LTM 2Q14 period. Footnotes provide detail on the total debt of $240.5M and a weighted average interest rate of 10.35%.
Slide 13: Competitive and Stable Cash Cost
Cost efficiency is a major theme in mining, and this slide addresses it directly. The top bar chart shows the "Historical C1 Cash Cost," which has dropped from $3.63/lb in FY 2010 to $1.98/lb in the LTM 2Q14 period. The bottom chart is a "Global Copper C1 Cash Cost Curve" for 4Q 2013, sourced from Wood Mackenzie. It places Cobre Del Mayo's $1.98/lb cost in the third quartile of global production. The chart also plots the "C1 Cash Cost + Sustaining Capex" at $2.23/lb. This positioning suggests that while the company is not a lowest-cost leader, it remains competitive within the broader market landscape.
Section II: Operational Environment
Slide 14: Section Divider
The second section, "II. Operational Environment," is introduced with another full-bleed image of the mining site, featuring heavy machinery (haul trucks) at work on the pit floor.
Slide 19: Copper Price Forecasts Over Time
This slide argues that the market has consistently underestimated copper prices. It features a complex line and scatter plot comparing "Actual Copper Price" to "Broker Consensus" and "Long Term Price" forecasts from 2000 to 2020. The "Actual" line (blue) frequently sits above the forecasted data points (orange squares). The slide notes that delays in new projects and declining production from existing mines are the main drivers of supply shortfalls. As of August 13, 2014, the forecast for 2014 was $2.98/lb . This slide serves to justify the company's valuation by suggesting that future market prices may exceed conservative analyst estimates.
Section IV: Historical Financial Performance
Slide 20: Section Divider
The deck skips to section "IV. Historical Financial Performance." The background image shows a wide-angle view of the leach pads and surrounding mountainous terrain.
Section V: Conclusion
Slide 25: Section Divider
The final section, "V. Conclusion," is introduced with images of a large ore stockpile and conveyor belts emerging from tunnels, emphasizing the infrastructure investment discussed earlier in the deck.
Annex and Corporate Structure
Slide 28: Annex 1: Corporate Structure
The final slide in the provided set is a detailed organizational chart. It shows Invecture Group, S.A. de C.V. (Mexico) at the top, owning 100% of Frontera Copper Corporation, which in turn owns 100% of Frontera Cobre del Mayo. Below this, the structure splits: the operating entity, Cobre del Mayo, S.A. de C.V. (Issuer) , is 71.2% owned by the Invecture chain and 28.8% owned by Lawrie Associates (United Kingdom) . The chart also identifies various service and mining subsidiaries (e.g., Mayoson, S.A. de C.V.) and notes the presence of $11.7 million in preferred shares. A gray box indicates which entities represent the guarantors of the notes being offered.
What Cobre Del Mayo Does Well
The deck excels at demonstrating operational execution . By showing the step-by-step transition from a struggling contract-mined site to a stable, owner-operated facility, the founders build significant credibility. The use of a five-year production chart (Slide 7) is particularly effective because it doesn't just show a "hockey stick" projection; it shows a realized, historical trend of growth. The financial transparency regarding debt, interest rates, and cash costs (Slides 10 and 13) is also a strength, providing the granular data that institutional mining investors require.
What is Missing from the Deck
While the deck is strong on operations and history, several key elements are missing from the provided slides. There is no team slide detailing the management's specific mining experience or track record. There is also no explicit "Ask" slide in this selection; while it is clearly an investor presentation for a note offering, the specific terms, use of proceeds, and timeline for repayment are not detailed here. Furthermore, there is a lack of geological data —investors usually want to see reserve and resource estimates (Proven & Probable), mine life projections, and exploration upside, which are not present in these ten slides.
What Other Founders Should Copy
Founders in capital-intensive industries should emulate the benchmarking seen on Slide 13. By placing their own costs on a global industry curve, Cobre Del Mayo provides immediate context for their performance. Instead of claiming to be "low cost," they show exactly where they sit relative to every other producer in the world. Additionally, the "Before and After" narrative on Slide 7 is a powerful way to frame a turnaround. Listing specific technical changes (e.g., "Conversion from truck dump... to crush-conveyor") and showing the resulting production increase is much more persuasive than general statements about "improving efficiency."
Frequently asked questions
- What was the primary driver of Cobre Del Mayo's production increase?
- According to slide 7, the increase was driven by a shift to owner-operated mining and significant infrastructure upgrades. This included installing a new crushing, screening, conveying, and stacking system, and converting the process from truck dump Run of Mine (ROM) to a primarily crush-conveyor stacked heap leach system.
- How does Cobre Del Mayo compare to other global copper producers in terms of cost?
- Slide 13 places Cobre Del Mayo in the third quartile of the global copper C1 cash cost curve. With a C1 cash cost of $1.98/lb, it sits below the $2.33/lb threshold for that quartile, though it is significantly higher than the first-quartile leaders who operate below $1.36/lb.
- What is the company's current debt situation as of the deck's date?
- Slide 10 notes a total debt of $240.5M with a weighted average interest rate of 10.35%. The company reports $21.2M in cash and equivalents, resulting in a leverage ratio of 2.38x Net Debt / LTM EBITDA.
- Who owns Cobre Del Mayo?
- Slide 28 shows a tiered ownership structure. Invecture Group, S.A. de C.V. (Mexico) owns 100% of Frontera Copper Corporation, which in turn owns 100% of Frontera Cobre del Mayo. Lawrie Associates (UK) holds a 28.8% stake in the lower-tier operating entities, while the Invecture-controlled entities hold 71.2%.
- What specific copper products does the company sell?
- Slide 10 breaks down sales into two categories: copper cathode and copper contained in ore. For the LTM 2Q14 period, cathode production was 28,834 tons (generating $207.2M) and copper in ore was 16,066 tons (generating $29.7M).