Almanac’s 2019 pitch deck is a masterclass in the 'GitHub for X' narrative. The 22-slide presentation successfully frames the chaos of modern knowledge work—currently scattered across Google Docs, Notion, and Slack—as a structural efficiency problem that can be solved with engineering-inspired workflows. The company’s most distinct strategic move is the 'Almanac Core,' a library of 500+ expert-sourced templates that allows users to 'fork' best practices into their own private workspaces. While the deck contains several redacted or placeholder data points regarding customer conversion and spec…
Key takeaways
- Almanac positions itself as 'GitHub for knowledge professionals,' utilizing engineering workflows like branching and merging for text-based documentation.
- The core strategy relies on a 'Public Core' of 500+ expert-sourced guides to overcome the 'empty page' problem of most corporate wikis.
- The business model is a bottoms-up SaaS play with tiers ranging from $5 to $10 per user per month.
- Growth projections were aggressive, aiming for 30%+ month-over-month growth to reach 60k paying seats within two years.
- The deck highlights a massive market opportunity, citing 91 million US knowledge workers and a $101bn internal knowledge tool market.
- Key product differentiators include 'Doc Lineage,' 'Engagement Scores,' and 'Merge Requests' for non-technical documentation.
What this deck actually is
The Almanac October 2019 pitch deck is a Seed-stage presentation designed to position a documentation and knowledge management tool not just as a SaaS utility, but as "GitHub for knowledge professionals." The most important finding in this deck is its reliance on a bottoms-up growth loop that leverages a public "Core" of expert content to drive private enterprise adoption—a strategic attempt to solve the "cold start" problem inherent in most internal wikis.
Quantitatively, the deck is aggressive, projecting a 30%+ month-over-month growth rate to reach approximately 60,000 paying seats within two years. It focuses heavily on the shift toward digital-heavy roles, citing that 70% of the US workforce is now knowledge-oriented. However, the deck is notable for what it obscures: slide 9 (Selected Customers) and slide 15 (Paying Trial Conversion) contain large light-gray placeholders or redacted sections, suggesting either a template version of the deck or information intended only for high-trust discussions.
Slide-by-slide walkthrough
Slide 1: Title Slide
The title slide is minimalist, featuring a dark green background, a white circular coral-like logo, and the date "OCTOBER 2019." There is no tagline, no company name in text, and no explicit mention of the industry. It functions as a clean, brand-forward entry point.
An investor reads this as a signal of design-led thinking. By omitting a mission statement or "The Uber for X" tagline, the company relies on the upcoming narrative to build intrigue. The choice of a "coral" or "brain-like" logo suggests organic growth, connectivity, or structured complexity, which aligns with the "Almanac" name—a reference to a foundational reference work.
The strongest version of this slide would include a one-sentence value proposition. While minimalism is trendy, adding "The infrastructure for digital business knowledge" would provide immediate context before the presenter speaks a single word.
Slide 2: Market Context & The Digital Shift
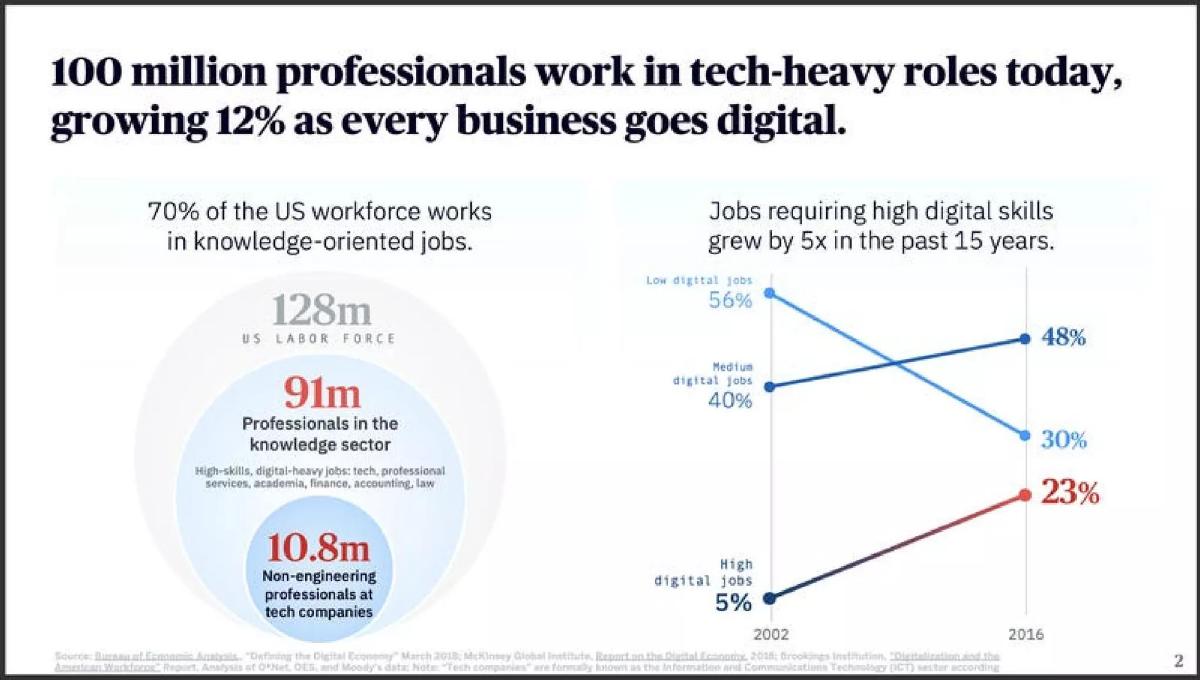
This slide establishes the "Why Now" by quantifying the explosion of digital-heavy roles. It cites a 12% growth rate in tech-heavy roles and notes that 70% of the US workforce (91 million people) is in the knowledge sector. Most importantly, it highlights a shift in digital intensity: jobs requiring "High digital skills" grew from 5% in 2002 to 23% in 2016. It uses data from the Bureau of Economic Analysis and McKinsey to ground these claims.
Investors see a massive Total Addressable Market (TAM). By breaking down the 91 million professionals into sub-categories like finance, law, and tech, Almanac is arguing that their software isn't just for software engineers—it's for the much larger "non-engineering professional" cohort (cited at 10.8 million within tech companies alone). The 5x growth in high-digital skill jobs suggests a permanent structural shift in the labor market that current tools may not be serving.
The strongest version of this slide would more clearly link these "high digital skill" jobs to the specific pain point Almanac solves. While the data is impressive, it describes a general economic trend rather than a specific deficiency in current software, which the deck addresses later.
Slide 3: Professional Digital Workflows
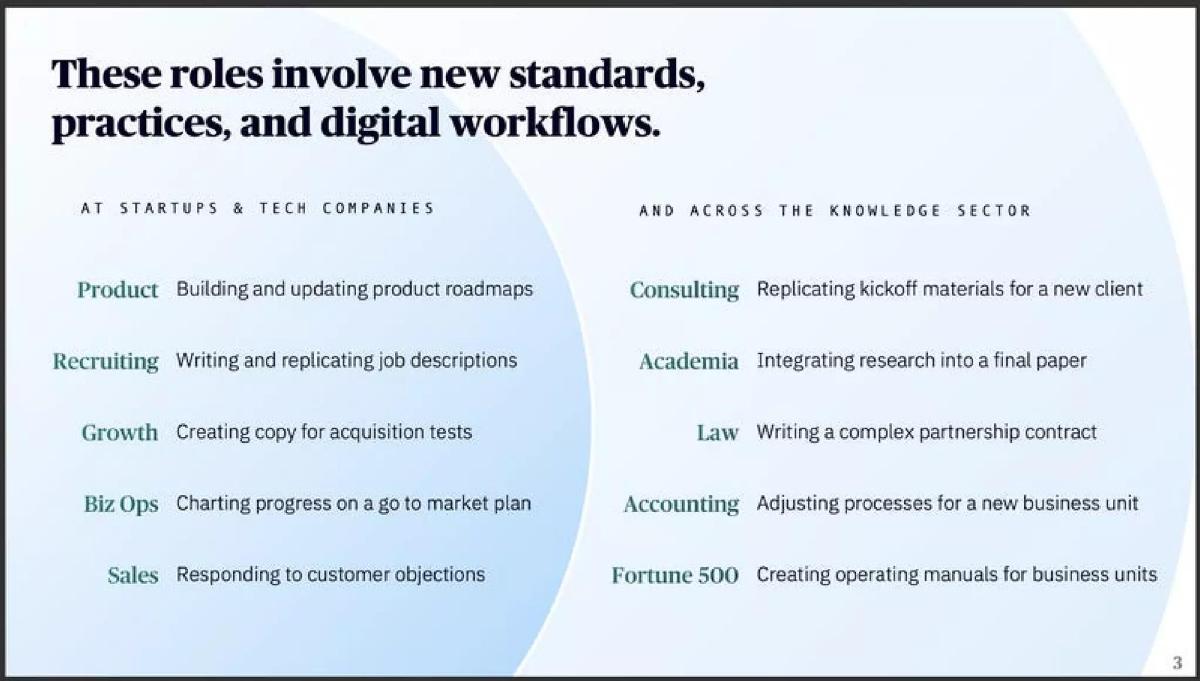
Slide 3 transitions from macro trends to specific tasks. It divides the "Knowledge Sector" into two categories: Startups/Tech Companies and the broader Knowledge Sector (Consulting, Law, Accounting). It lists specific repetitive tasks like "Writing and replicating job descriptions," "Creating copy for acquisition tests," and "Replicating kickoff materials."
This slide is designed to provoke "nodding" from an investor. By listing mundane but critical tasks—like "Adjusting processes for a new business unit"—Almanac is identifying the "unit of work" that their platform intends to capture. It frames professional work as a series of templates and repeatable processes that are currently handled inefficiently.
The strongest version of this slide would emphasize the repetition of these tasks across different companies. The deck hints at this with "replicating" and "writing and replicating," but it could be more explicit that these 100 million professionals are all independently reinventing the same wheels.
Slide 4: The Developer Parallel
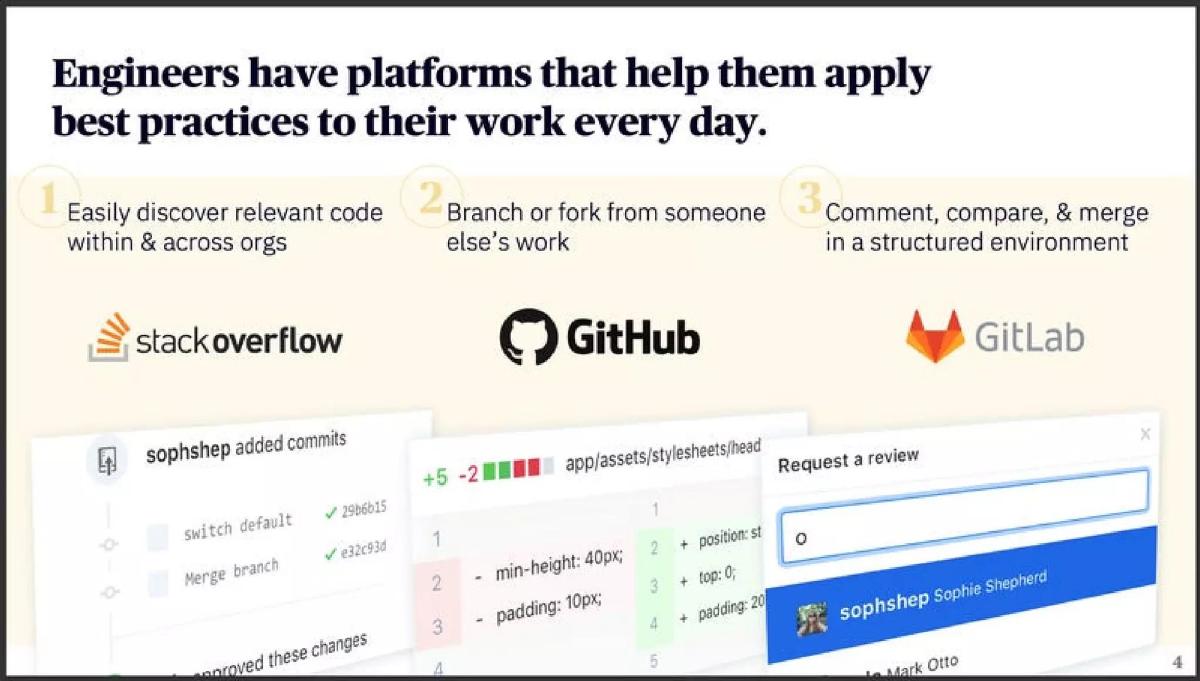
Almanac introduces the "GitHub for X" analogy here. It highlights how engineers use Stack Overflow, GitHub, and GitLab to discover code, branch/fork work, and collaborate in structured environments. It includes a screenshot of a GitHub diff view, showing "+5 -2" line changes and a merge request from "sophshep."
Investors love "GitHub for [Business Category]" because GitHub solved the problem of version control and collaborative creation for the most expensive employees in a company (engineers). The slide argues that the workflow of engineering—discovery, branching, and merging—is the superior way to work, but is currently locked away in dev-only tools.
The strongest version of this slide would explain why this hasn't happened for non-engineers yet. Is it a UI/UX problem? A cultural problem? A technical limitation? Identifying the barrier Almanac has broken would make the analogy more than just a surface-level comparison.
Slide 5: The Current Tool Gap
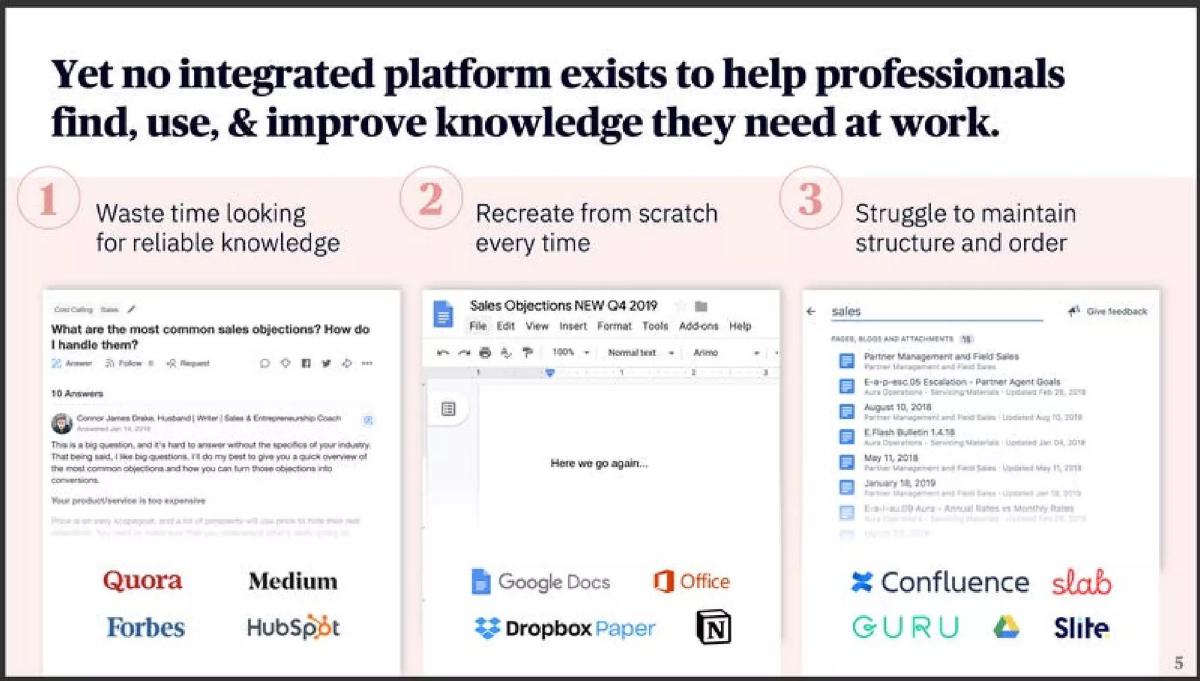
This slide identifies the competitors and their failures. It groups current tools into three buckets: Discovery (Quora, Medium, HubSpot), Creation (Google Docs, Office, Notion), and Structure (Confluence, GURU, Slite). The headline claims "no integrated platform exists to help professionals find, use, & improve knowledge."
The investor reads this as a "fragmentation" argument. Almanac is positioning itself as the vertical integration of these three disparate workflows. By showing blurred screenshots and logos of successful companies like Notion and Confluence, Almanac acknowledges the competition while asserting that none of them provide a seamless "find-to-edit-to-organize" loop.
The strongest version of this slide would be more specific about why these tools fail. For example, why is Notion not "structured" enough? Why is GURU not good for "creating"? Adding a specific deficiency for each category would strengthen the "10x better" claim later in the deck.
Slide 6: The Economic Cost of Inefficiency
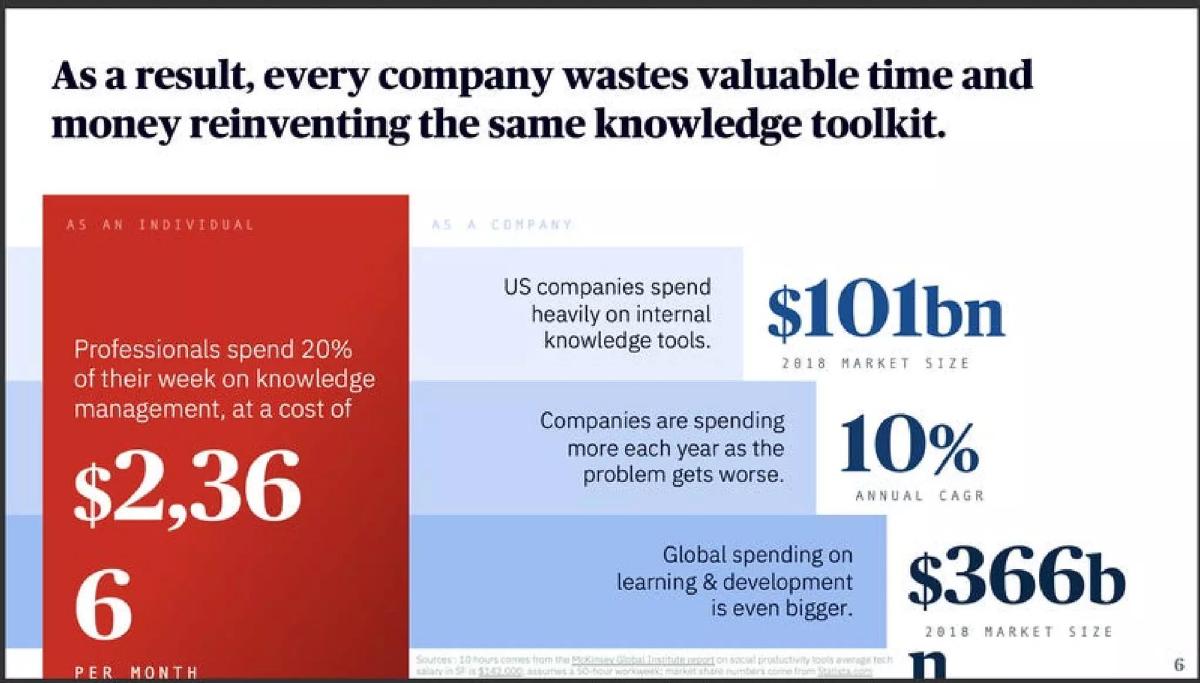
Almanac puts a dollar value on the problem. It claims professionals spend 20% of their week on knowledge management, costing $2,366 per month (based on a $142k SF salary). It also cites a $101bn market for internal knowledge tools and a $366b market for learning & development. The CAGR is listed at 10%.
This is the "pain" slide. The figure "$2,366 per month" per employee is a striking number designed to make the $5–$10 per month subscription fee (shown later) look like an obvious ROI. However, the math relies on an "average tech salary in SF," which may not apply to the broader "91m Professionals" mentioned on slide 2.
The strongest version of this slide would use a more conservative, national average salary to make the cost-saving argument more universal. Using SF tech salaries can make the solution feel like a niche "Bay Area" tool rather than a global professional standard.
Slide 7: The Solution (Value Proposition)
This is the "big reveal" slide. It explicitly states: "Almanac is GitHub for knowledge professionals." It lists three core pillars: Searchable knowledge, Branching for customization, and Structured collaboration. The background is a solid, confident blue.
After six slides of buildup, the investor finally gets the product definition. The phrase "bottoms-up technology" is key here—it signals a Go-To-Market (GTM) strategy that doesn't rely on expensive top-down enterprise sales, which is a highly desirable trait in SaaS startups.
The strongest version of this slide would include a very high-level product shot or a conceptual diagram of how these three pillars interact. A text-only slide is a missed opportunity to show the "magic" of the interface.
Slide 8: The Leadership Team
The team slide features four co-founders and two heads of department. It lists impressive pedigrees: Varo Money, Apple, Lyft, Harvard Business School, and several CTO roles at acquired companies. Each member has a distinct role, from Engineering to "Knowledge Operations" and "Contributors."
Investors see a well-rounded, "veteran" team. The inclusion of a "Head of Contributors" and "Head of Knowledge Operations" is unusual for a standard SaaS startup but essential for Almanac’s specific model of curated expert content. This shows the team is building the specific infrastructure needed for their unique "Core" strategy.
The strongest version of this slide would highlight the team's specific experience working together or their specific expertise in "knowledge management." While the logos are great, the "why this team" for this problem could be more explicit.
Slide 9: Traction & Customers
The slide claims Almanac has 50 customers in under six months. However, the center of the slide is a large light gray empty rectangle where "Selected Customers" should be. It notes these include "first month trials."
This is a major red flag in a pitch deck. An empty placeholder suggests either the deck was scrubbed for public distribution or the company was hesitant to name its early adopters. For an investor, 50 customers in 6 months is decent for a Seed round, but without knowing who they are (startups vs. Fortune 500), it's hard to judge product-market fit.
The strongest version of this slide must contain the logos. If the logos are under NDA, the slide should list the types of companies (e.g., "A Series B Fintech Startup," "A Global Consulting Firm") and provide aggregate metrics like "User Engagement" or "Active Repositories."
Slide 10: The Almanac Core (Content Strategy)
This slide details the "Core" product: 500 expert-driven guides across 15 verticals. A graph shows "Production growth" of 100% MoM, reaching 500 articles by September. It mentions these are sourced from 300 expert operators at "renowned companies" at a "$0 Average cost per article."
This is Almanac's "secret sauce." By building a library of expert content for free (likely in exchange for professional recognition/branding for the contributors), they solve the "empty page" problem of most wikis. The "$0 cost per article" is a highly scalable metric that suggests they can build a massive "public library" of knowledge without burning venture capital on content creation.
The strongest version of this slide would name some of the "renowned companies" where these experts come from. If the guides are written by people from Google, Netflix, and Stripe, that adds significant "social proof" to the content's quality.
Slide 11: Product Demo - Composition & Copying
This slide shows the UI. It demonstrates how a user can find a "How to Build the Perfect Hiring Process" guide in the public Core and "Make a Copy" into their own private workspace. The interface includes document metadata (people, tags, attachments) and a "best-in-class" editor with blocks for charts, checklists, and code.
Investors see the "GitHub for Docs" analogy in action here. The "Make a Copy" button is essentially a "Fork" command. The UI looks clean and modern, blending the aesthetics of Notion with more structured metadata. This slide proves the product is more than a concept; it is a functional platform with a distinct workflow.
The strongest version of this slide would highlight the "Branching" or "Linking" aspect more clearly. The text mentions "copy and link docs," but the visual focus is mostly on the document editor. Showing the connection between the public version and the private version would be more powerful.
Slide 12: Organization & Trust Features
This slide focuses on the "Structure and Order" value proposition. It lists features like Engagement Scores, Doc Change Logs (diff view), Doc Lineage, and Merge Requests. A screenshot shows a granular sharing menu similar to Google Docs but with "Anyone at Nike" permissions.
These features are designed to appeal to the "Enterprise" buyer. "Doc Lineage" and "Merge Requests" are the specific engineering-inspired features that differentiate Almanac from a standard wiki. They suggest a level of governance and version control that prevents the "knowledge spaghetti" mentioned on slide 7.
The strongest version of this slide would show the "Diff View" or "Merge Request" interface in detail. Those are the most unique technical features Almanac offers; showing a standard "sharing menu" is less impressive as every SaaS tool has one.
Slide 13: The 10x Productivity Gain
Almanac presents a time-savings comparison. The "Status Quo" workflow takes 56 minutes (searching, asking colleagues, Googling, reformatting). The "Almanac" workflow takes 6 minutes (searching docs within/beyond team, copying). The claim is a "10x faster" experience.
This is a classic "Productivity ROI" slide. While the "Status Quo" times (e.g., 10 mins asking colleagues, 12 mins filtering what's good) are subjective, they reflect the common frustrations of knowledge workers. The jump from 56 minutes to 6 minutes is a bold claim that supports a high willingness-to-pay from managers.
The strongest version of this slide would back these numbers with user data rather than estimates. Even saying "In a study of 50 trial users..." would make the 10x claim feel less like a marketing projection and more like a measured reality.
Slide 14: The Growth Loops
A circular diagram illustrates three loops: Contributors, Public Core, and Private Repos. Experts contribute for recognition -> users find content via SEO/referrals -> users pay to copy/collaborate in private repos -> companies publish nonproprietary materials back to the core.
This is a sophisticated growth model. Investors value "flywheels" where each new user or piece of content makes the platform more valuable for everyone else. The idea that companies would "publish back" to the core is particularly interesting, as it creates a virtuous cycle of content and brand awareness.
The strongest version of this slide would quantify the strength of these loops. For example, "Every 1 piece of Core content leads to X new registered users." Without conversion metrics, the loops are just theoretical diagrams.
Slide 15: Early Growth Metrics
The deck provides four metrics: 30% repeat contributors, 20% contributor referrals, 10 average customer demos per week, and two redacted/placeholder boxes for "demo customers starting paying trial" and "average licenses per paying customer."
The 30% repeat contributor rate is a strong signal of "Contributor-Market Fit." It means the platform is providing enough value (recognition or ease of use) that experts come back. However, the redacted boxes for conversion rate and seat count are frustrating for an analyst. These are the "bottom line" metrics that determine if the business model works.
The strongest version of this slide must include the missing numbers. A "paying trial" conversion rate is one of the most important metrics for a bottoms-up SaaS company. Leaving it as a light gray box suggests either the number is poor or the deck is incomplete.
Slide 16: Competitive Landscape Matrix
The matrix plots "Tops down vs. Bottoms up" on the Y-axis and "General Productivity vs. Knowledge Management" on the X-axis. Almanac is placed in the top-right quadrant (Bottoms up + Knowledge Management), solo, with GitHub just below it and Stack Overflow/Wikipedia nearby.
This is a standard "we are unique" slide. By positioning Confluence and GURU as "Tops down," Almanac is betting that modern teams want to discover and adopt tools individually rather than having them mandated by IT. Placing themselves near GitHub and Wikipedia reinforces the "Open Source Knowledge" branding.
The strongest version of this slide would explain why Confluence is "Tops down." Is it the pricing? The implementation time? The UI? Providing a reason for the positioning makes the matrix more credible.
Slide 17: Pricing & Tiers
Almanac outlines three tiers: Startup ($5/user), Pro ($10/user or $8 billed annually), and Enterprise (scaled pricing from $7.50 down to $5.00 based on seat count). The Enterprise tier includes SSO, analytics, and dedicated support.
The pricing is aggressive and competitive with tools like Slack or Notion. The detailed Enterprise license table (showing discounts from 7% to 38%) suggests the team has already thought through their enterprise sales strategy. The "100 document limit" on the Startup tier is a classic "expansion trigger" to force users into the Pro tier.
The strongest version of this slide would include a "Free" tier. Since the growth loop on slide 14 relies on free users finding the Core via SEO, a free "Individual" or "Reader" tier is likely missing from this specific pricing summary but necessary for the flywheel to spin.
Slide 18: Growth Projections
Two bar charts show projections from Oct 2019 to Sept 2021. The first shows Registered Users; the second shows Paying Seats, broken down by "Platform," "Direct Sales," and "Inside Sales." The goal is ~60k paying seats in 24 months.
These are "up and to the right" charts typical of a pitch deck. The projection of 60,000 seats in two years is ambitious for a company that currently has "50 customers (incl. trials)." The note that "Paying Customers includes customers in their free (30 day) trials" is an important caveat that slightly inflates the perceived revenue-generating base.
The strongest version of this slide would include a "Revenue" Y-axis alongside the "Seats" Y-axis. It would also be helpful to see the historical data from the previous 6 months to see if the projected 30% MoM growth matches the current trajectory.
Slide 19: Vision & Comparables
The slide outlines a vision for a $10b enterprise value. It lists comparables: Atlassian ($3.3b revenue), GitHub ($7.5b acquisition), Lynda.com ($1.5b acquisition), Salesforce ($13.3b revenue), and Stripe ($35b valuation).
This slide is meant to calibrate the investor's "exit expectations." By listing GitHub and Lynda.com, Almanac is framing itself as a hybrid of a technical workflow tool and a content/learning platform. The mention of Stripe and Salesforce suggests they view themselves as a foundational "infrastructure" layer rather than just a simple app.
The strongest version of this slide would more clearly connect the "Comparable Platform Models" to Almanac's specific features. For example, "Like GitHub, we have branching; like Lynda, we have expert content." As it stands, it’s just a list of successful companies.
Slide 20: Defensibility & Why Almanac Wins
Almanac lists five pillars of defensibility: Network effects, Compounded experience curve (in the Core), Integration of features, Economies of scale, and Bundled services. It uses a rising staircase graphic.
This is a "moat" slide. The "Compounded experience curve" in the Core is the most compelling point—the more expert guides Almanac has, the harder it is for a new competitor to catch up. This is a "data moat" or "content moat" that theoretically protects their margins over time.
The strongest version of this slide would focus on the "Switching Costs." Once a company has moved its internal documentation and "forked" dozens of Core guides into its private repo, leaving the platform becomes extremely painful. Highlighting that "stickiness" is key for enterprise investors.
Slide 21: The Ask & Roadmap
The company is raising $3M to reach "$XM in ARR by Q1 2021." The roadmap includes "Real-time editing" in H1 2020 and "Deep third-party integrations" in H2 2020. It also mentions a "Contributor consulting service" as a future potential revenue stream.
Raising $3M is a standard Seed round size for 2019. However, the use of "$XM" instead of a specific number for the ARR goal is another instance of redaction that makes it difficult to assess the target efficiency of the $3M spend. The roadmap is heavily focused on reaching feature parity with tools like Google Docs (real-time editing) and Notion (integrations).
The strongest version of this slide would specify exactly what the $3M will be used for—e.g., "Hire 6 engineers, 2 sales reps, and scale core content to 5,000 guides." Clearer "Use of Funds" is always preferred over a general roadmap.
Slide 22: Closing Slide
The final slide repeats the logo and dark green branding. It includes the name "Adam Nathan" and the phrase "Let’s get to work."
This is a standard, professional close. It maintains the brand aesthetic established on the title slide.
The strongest version of this slide would include a summary of the "Big Idea"—one final sentence that leaves the investor with the core thesis: "Building the digital infrastructure for the world's 100 million knowledge workers."
Concrete fixes in priority order
Unmask the Traction: Slide 9 and Slide 15 have placeholders or redacted data. A pitch deck lives or dies by its evidence. Replace the light-gray boxes with actual logos, conversion rates, and seat counts to prove the "growth loops" are real. · Prove the "10x" Claim: Slide 13 uses hypothetical time savings. Use data from the "50 customers" mentioned on slide 9 to show actual time saved or articles created per user. · Clarify the GTM: The deck mentions "Bottoms-up," "Direct Sales," and "Inside Sales." Slide 18 shows a mix of these. The deck needs a specific slide explaining how a single user in the "Core" becomes a 500-seat Enterprise deal. · Show the "Diff": The deck relies heavily on the "GitHub for Docs" analogy. Slide 12 mentions "Doc Change Log (diff view)" and "Merge Requests," but these are never shown. Screenshots of these specific, unique features should replace the generic sharing menu. · Refine the TAM Math: Slide 2 uses SF tech salaries to calculate a global economic waste of $2,366/month per employee. This is an outlier. Re-calculate this with national averages to make the ROI argument more credible for non-tech sectors like Law or Accounting.
Frequently asked questions
- What is Almanac?
- Almanac identifies as "GitHub for knowledge professionals," providing a platform for finding, branching, and collaborating on digital business documentation.
- What is Almanac's growth model?
- The deck describes a bottoms-up model where free users and experts contribute to a "Public Core," which then drives users to create "Private Repos" for their companies.
- What was Almanac's traction at the time of this deck?
- As of October 2019, the deck claims 50 customers (including those on first-month trials) and 500 guides/templates in their library.
- How much faster does Almanac claim to be than traditional methods?
- The deck claims a 10x speed improvement, reducing a 56-minute manual workflow to a 6-minute automated one on Almanac.
- Who is the target market for Almanac?
- Almanac targets 91 million US knowledge sector professionals across tech, finance, law, accounting, and academia.